
Square
Following
Hot
News
Notifications
Profile
Share your thoughts
placeholder
Article
#ETH #BTC
The battle to defend 2000 and 70000 has officially begun. Let's wait and see. If it fails, an epic drop will follow.
post-image
ETH-1.26%
BTC-0.67%
How can you quickly reset your trading mindset after consecutive BTC losses?

In BTC futures trading, consecutive losses are a phase many traders experience. The real danger is not the losses themselves, but the chain reaction that follows: rushing to recoup losses, opening positions frequently, continually increasing leverage, and even starting to go against the original trading plan. In the end, an ordinary loss can turn into a greater risk to the account.

So how should you adjust after consecutive losses?

First, stop impulsive trading. If you lose on several consecutive trades, don't rush
post-image
BTC-0.65%
Trenches
fxUSD
f
bade
b
fxUSD
0x08...d8f6
Market Cap
$.
Change
.
24h Vol
$.
Holders
.
ZIG
Z
bade
b
ZIG
0x8c...1145
Market Cap
$.
Change
.
24h Vol
$.
Holders
.
BTC
B
bade
b
BTC
C5xp...pump
Market Cap
$.
Change
.
24h Vol
$.
Holders
.
CORLA
C
bade
b
CORLA
0xba...7777
Market Cap
$.
Change
.
24h Vol
$.
Holders
.
STONK
S
bade
b
STONK
6GmA...UNgx
Market Cap
$.
Change
.
24h Vol
$.
Holders
.
#USStocksFaceHistoricSelloff Wall Street had its roughest day in months on 5 November, and the damage was concentrated in the names that carried the AI rally. Closing prints from the Gate feed show the S&P 500 ETF (SPY) at $733.00, down 4.41%, and the Nasdaq 100 ETF (QQQ) at $647.05, down 6.49%. Reuters reported that the Nasdaq 100 fell 6.4% and erased about $2.5 trillion in market value, its deepest one-day drop since "Liberation Day" in April 2025. The sell-off started after the midterm results, when investors began to question how much of the AI data-center buildout could survive a Democrat
  • 1
  • 1
The S&P 500 dropped 4.36% (roughly 4.4%) to close at 7,353.73, while the Nasdaq fell 5.5% during a sharp risk-off market session described by Michael Saylor as a rare 4-sigma (4σ) statistical event.‍
#ShareWeekly #USStocksFaceHistoricSelloff
post-image
SPX500+0.19%
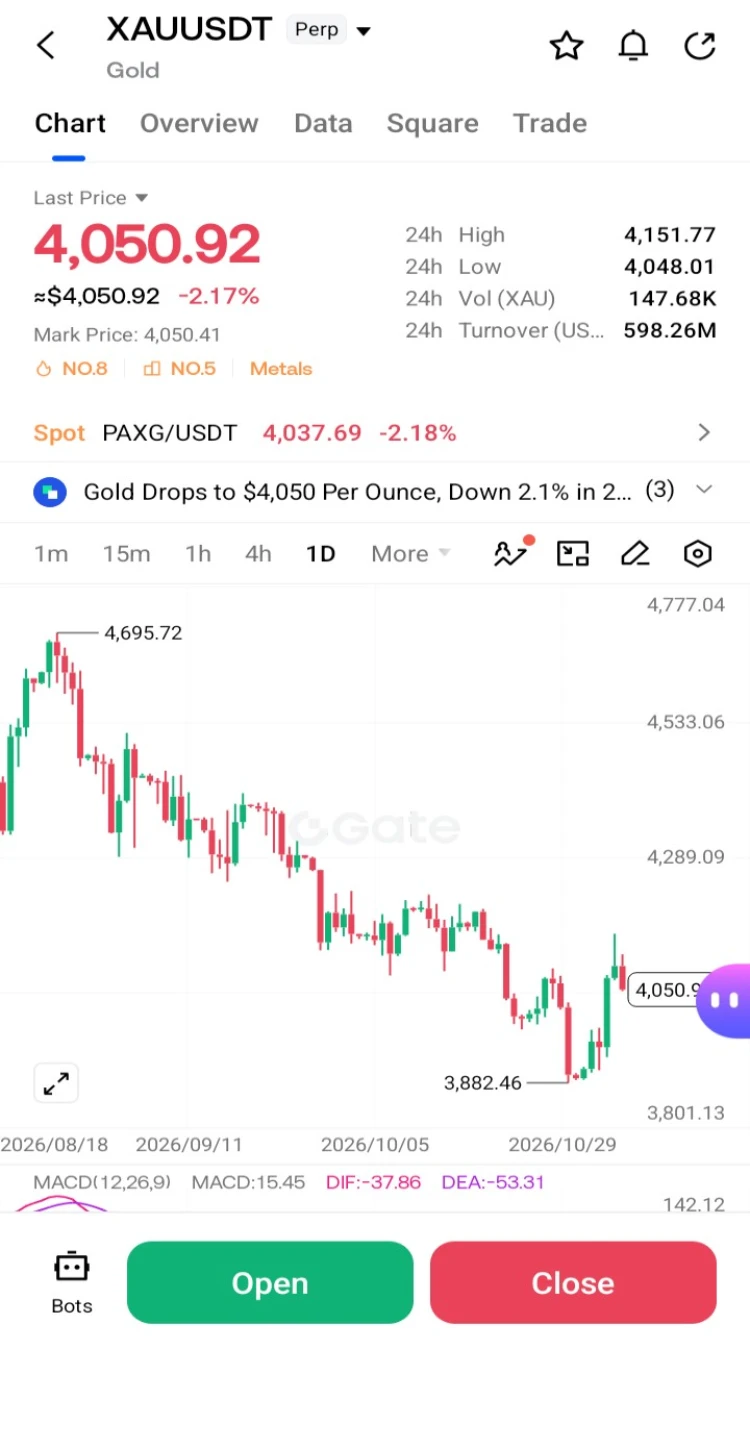
Repeated attempts to move higher have been thwarted, the center of oscillation continues to move lower, and the bearish trend remains intact!$XAU #黄金
post-image
XAU+0.38%
  • 1
$BTC ‌
Overview and Macro Structure
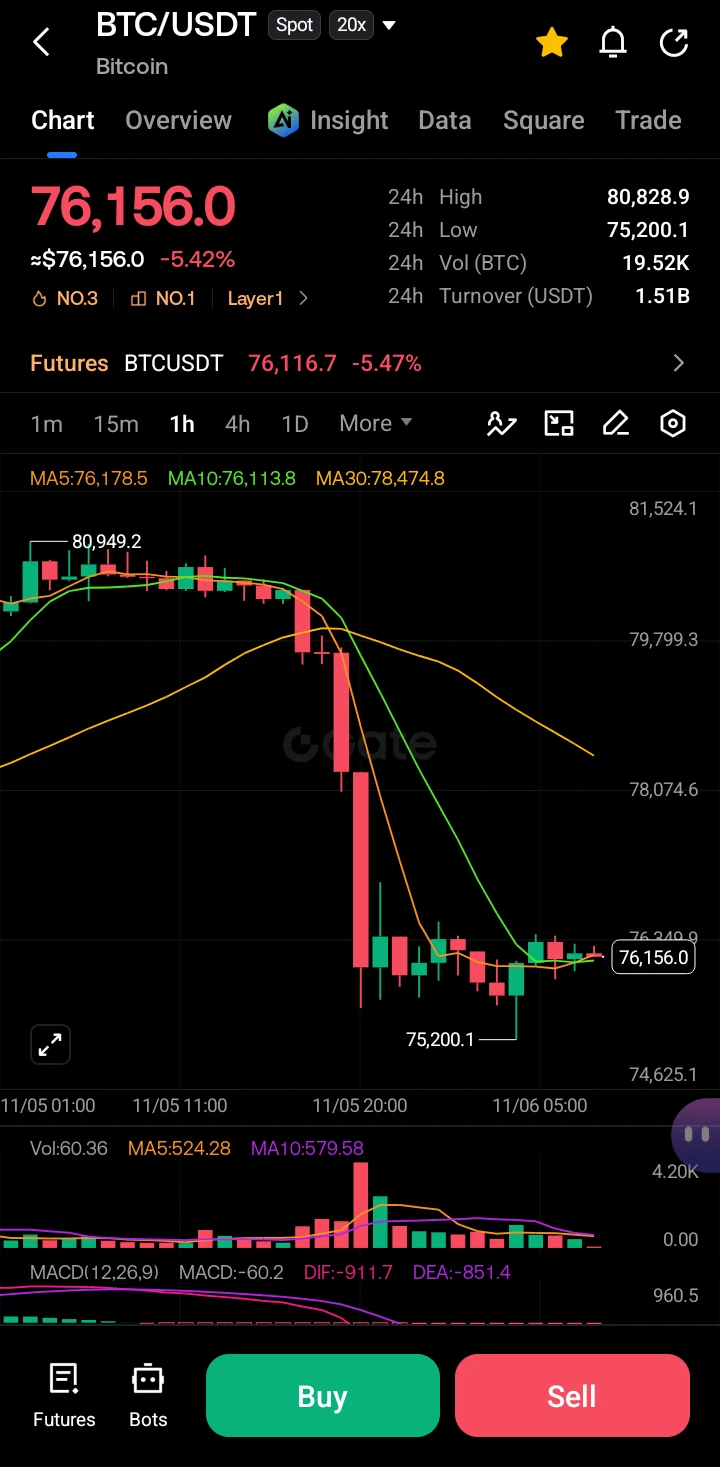
Bitcoin is currently exhibiting a pronounced bearish structure on the intraday charts. Following a rejection near the 80,949.2 local high, the asset has undergone a significant distribution phase, culminating in a sharp impulsive move to the downside. The current spot price sits at 76,156.0, reflecting a 5.42% daily decline. This price action invalidates the prior bullish consolidation and shifts the immediate market bias firmly to the downside.

Moving Average Analysis.

The technical indicators confirm the bearish momentum. The price is trading well below
post-image
BTC-0.67%
  • 5
Market update BTC
live-cover
LIVE1,921
What Is Triangular Arbitrage? How Can You Find Opportunities Using the Price Relationships Between Three Trading Pairs, and Why Can Trading Fees Turn Theoretical Profits Into Losses?

In the cryptocurrency market, price relationships between different trading pairs on the same exchange can sometimes briefly diverge. Triangular arbitrage takes advantage of these discrepancies by completing three consecutive trades to exchange assets, aiming to end up with more of the starting asset. But spotting a price gap does not mean a trade will necessarily be profitable.

First, what is triangular arbitra
post-image
BTC-0.67%
ETH-1.26%
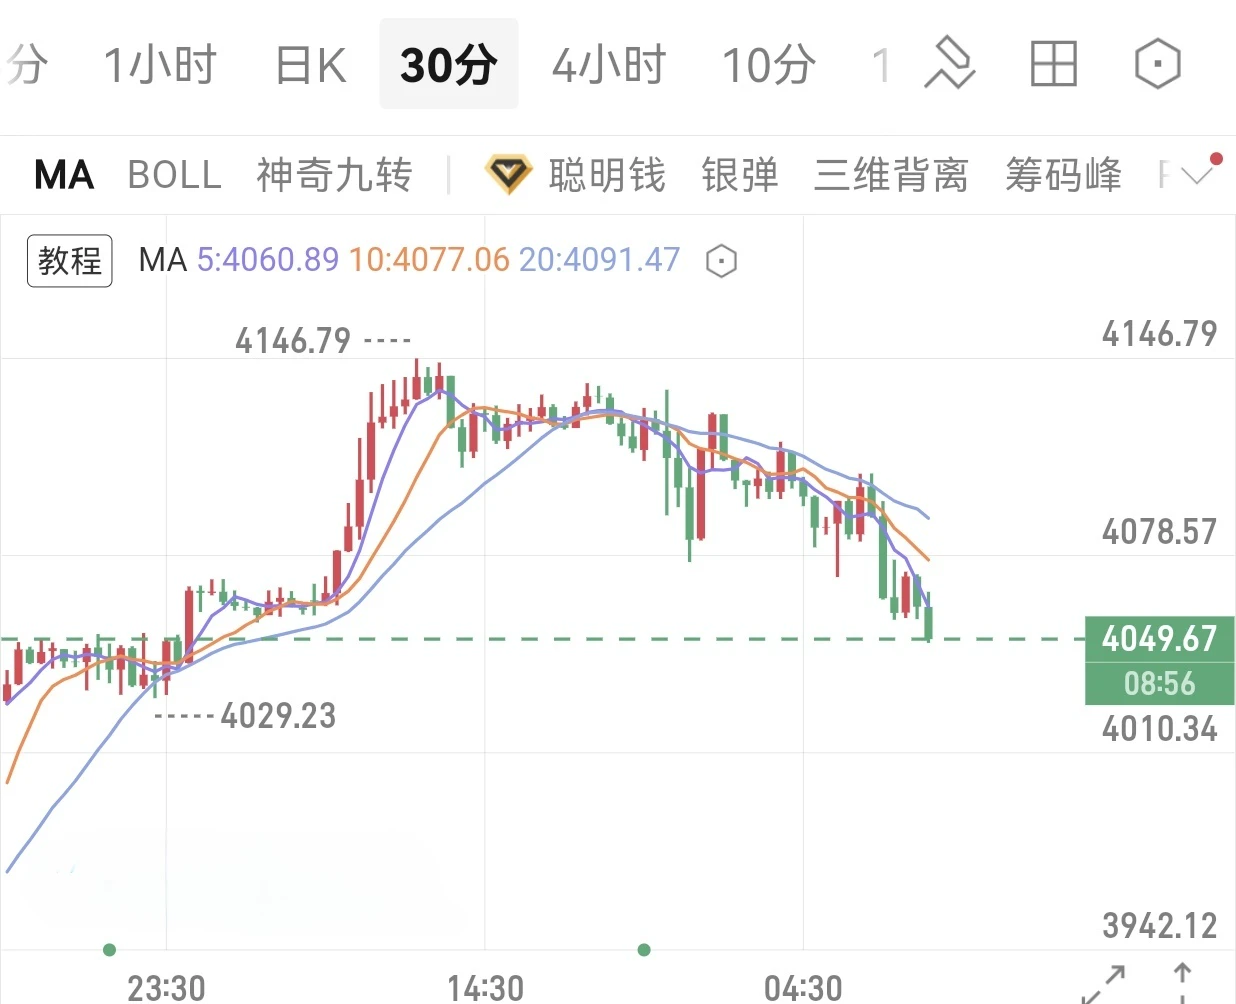
GOLD is showing signs of recovery, but the next resistance test could decide where the market goes from here.

After recent selling pressure, $XAU USD has bounced strongly, with a weaker US dollar and declining Treasury yields helping support the recovery.

Here are the levels I'm watching:

📍 Resistance: $4,113 – $4,150
📍 Support: $4,100 – $4,065
📍 Major downside area: $4,025 – $4,000

My market view:

If buyers manage to push Gold above $4,113 and hold that level, a move toward $4,150 could become possible.

However, losing the $4,065 support zone would weaken the recovery and bring selle
post-image
XAU+0.38%
  • 2
  • 1
How can you tell whether a BTC pullback is a normal correction or a trend reversal?

In BTC trading, one of the most common mistakes people make is treating every decline as a trend reversal. As soon as the price pulls back, they rush to close their positions or even open short positions. But sometimes the market is simply making a normal correction during an uptrend, after which the price strengthens again.

So, how can you distinguish a normal pullback from a genuine trend reversal?

First, watch the structure of highs and lows. In a healthy uptrend, prices typically form progressively highe
post-image
BTC-0.67%
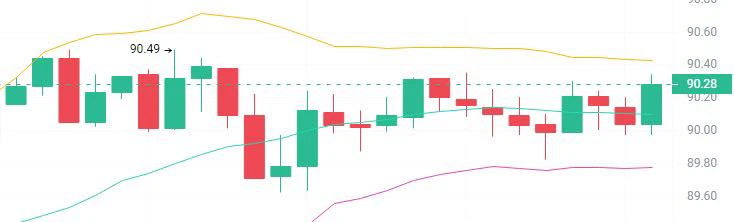
Today's Morning SOL Outlook

Short
Entry range: 90.70 - 91.00 (rebound to the upper band and previous high resistance zone; enter only after momentum stalls and a bearish candle closes)
Stop-loss: above 91.50 (holding above this level would invalidate the short-term bearish outlook)
Targets: 89.80 (middle band) → 88.30 (previous low)

Long
Entry range: 89.70 - 89.90 (pullback to middle band support; consider entering only after a clear sign of a bottom)
Stop-loss: below 89.20 (a break below the lower band invalidates the long)
Targets: 90.70 (upper band) → 91.20

After a sharp drop, SOL has st
post-image
SOL-0.74%
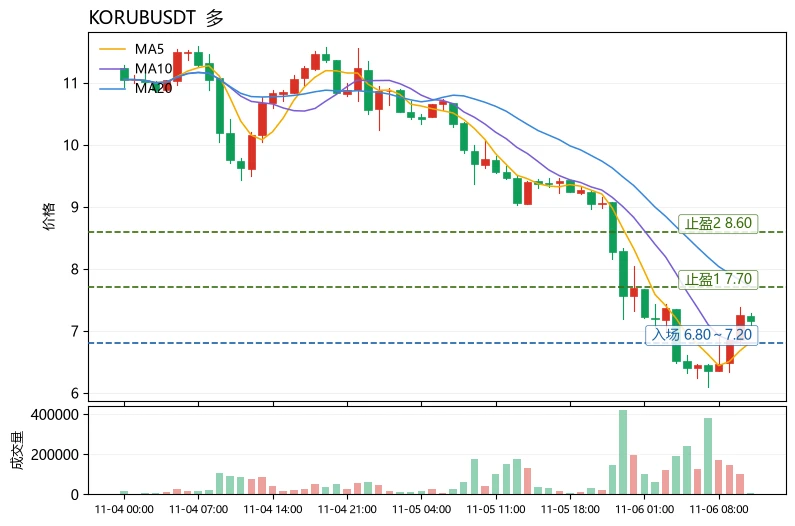
The Fear and Greed Index is only 28. Can KORUB be bought on the dip amid this broad market decline? Yes, a small long position can be tried, but only as a rebound play—not as a reversal to hold.
Market sentiment is in the “fear” zone. BTC weakness has driven a broad selloff in altcoins, with $KORUB plunging 25.42% in 24 hours, significantly more than SOL’s 6.05% and HUMA’s 15.71%, making it a typical high-beta catch-up decliner. Technically, the price at 7.16 has fallen below MA20=7.709, leaving the medium-term structure bearish; however, MA5=6.82 is starting to turn up, the MACD histogram ha
post-image
KORUB
KORUBSouth Korea Bull
Four.meme
MC:$3.67KHolders:1
0%
HUMA-1.99%
SOL-0.77%
[New Streamer] 🔹Democrats Sweep Both Chambers of Congress as the Dow Surges Over 3! But AI Stocks F
live-cover
LIVE1,146
If it’s going to drop, let it drop hard. No matter what, Bitcoin will come back stronger after being pushed to the brink! Hold strong, brothers!
BTC-0.67%
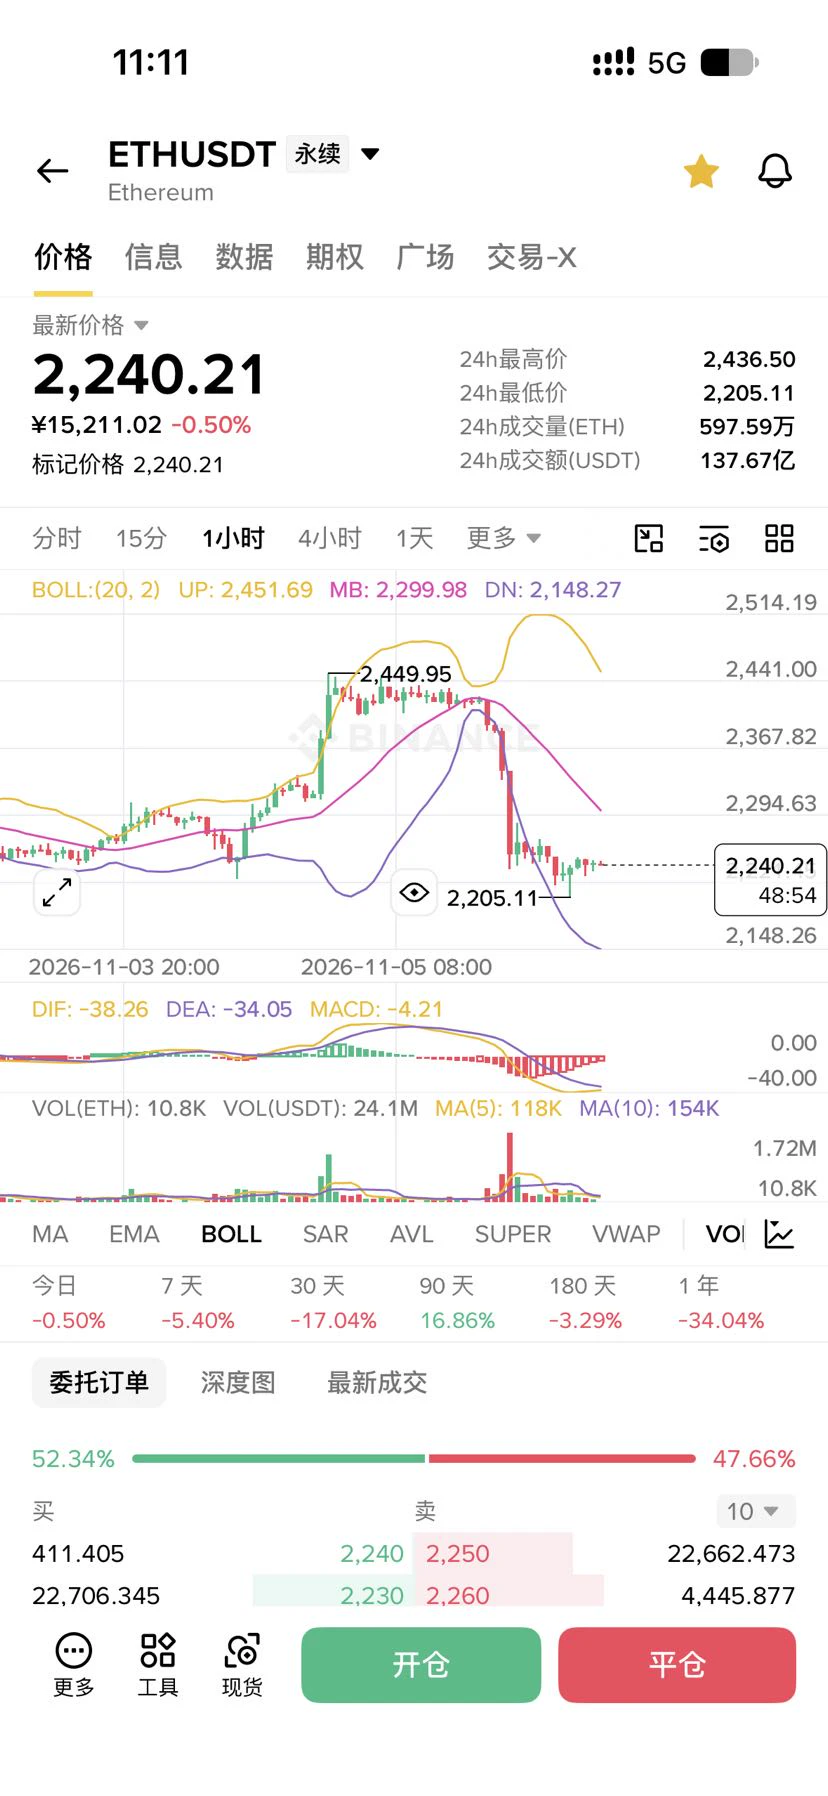
🚨 CRYPTO MARKET ALERT: BEARS ARE IN CONTROL! 📉

The crypto market is facing heavy selling pressure today, November 6.

🔻 Bitcoin (BTC): Around $76,000, down approximately 5.5%.

🔻 Ethereum (ETH): Around $2,240, down approximately 7.5%.

⚠️ Over $1 billion in crypto liquidations have added further pressure to the market.

🔥 Key Things to Watch:

- Can BTC defend the $75K support zone?
- Will ETH recover above $2,300?
- Is this a temporary correction or the beginning of a deeper pullback?

The next market move could be very important. Stay patient, manage your risk, and avoid emotional trad
BTC-0.67%
ETH-1.26%
$GT ‌
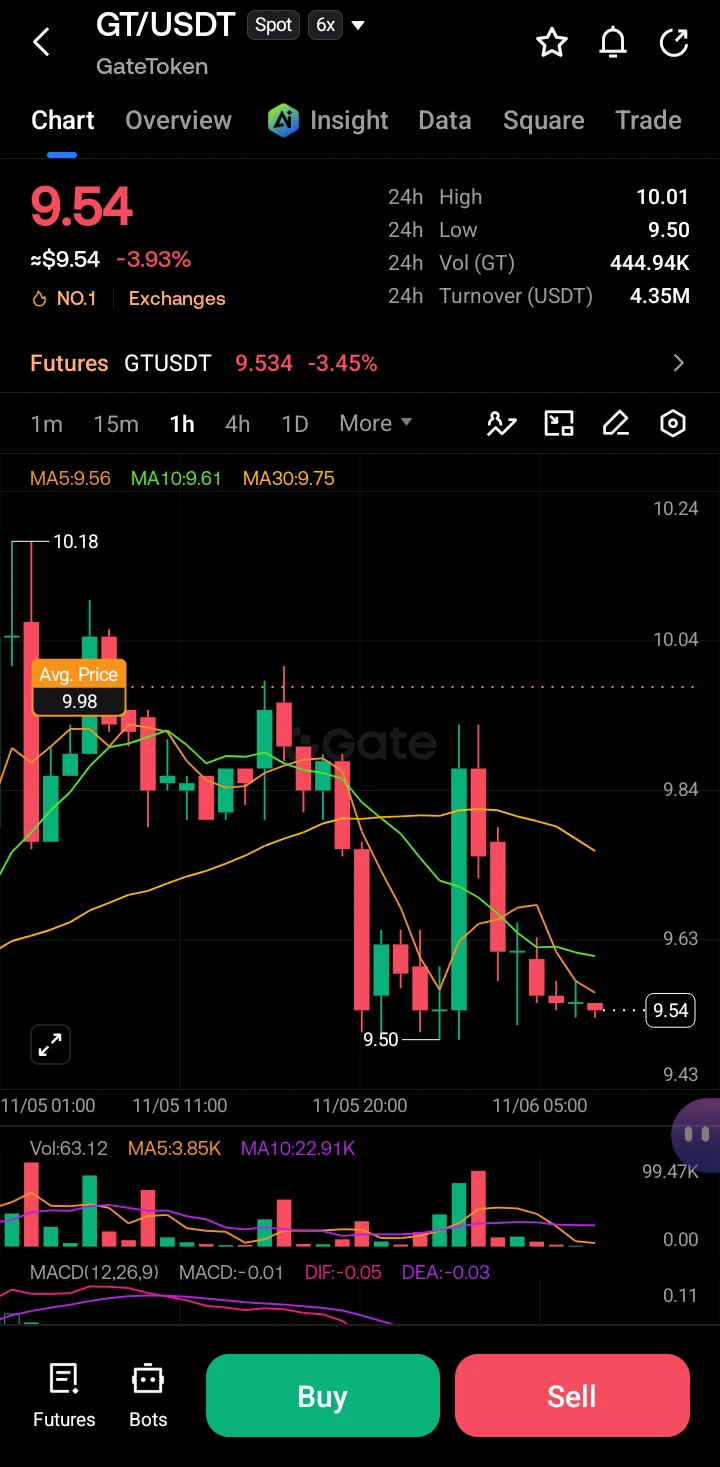
GT is currently exhibiting a short-term bearish structure on the 1-hour timeframe. The asset has failed to sustain its position above the psychological $10.00 level, resulting in a localized downtrend. Price action has shifted from a consolidation phase into a distribution phase, with the current spot price hovering at $9.54, reflecting a -3.93% intraday loss.

Technical Indicators and Structure.

The moving averages (MA5, MA10, MA30) are currently acting as dynamic resistance. The MA5 is trending downward at $9.56, and the price is trading below the MA30 ($9.75), confirming the prevail
post-image
GT-2.41%
  • 7
  • 1
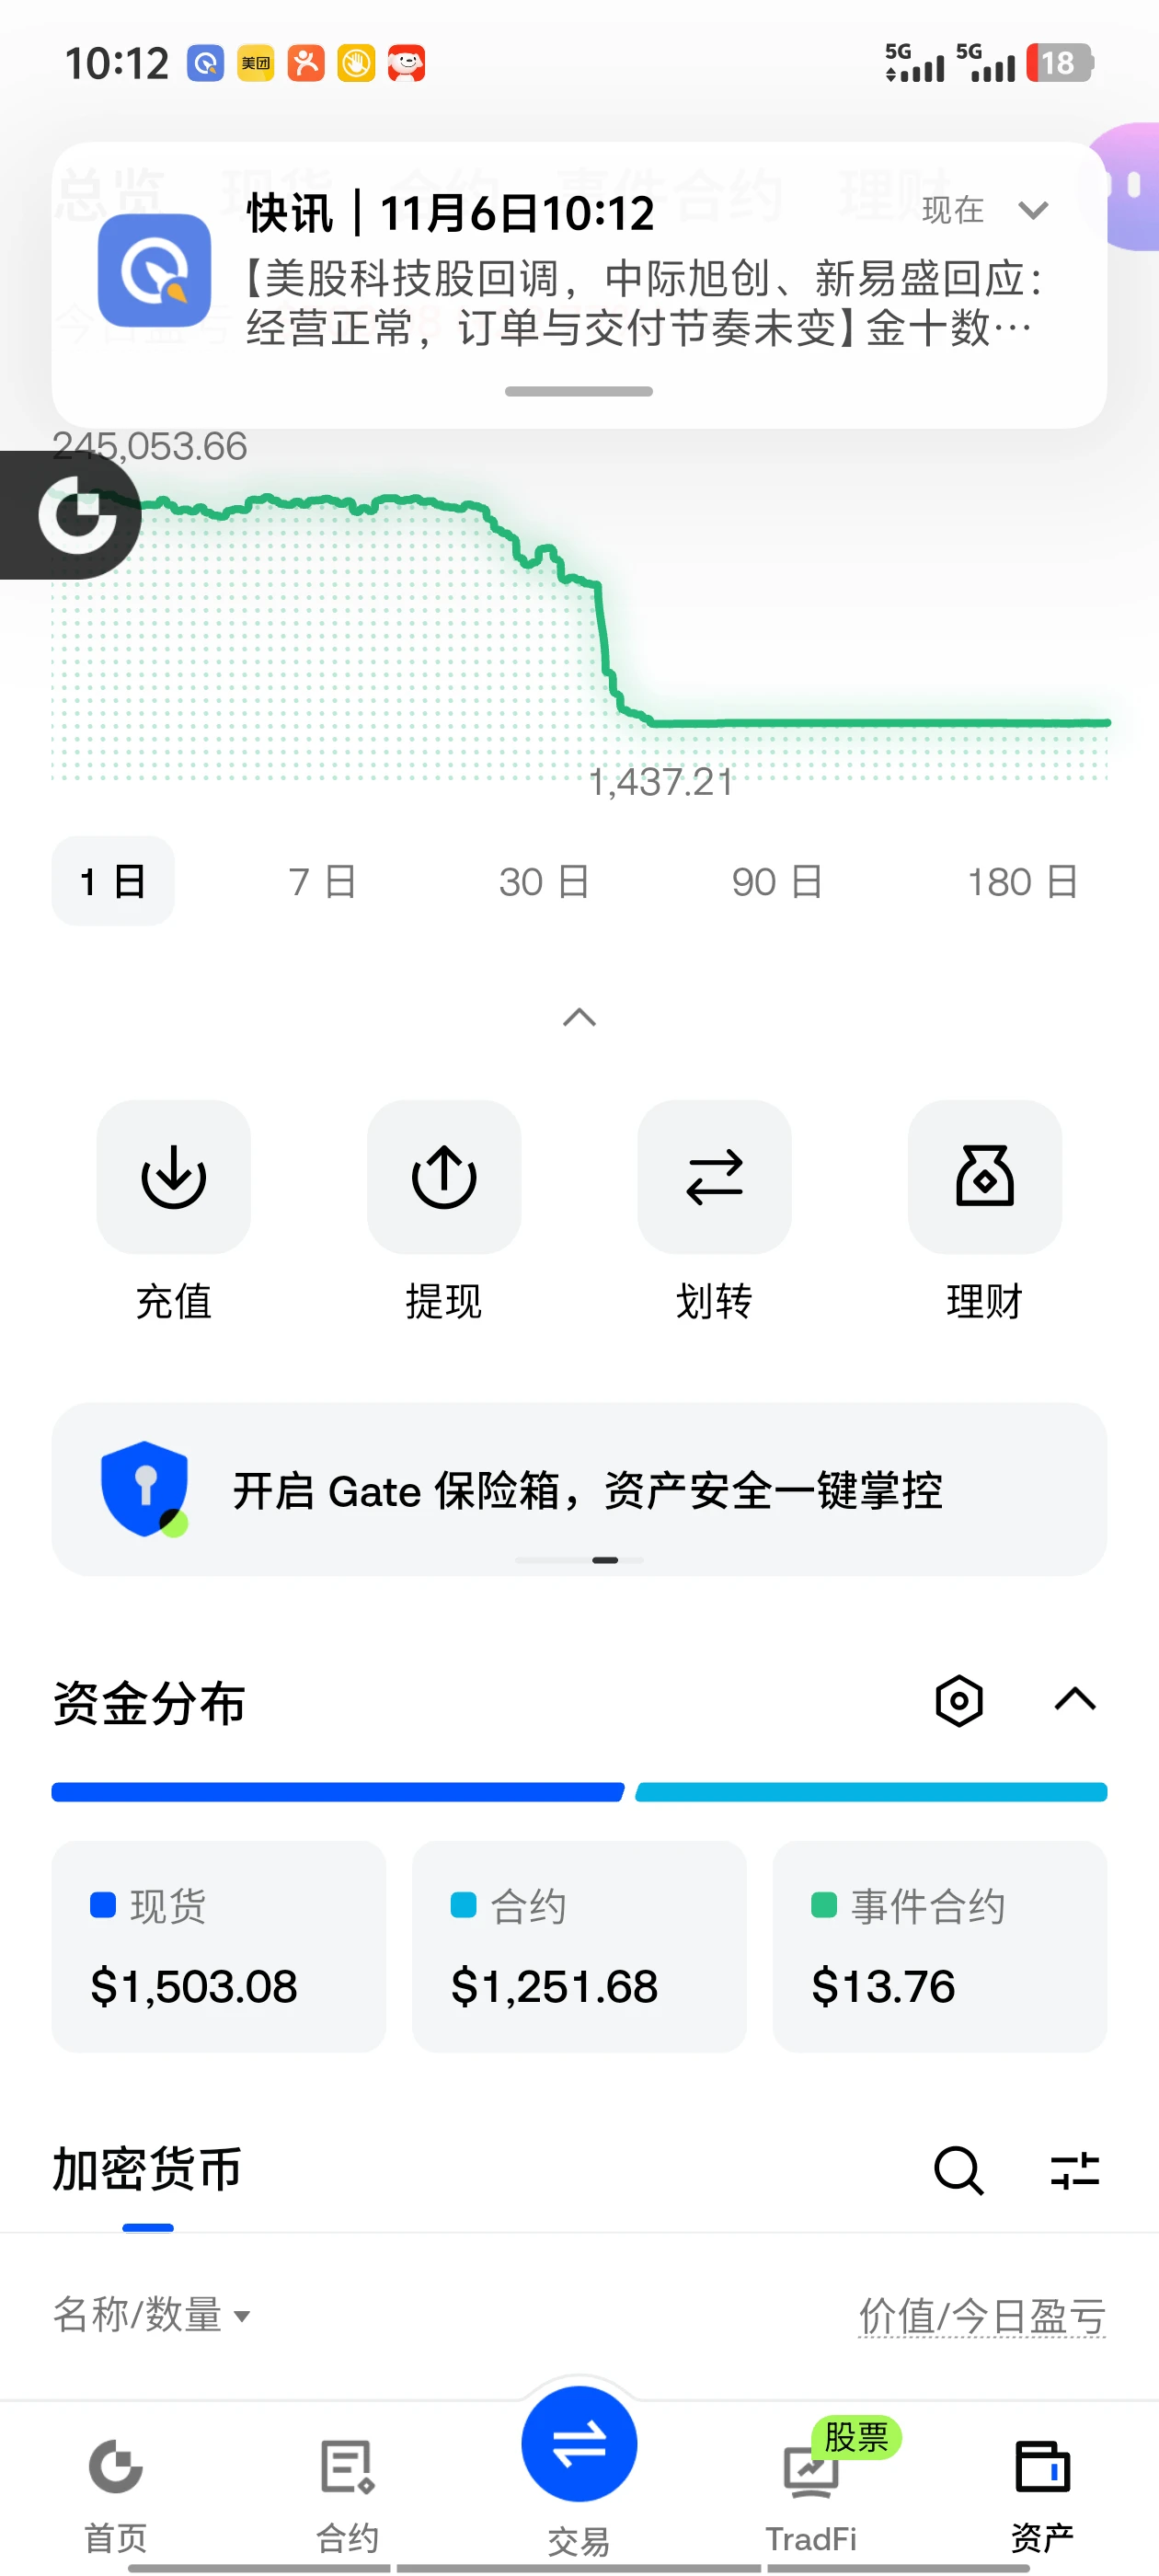
Ding, successful liquidation detected for the host. The 10,000x liquidation cashback system is about to awaken. Activate?
post-image
  • 3
With on-chain patches like this, nobody pays attention until something goes wrong—and then it’s a big deal.

On the evening of November 4, XRP Ledger activated a patch: accounts with only burn permissions should not have minting rights, but under the old rules they could mint tokens themselves under certain conditions. The issue involved on-chain issued assets, including stablecoins; XRP itself was unaffected, and there have been no publicly known exploits to date. The same batch also addressed accounting in the lending module, token recovery from the transaction pool, and signature validation
post-image
XRP-1.15%
2Z-3.17%
🔥 What’s worth talking about today? Gate Square trending topics are live!

🔹 #USStocksFaceHistoricSelloff
Tech stocks are under heavy pressure. Is this just a correction, or the start of a deeper selloff?
🔹 #USNonfarmPayrolls
U.S. jobs data is due tonight. Will it help markets stabilize, or trigger another round of volatility?
🔹 #CryptoMarketUnderPressure
$BTC and $ETH are falling with broader risk assets. Buy the dip, reduce exposure, or stay on the sidelines?

Quality content can get traffic support + Featured placement.
💰 Got a view? Share it:
https://www.gate.com/post/topic
post-image
BTC-0.67%
ETH-1.26%
  • 9
  • 5
The 803 level I gave fans in the comments yesterday was hit perfectly
Fans who saw it went all in and should be able to hold for the long term
post-image
  • 4
Load More

Join 40 M users in our growing community

⚡️ Join 40 M users in the crypto craze discussion

💬 Engage with your favorite top creators

👍 See what interests you

Trending Topics

USStocksFaceHistoricSelloff

586 Views3.47k Discussing

U.S. stocks suffered a sharp selloff on Thursday, with the Nasdaq closing down more than 5% and the Philadelphia Semiconductor Index falling over 12%. AI and chip stocks including $NVDA and $AMD were hit especially hard. Markets are reassessing AI valuations, data-center spending and future returns. Is this just short-term deleveraging, or the start of a deeper correction in the AI trade? Which sectors are you watching next?

GateLaunchesPoSECProofOfSecurity

11.51k Views568 Discussing

USNonfarmPayrolls

8.95k Views3.99k Discussing

View More