MonkeyKingOrderFlow
vip
Age 0.1 Year
Peak Tier 0
7 years in the financial industry Specialized in order flow and footprint charts to capture trading opportunities Personal belief: In the information age, do not use the twig in your hand to compete with market makers.
Pin
In the crypto world, you actually don’t know what order footprints are!
This is just like going into battle without watching where the enemy is going; you're being harvested and don't even know what's happening!
Let's clarify its principle today - once you understand this thing, the main players will seem to you like they are 'running naked'!
Aren't you also wondering why following the K-line often leads to losses? In fact, the K-line is like a "post-mortem", showing you the results of the match while hiding the entire game footage. But the order footprints are diff
BTC-1.16%
ETH-4.18%
View Original
post-image
  • Reward
  • 2
  • Repost
  • Share
GateUser-3c75a326vip:
Bro, what software?
View More
"Must-Know for Crypto World Trading! Delta Value - Unveiling the Mysterious Code of Market Trends"
In the ever-changing battlefield of the crypto world, every subtle indicator can become a key factor in determining victory or defeat. Today, Monkey Brother will continue to delve into new knowledge in order flow — delta. If you don't understand it yet, trading in the crypto world is truly like guessing blindly, full of uncertainty!
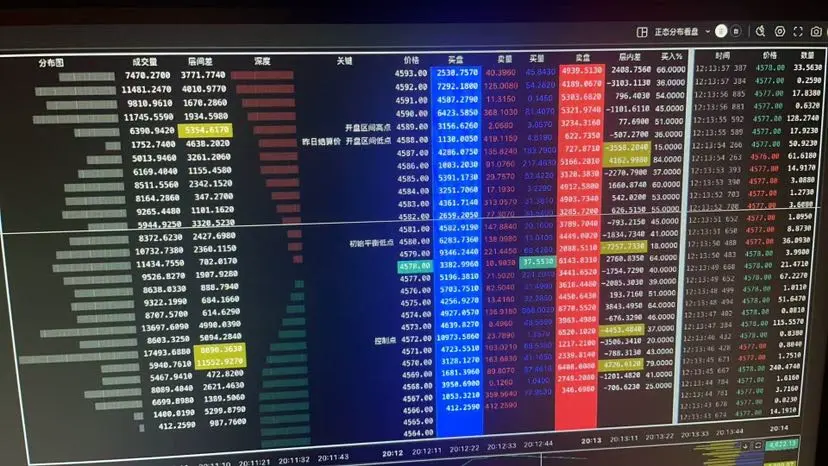
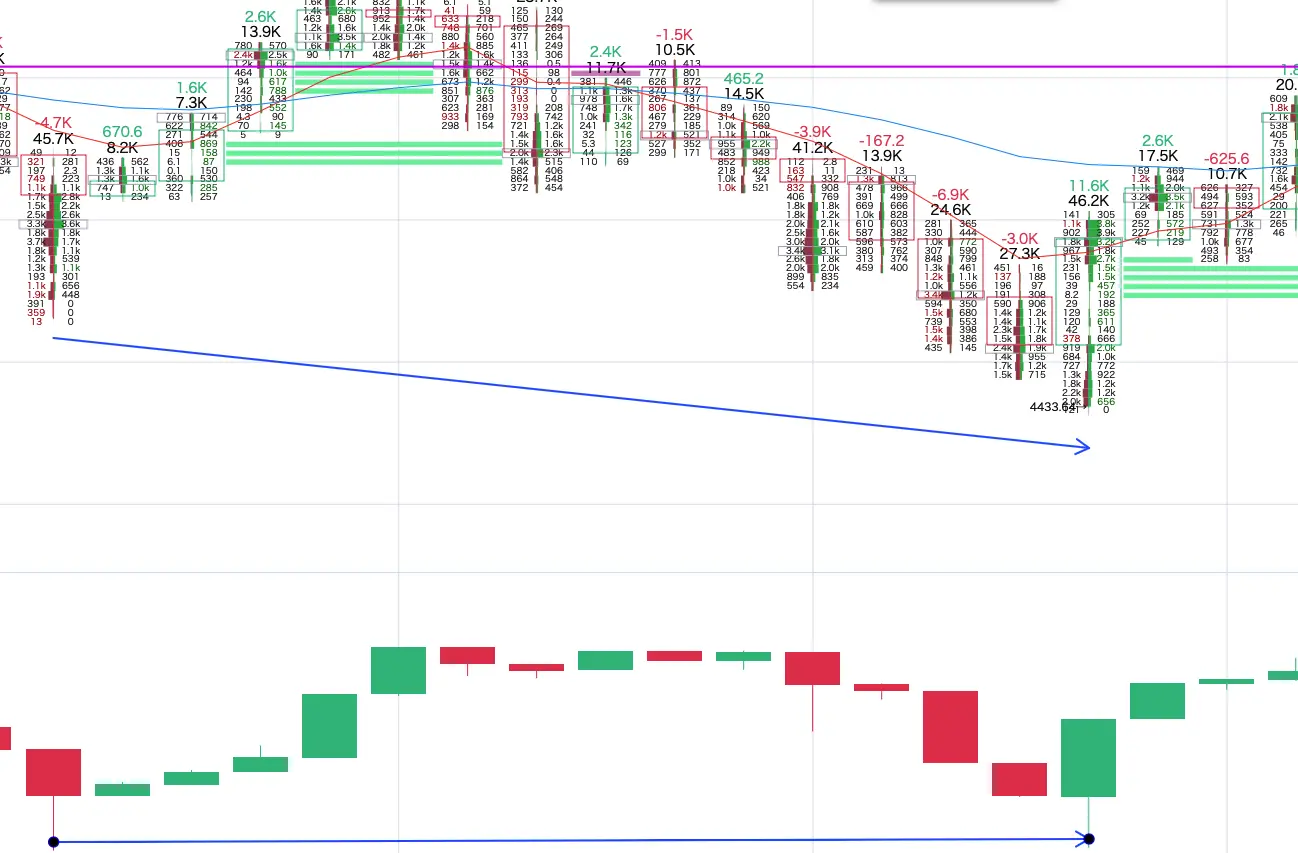
What exactly is Delta? It is not a simple concept; delta refers to the value obtained by subtracting active sell from active buy. The magnitude of this value is s
BTC-1.16%
ETH-4.18%
View Original
  • Reward
  • Comment
  • Repost
  • Share
#BTC再创新高 #十月加密市场预测
The current Ethereum price has reached a high of 4730.
Pay close attention to the price range of 4780-4800 and around 5000. If it cannot break through this level, a top divergence structure may occur, leading to a significant pullback.
The same Bitcoin is also focused on the range of 126000-130000.
If we cannot break through and stand firm here, there are still signals of reaching the peak.
The current trend is still a strong upward pattern. Just looking at the daily candlestick chart, Bitcoin bulls are showing signs of fatigue, while Ethereum seems to have a corrective ral
ETH-4.18%
BTC-1.16%
View Original
Bitcoin price trend prediction
BTC continues to strengthen
1
1
btc starts to pullback
2
2
3 ParticipantsVoting Finished
  • Reward
  • 1
  • Repost
  • Share
MonkeyKingOrderFlowvip:
Just go for it💪
The first live broadcast on the platform, some features are still being debugged......
Stay tuned
View Original
  • Reward
  • Comment
  • Repost
  • Share
btc has reached a new high again, is the new high a true breakthrough or a false breakout? How should we judge? In fact, you and the expert are just like lacking a footprint map. Of course, it seems like hindsight wisdom to say this now.
We will only talk about the technology now, not the entry points. If there is a continuous rise, and the rising candlestick does not have many active buy orders, and in the later stage of the rise, a candlestick pattern with upper wicks appears (today's BTC is behaving like this).
How can we determine if it is a true or false breakout?
If we add the footpr
ETH-4.18%
BTC-1.16%
View Original
post-image
  • Reward
  • Comment
  • Repost
  • Share
#BTC走势分析 bearish traders do not explode, shorting has no opportunity $BTC
BTC-1.16%
View Original
  • Reward
  • Comment
  • Repost
  • Share
It has been a few days since the beautiful side has stalled, and the US Non-farm Payrolls (NFP) data has not been released normally. This is also favourable information for the encryption circle. Because these events can significantly increase expectations of interest rate cuts, just look at the current gold price and the Nasdaq index. Coupled with the recent BTC trend, it all makes sense. #BTC走势分析 #十月加密市场预测
ETH-4.18%
BTC-1.16%
View Original
post-image
  • Reward
  • Comment
  • Repost
  • Share
Order flow mastering the crypto world-----Footprint chart
The footprint chart is like an X-ray that can see the buying and selling situation of each candlestick. When there is an imbalance between the bearish and bullish forces in a price range, the price will rush towards areas with less liquidity.
If a constraint is added to this feature, where orders at three consecutive price levels experience an imbalance of more than three times, then the certainty in that direction will be higher. When combined with the divergence of delta and K-line, it would be a good entry point with certainty.
View Original
post-image
  • Reward
  • Comment
  • Repost
  • Share
  • Trending TopicsView More
  • Pin
Trade Crypto Anywhere Anytime
qrCode
Scan to download Gate App
Community
English
  • 简体中文
  • English
  • Tiếng Việt
  • 繁體中文
  • Español
  • Русский
  • Français (Afrique)
  • Português (Portugal)
  • Bahasa Indonesia
  • 日本語
  • بالعربية
  • Українська
  • Português (Brasil)