Square
Following
Hot
News
Notifications
Profile
Share your thoughts
placeholder
Article
EVAA | Long 🟢 | Bullish | 15m24h: +7.97% | Volume: 322.3M USDTLong rationale: Price above EMA200; EMA20/50/200 in bullish alignment; RSI14 at 60.6; MACD histogram positive; ADX14 at 18.5; volume at 0.69x the 20-candle average; trend pullback/continuation. Entry: 6.4238Stop loss: 6.26472Take profit 1: 6.62265 | Take profit 2: 6.74197 | Take profit 3: 6.90105For reference only; do not chase price. This strategy is invalidated if the stop-loss level is hit. Technical analysis strategy only, not investment advice.$EVAA
post-image
EVAA-0.49%
$KOR 305.2 million tokens unlocking on December 4,
post-image
  • 3
Trenches
IDOL
I
bade
b
IDOL
0x3b...ab07
Market Cap
$.
Change
.
24h Vol
$.
Holders
.
PIEVERSE
P
bade
b
PIEVERSE
0x0e...25a9
Market Cap
$.
Change
.
24h Vol
$.
Holders
.
FIONA
F
bade
b
FIONA
B34n...pump
Market Cap
$.
Change
.
24h Vol
$.
Holders
.
Singularity
S
bade
b
Singularity
7R4M...pump
Market Cap
$.
Change
.
24h Vol
$
Holders
.
CLAUDIA
C
bade
b
CLAUDIA
2j5S...W2ZM
Market Cap
$.
Change
.
24h Vol
$.
Holders
.
Day four
ETH's monthly Bollinger lower band is already near 1,000! It's currently around 1,600; if it really heads lower? That's not impossible! That's a little scary!
post-image
ETH-1.26%
WEEKEND PREDICTION
live-cover
LIVE83
BTC-0.65%
SOL-0.74%
DOGE-0.18%
ZEC+1.29%
XAU+0.38%
Bitcoin $BTC is currently replaying a cycle script that is often overlooked: First came a sharp plunge to $57,800, and panic quickly spread; then the price rebounded to $87,300, leading people to believe the bottom was firmly in, confidence returned, and buyers reentered the market; then came a second heavy blow, sending the price straight down to $55,000 and breaking below the previous low, flushing out those who had rushed to buy the dip.

Analysts stress that the real washout often happens after the market broadly concludes that the bottom is in, and the first rebound must never be taken a
post-image
BTC-0.67%
NVDA-13.84%
ET-2.43%
SOL-0.77%
$VVV is showing a clear recovery, with short-term buying becoming active again.
My long setup: entry range at .1206–$24.3940, target at $25.7609, stop at 23.0271
From the chart, as long as $VVV holds 23.7110, the bullish structure will remain intact; a break above 24.5190 could open the way for a further move toward 27.1278.
$VVV SOL AKE
Risk warning: The above reflects only my personal market view and is not investment advice. Contract trading is highly volatile, so be sure to manage position sizes and stop losses.
post-image
24
2424
Pump.Fun
MC:$3.14KHolders:2
26.19%
VVV+0.37%
$BTC ‌The sea of red we saw on our screens may have sent a shiver down all of our spines for a moment. Bitcoin dipped below $60,000 for the first time since July, even falling as low as $55,130 at one point. Some of you might have wondered, "Is something even worse on the horizon?" Yet, markets sometimes offer a bit of breathing room, even in their darkest moments. That is precisely what happened: as the weekend approached, Bitcoin staged a recovery, climbing back to the $60,279 level.

So, what fueled this rapid rebound? In essence, the crypto market was purging its own internal excesses. Ac
BTC-0.67%
  • 5
  • 3
#CookBacksFurtherRateHikes
The Fed's Hawkish Warning Could Change the Entire Market Outlook: Bitcoin, Tech Stocks and Gold Face a New Challenge

The Federal Reserve's inflation battle is entering another critical phase, and the latest comments from Governor Lisa Cook have introduced a fresh source of uncertainty across global financial markets.

On November 20, Cook questioned whether September's 25-basis-point rate increase would be sufficient to bring inflation under control. Her warning was particularly important because she highlighted the potential consequences of delaying further action
post-image
BTC-0.65%
MU-13.88%
ANT-8.68%
  • 3
  • 1
$IDOL This rally looks like luck, but it was really an opportunity that had been lying in wait for a long time. The name is clever, and the price action delivered too, hitting 0.048 with pinpoint accuracy, like a tailor-made starting point. It surged +50.13%, leaving little time for anyone to hesitate.
$IDOL The contract tag is still there; the story has only just begun.
Risk warning: The above reflects personal views only and does not constitute investment advice. The crypto market is highly volatile, so please be sure to manage risk.
post-image
IDOL-6.71%
Parabolic blow-off top confirmed; the long squeeze has begun. It’s time to ride this downtrend all the way down. Join the shorts, contact $IDOL . Entry: 0.038756 - 0.039609 Target area: 0.035035 / 0.031717 Stop-loss: 0.042299 Note: Extreme volatility may trigger a stop-loss sweep and a rebound to 0.04100 before the final leg down. Don’t go all in, bro. Manage your position size based on your account.
post-image
IDOL-6.71%
ELSA | Long 🟢 | Bullish | 15 minutes 24 hours: +0.59% | Volume: 36.4M USDT Long rationale: Price above EMA200; EMA20/50/200 are in bullish alignment; RSI14 is 51.3; MACD histogram is positive; ADX14 is 23.4; volume is 2.87 times the 20-candle average; trend pullback/continuation. Entry: 0.06789 Stop loss: 0.0667006 First target: 0.0693768 | Second target: 0.0702688 | Third target: 0.0714582 For reference only; do not chase the price. Hitting the stop loss invalidates this strategy. Technical analysis strategy only, not investment advice. $ELSA
post-image
ELSA+5.80%
🔹 NVIDIA Interim CEO Colette Kress Faces a “Glass Cliff” as She Must Deal With Jensen Huang’s Legac
live-cover
LIVE48
BTC-0.67%
XAUUSD-2.40%
XAU+0.38%
ETH-1.23%
NVDA-0.35%
Driven by active trading volume, price action continues to edge higher; despite limited overall market participation, resistance remains intact. The uptrend is showing initial momentum, but the indicators have yet to fully align, suggesting the move may stall. $AKE — Long entry: 0.005343 Take-profit 1: 0.005401 Take-profit 2: 0.005450 Stop-loss: 0.005129
post-image
AKE+6.07%
XRP Technical Outlook: Bearish Pressure Continues as Price Tests $0.93 Support

XRP is trading around $0.9364 after another strong bearish move on the daily chart. Price has broken below the previous support structure and is trading beneath all four major EMAs. Sellers remain in control, while the $0.8619 area is now an important support zone to watch.

EMA Structure

XRP is trading below all major moving averages, confirming a bearish market structure.

- 20 EMA: $1.0502
- 50 EMA: $1.1777
- 100 EMA: $1.2374
- 200 EMA: $1.3108

The 20 EMA remains below the 50, 100, and 200 EMAs. This alignment
XRP-1.12%
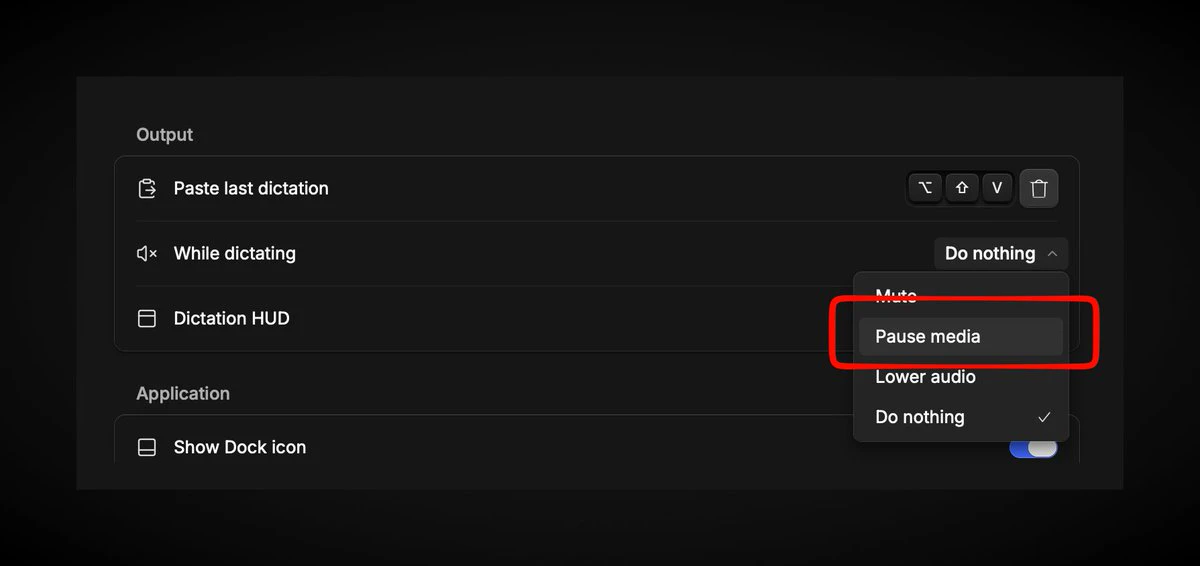
TIL, Hex let's you pause media when you are dictating 🙌
post-image
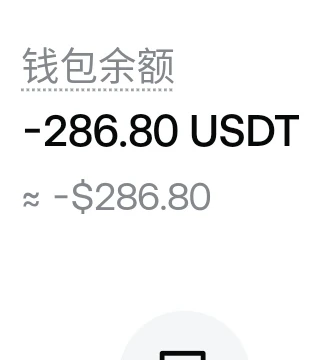
3372.56@开户以来, that's a huge loss
Strategy stated that all 850,849 BTC in its treasury are unencumbered, meaning none are pledged as collateral for loans as Bitcoin slid toward $55,000 amid heavy market selling.
The 850,849 BTC was acquired at an average price of $75,452 (approximately $64.20 billion total cost), per Strategy's mid-November 2026 SEC filing disclosures.
MSTR shares have also faced pressure alongside Bitcoin and spot ETF outflows, with many analysts pointing to dilution from at-the-market equity issuance used to fund preferred stock (STRC) repurchases and dividends.
‍#ShareWeekly #BTC #BTCBreaksBelow60K
post-image
BTC-0.67%
MSTR-9.49%
STRC-0.90%
Load More

Join 40 M users in our growing community

⚡️ Join 40 M users in the crypto craze discussion

💬 Engage with your favorite top creators

👍 See what interests you

Trending Topics

BTCBreaksBelow60K

2.1M Views30K Discussing

BTC fell below $60,000 on November 20 for the first time since July, alongside a tech stock selloff and broader pressure on risk assets. Will $60K become resistance, or can BTC quickly reclaim it? What price or volume signals would convince you that selling pressure is easing?

GateDirectIPOPhase3ANTAllocates92100Shares

797.2K Views4.9K Discussing

NvidiaDropsNearly14Percent

333.9K Views7.6K Discussing

View More