Square
Following
Hot
News
Notifications
Profile
Share your thoughts
placeholder
Article
$SOL
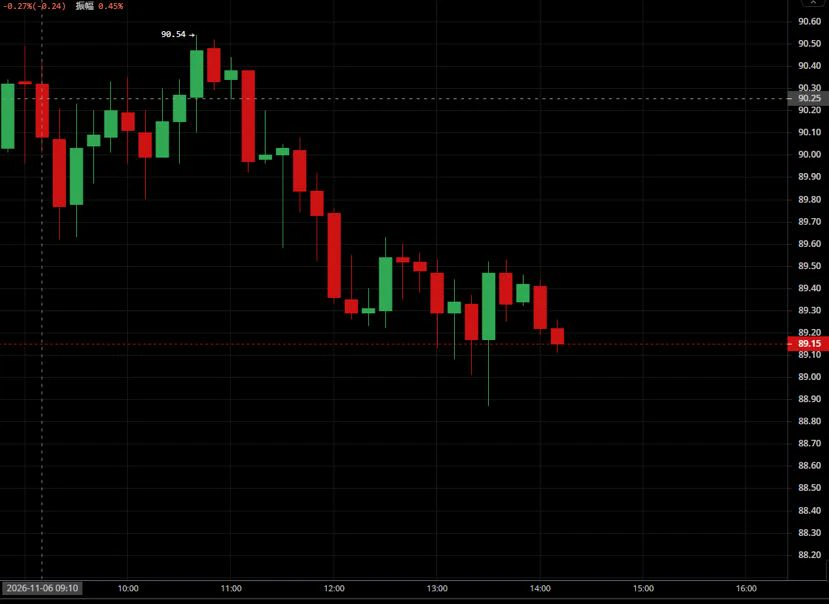
90.5 resistance worked precisely, and the short target was successfully hit
The morning call suggested shorting at 90.3–90.5. The price rose to 90.54 intraday before meeting resistance and pulling back. It has now fallen below the first target of 89.2, with the decline fully in line with expectations.
#美股史诗级抛售
The broader bearish trend remains unchanged; the rebound is just a window to enter short positions at higher levels.
The next support below is around 88.5. If the price continues to break lower, follow the trend and look for new lows.
post-image
Top-OutMemo
11.6 $SOL Today's outlook
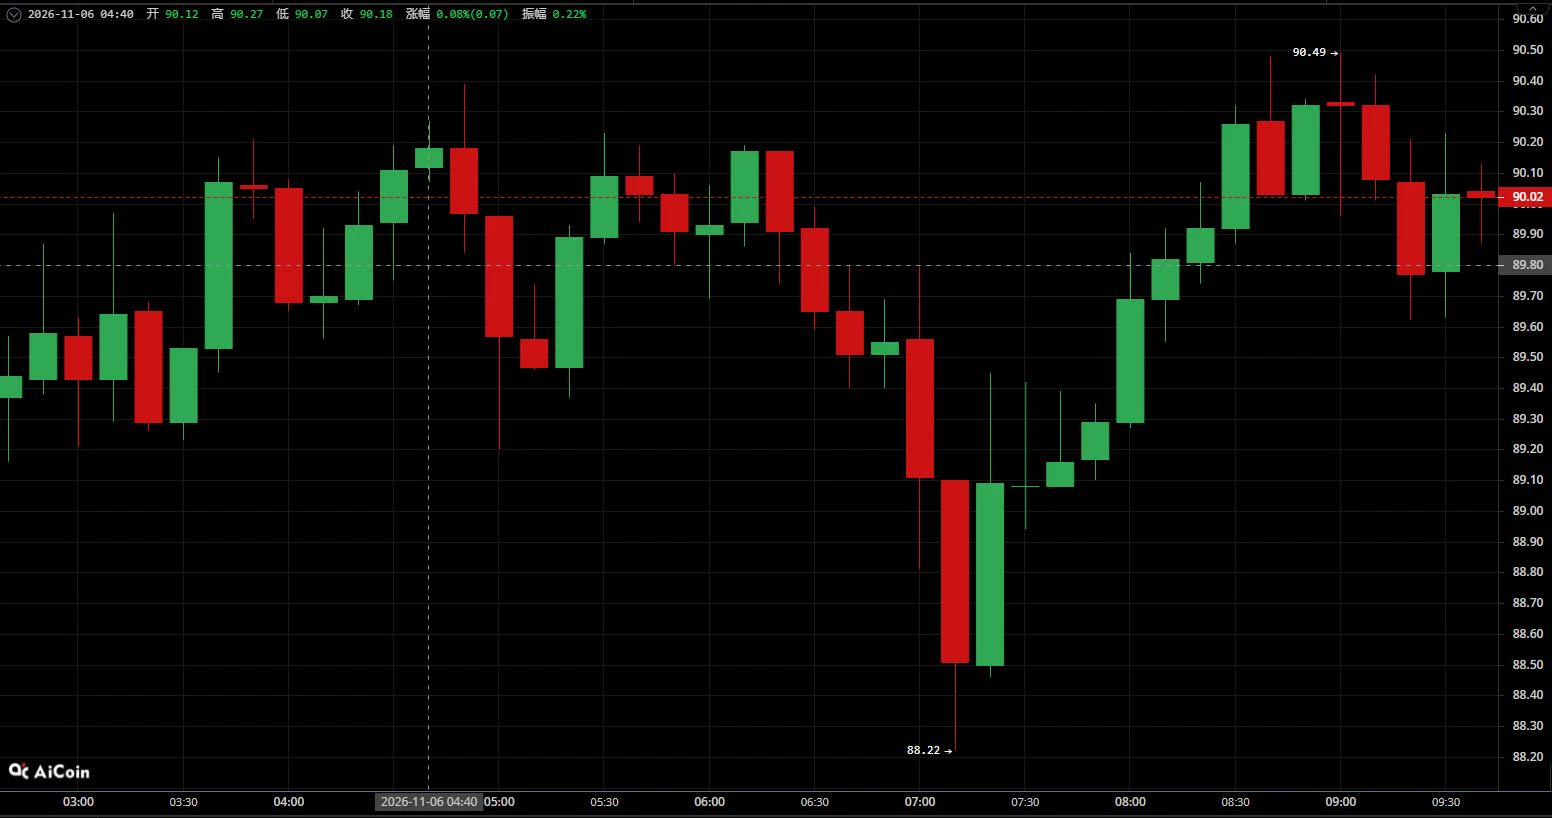
After dipping to 88.22 overnight, the market entered an oversold recovery phase. The broader bearish trend remains unchanged, and rebounds are still under pressure with further downside potential. Prioritize shorting rallies, supplemented by short-term longs at support.
#美股史诗级抛售
- Support: 88.8-89.0, around 88.2
- Resistance: 90.3-90.5, 90.8-91.0
- Shorts: Enter in batches on a rebound to 90.3-90.5, stop-loss at 91.2, initial target 89.2, then 88.5 if support breaks
- Short-term longs: If price stabilizes after retesting 88.8-89.0, consider a small long position, stop-loss at 88.2, target 89.8-90.2
repost-content-media
SOL-0.77%
  • 2
📡 Signal card | repost mode
Just came across KOL “Jotham Mabi”’s new trade. As usual, sis is only the courier and makes no guarantees👇
Asset: $ETHFI Long entry: 0.6201 Target: 0.7992 Stop-loss: 0.5821 Time: not specified (the channel shows it was just posted)
Speaking of which, I reposted this person’s $BCH trade earlier today, and here they are again—really quick on the trigger😂
Whether to follow and how much to allocate is up to you. Sis is only here to relay it, not to carry the trade.
Shared as a personal record, not investment advice. #bitcoin
ETHFI+1.52%
BCH+0.95%
BTC-0.67%
Trenches
ZIG
Z
bade
b
ZIG
0x8c...1145
Market Cap
$.
Change
.
24h Vol
$.
Holders
.
BTC
B
bade
b
BTC
C5xp...pump
Market Cap
$.
Change
.
24h Vol
$.
Holders
.
STONK
S
bade
b
STONK
6GmA...UNgx
Market Cap
$.
Change
.
24h Vol
$.
Holders
.
DESSA
D
bade
b
DESSA
npz2...pump
Market Cap
$.
Change
.
24h Vol
$.
Holders
Diamond
D
bade
b
Diamond
5VCE...pump
Market Cap
$.
Change
.
24h Vol
$.
Holders
.
[New Streamer] Market Prediction
live-cover
LIVE1,679
What Is the Break-Even Win Rate? How High Does a Trading Strategy’s Win Rate Need to Be to Cover Trading Costs?

In cryptocurrency trading, many people know their win rate but not how high it needs to be to actually make money. If winning trades earn little while losing trades lose a lot, you may still end up losing money even if you make the right call more often. The break-even win rate can help traders understand the minimum performance their strategy needs to achieve.

First, what is the break-even win rate?

The break-even win rate is the minimum win rate required for long-term expected r
post-image
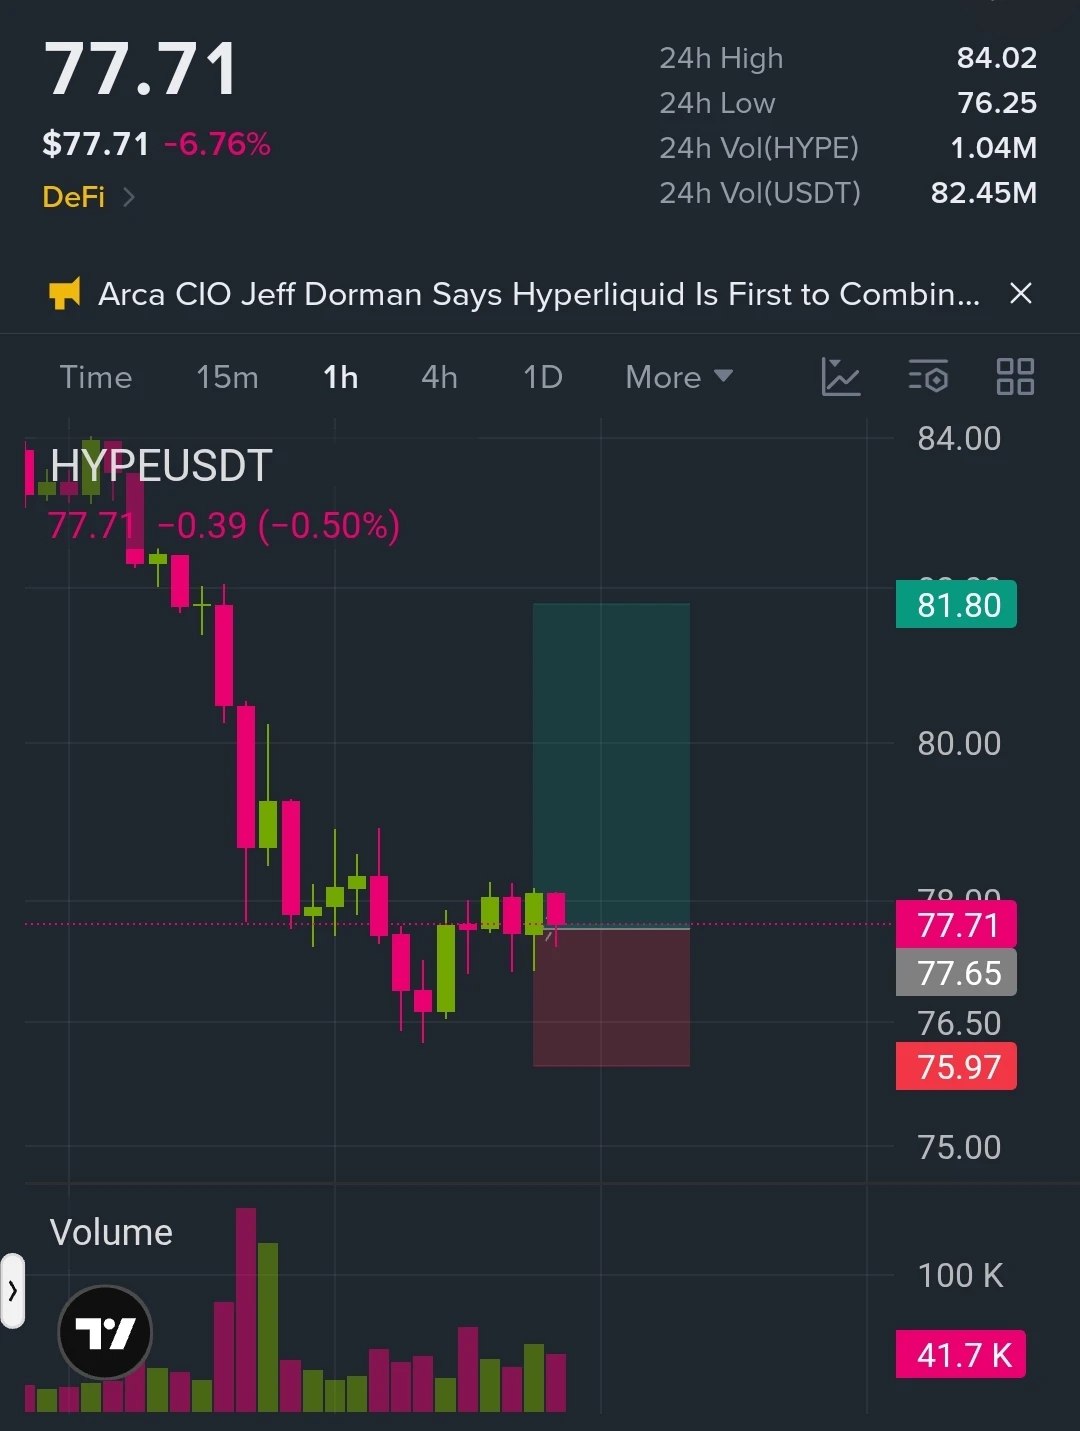
I'm watching a potential BIG LONG on $HYPE ‌
TP: $79.00 / $80.00 / $81.80

SL: $75.97

You know what caught my attention?

After a sharp decline from $84, HYPE found buyers around $76.50 and started stabilizing. Sellers pushed price lower, but the recent candles are showing signs of consolidation rather than uninterrupted selling $HYPE

The market may be building a short-term base. If buyers reclaim $78.50–$79.00, trapped short positions could provide additional fuel for a recovery toward $80 and $81.80.

The important level is $76.50.

If buyers defend this support, the next liquidity targe
post-image
HYPE+0.24%
gm web4
woke up tired af, the market is shit and they didn’t even have cappuccino… so my face is taking the day off 😝
post-image
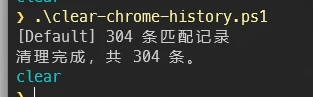
People who get sent flying by cars often know that having to get up and delete their browser history before passing out every time is a hassle.

So we could write a script. Since Chrome stores browsing history locally in plain-text SQLite, we can use SQL to find and delete it directly.

Then we can set the script up as a scheduled system task.

But if you’re signed in to a Google account, I don’t know whether this method will sync automatically.
post-image
#USTechSelloff AI Infrastructure Sold, Applications Next? What the 5 November Closes Say About Rotation

Thursday's close showed how sharply the AI trade came apart. Chips and data-center names took the heaviest losses, while the software and platform names held up better. The question now is whether that gap is the start of a rotation from AI infrastructure into AI applications, where the revenue is more immediate and the capex risk is lower.

What the closing prints show

From the Gate feed's 5 November closes: Alphabet closed at $282.57, down 2.20%. Microsoft closed at $535.93, down 3.58%.
post-image
MSFT-3.65%
AMZN-2.11%
PLTR-9.79%
ORCL-7.02%
GOOGL-2.22%
  • 5
  • 1
📉 U.S. tech stocks tumble across the board | Post to claim a red packet, with the weekly leaderboard winner taking home up to 100 USDT!
Gate Square’s “Weekly Share” special edition on trending topics is underway!

🎁 Event rewards
New users who post: 100% chance to claim a red packet
Weekly leaderboard rewards: win up to 100 USDT

📌 How to participate
1️⃣ Sign up for the event 👉 https://www.gate.com/campaigns/6244
2️⃣ Share your views with the hashtags #每周来晒 and #美股史诗级抛售

💬 This week’s topic
U.S. stocks faced a massive sell-off on Thursday, with the Nasdaq closing down more than 5% and A
GateSquare
📉 U.S. tech stocks tumble across the board | Post to claim a red packet, with the weekly leaderboard winner taking home up to 100 USDT!
Gate Square’s “Weekly Share” special edition on trending topics is underway!

🎁 Event rewards
New users who post: 100% chance to claim a red packet
Weekly leaderboard rewards: win up to 100 USDT

📌 How to participate
1️⃣ Sign up for the event 👉 https://www.gate.com/campaigns/6244
2️⃣ Share your views with the hashtags #每周来晒 and #美股史诗级抛售

💬 This week’s topic
U.S. stocks faced a massive sell-off on Thursday, with the Nasdaq closing down more than 5% and AI and chip stocks including NVDA and AMD tumbling across the board. Do you think this decline is short-term deleveraging, or is AI trading entering a deeper correction? Which do you favor next: chip stocks, tech giants, or other defensive sectors?

👉 Post now: https://www.gate.com/post/topic/USStocksFaceHistoricSelloff?topic_id=212400
repost-content-media
NDAQ-2.63%
NVDA-9.33%
AMD-17.64%
I've been shorting $WLD for quite a while — hope it drops to $1 soon, guys.
post-image
WLD-5.61%
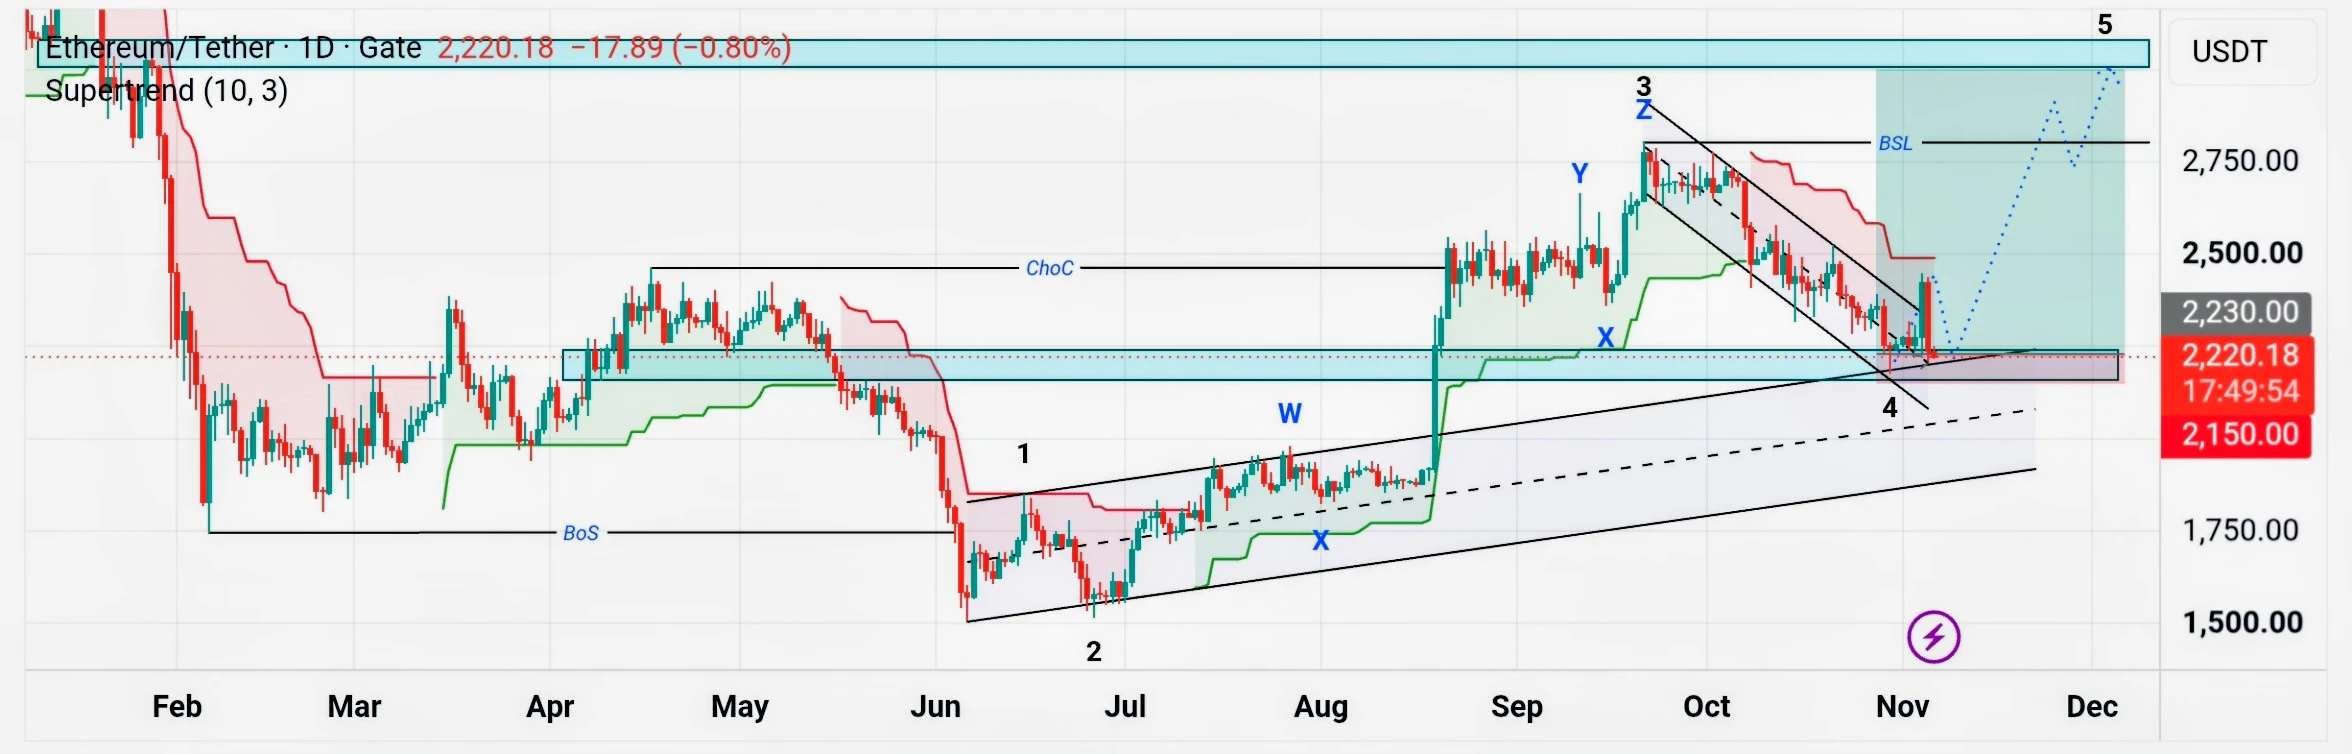
$ETH ‌-After the price broke out of the wave 4 channel shown in the chart, it immediately reversed back inside. Interpreting the price action this way, it could potentially be the formation of a micro wave 2, setting up for a bullish wave 5.
-Those with a bearish outlook might view this as a "false break."
-Therefore, using the most recent low (wave 4) as an invalidation level is a prudent risk management step for any long positions.
post-image
ETH-1.26%
A trade made $100—how much is left after all costs?

Long-form Chinese

In cryptocurrency trading, many people focus on one number first when reviewing a trade: how much did it make?

But a more important question is often overlooked:

Profit on paper is not the same as actual take-home gains.

Suppose you open a position, and when you close it, it shows a profit of $100. You might think it was a successful trade, but without calculating the full trading costs, you can’t accurately judge how much you actually made.

1. Fees: The easiest to calculate, and the easiest to underestimate

Suppose y
post-image
ETH is currently showing a multi-timeframe confluence of pressure and a downward structure:
On the daily timeframe, the previous rebound structure has come to an end. Price has pulled back under pressure, closing with a large bearish candle and breaking through the short-term support platform. Bullish rebound momentum has run out, and the trend has shifted into a corrective phase;
On the 4-hour timeframe, candlesticks have broken down consecutively, the Bollinger Bands are opening downward, bearish momentum is being released in force, and the market's center of gravity continues to move lower,
ETH-1.26%
  • 1
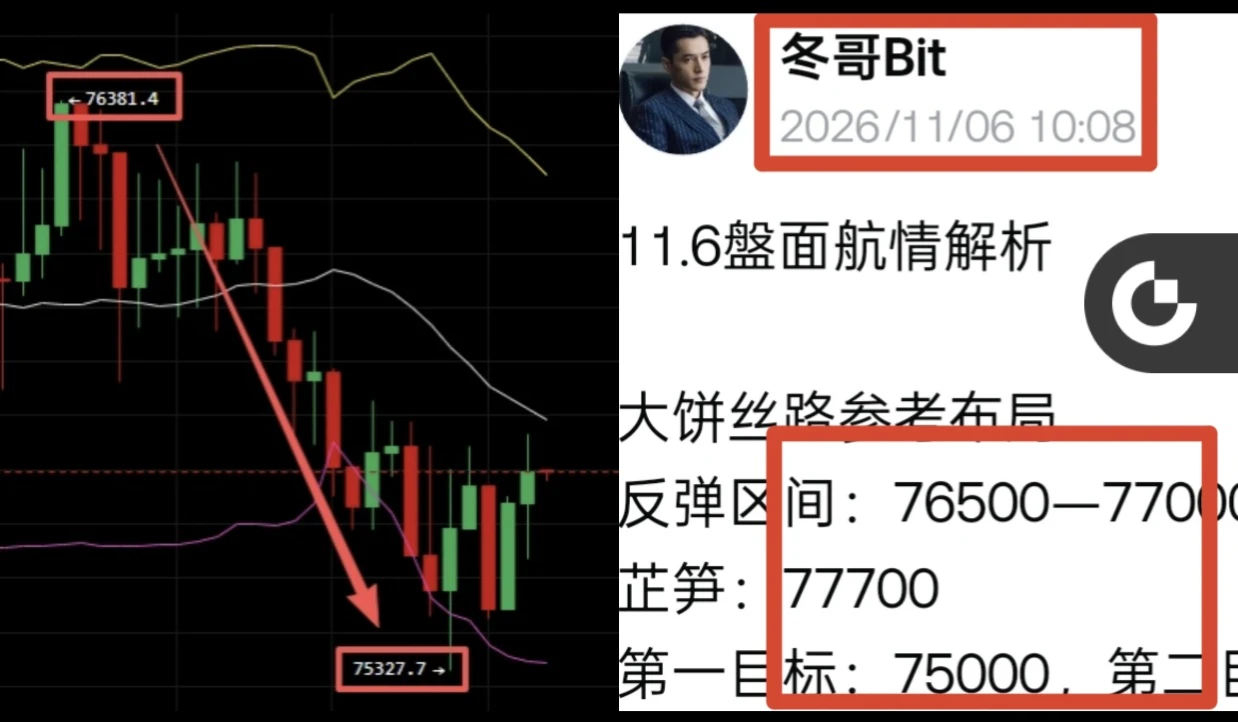
The Silk Road call from this morning paid off. This rebound reached the entry range we publicly shared and hit the first target, delivering 1,000 points of profit. Our assessment of the broader trend was right; by trading with the trend, we steadily locked in profits.

In trading, you need to distinguish priorities: direction is strategy, while price levels are tactics. Get the strategic big picture right, and entry details can be adjusted flexibly to follow the market. Many people get it exactly backward, stubbornly clinging to a fixed price and letting a clear trend opportunity slip away🤩#E
post-image
BTC-0.65%
ETH-1.23%
📡 Signal Card | Reposted from KOL “Bitcoin Fengge”
Asset: $ETH Long entry: 2435 Stop loss: 2360 Targets: 2520 / 2560 Time: Not specified
I’m only reposting this as-is. Fengge is responsible for backing the signal’s authenticity. Whether to follow it and how much to put in are up to you, folks—don’t go all-in with your life savings 🫠
I reposted one of Fengge’s $ETH trades earlier today, and now here’s another. This is happening more often than I change my profile picture.
Shared as a personal record; not investment advice. #SpaceX partners with Qualcomm to build a 5G network in the US
ETH-1.26%
SPCX-9.15%
QCOM-9.69%
Bitcoin crashed—$ZEC but ZEC didn’t! On a night of macro carnage, who’s secretly shutting off the shorts’ escape route?

A market crash is a true test: weak hands fall with the market, while the major players hold firm.

My take: Macro factors are indeed driving the sell-off. BTC plunged to $75k overnight, wiping out $1.2 billion in long positions as risk appetite shrank across the board. But ZEC held firm today. The reason isn’t in the charts, but on the supply side: the NU7 upgrade just activated, cutting the block subsidy to one-third. 12k ZEC in the Sprout pool were locked up outright, fu
ZEC+1.29%
  • 4
MARKET UPDATE
live-cover
LIVE1,784
This passage still has a lot of feeling to it.
post-image
$SNDK
SanDisk SNDK
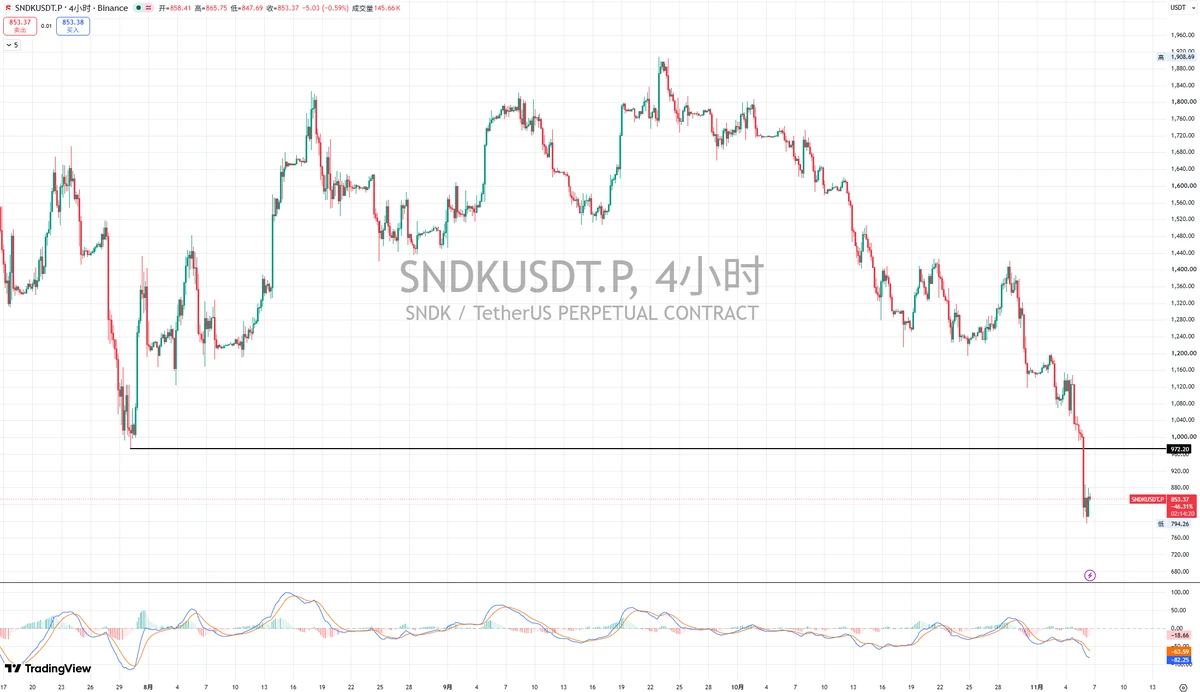
This sharp move lower has broken directly below the previous low. The difference this time is that the breakdown is valid, and there has been no recovery above that level, so this does not constitute a false breakdown.
The short-term level to watch is around 720. Watch how price reacts when it reaches that level!
post-image
SNDK-22.24%
Load More

Join 40 M users in our growing community

⚡️ Join 40 M users in the crypto craze discussion

💬 Engage with your favorite top creators

👍 See what interests you

Trending Topics

USStocksFaceHistoricSelloff

3.32k Views3.6k Discussing

U.S. stocks suffered a sharp selloff on Thursday, with the Nasdaq closing down more than 5% and the Philadelphia Semiconductor Index falling over 12%. AI and chip stocks including $NVDA and $AMD were hit especially hard. Markets are reassessing AI valuations, data-center spending and future returns. Is this just short-term deleveraging, or the start of a deeper correction in the AI trade? Which sectors are you watching next?

GateLaunchesPoSECProofOfSecurity

13.75k Views580 Discussing

USNonfarmPayrolls

11.98k Views4.03k Discussing

View More