Square
Following
Hot
News
Profile
Share your thoughts
placeholder
Article
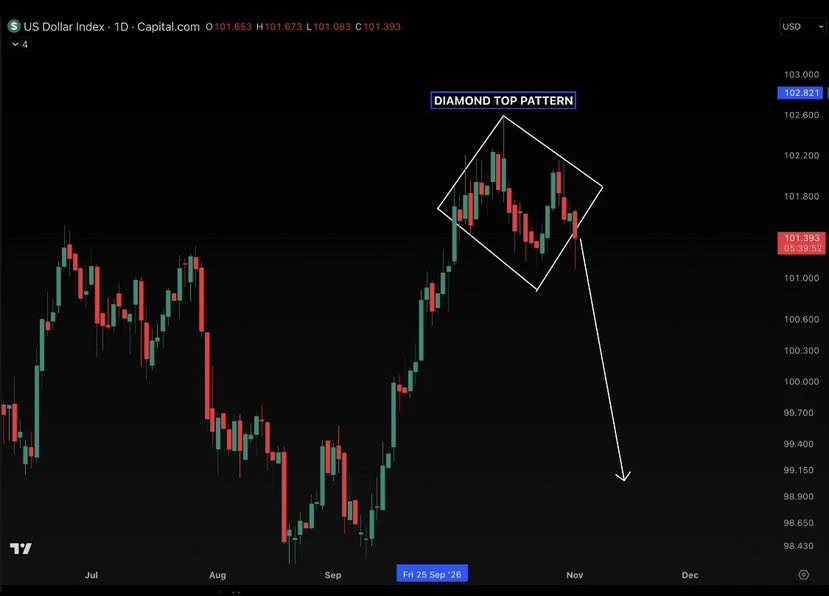
DXY is sitting at 101.39 after getting rejected near 102.60
that’s a 1.2% drop from the highs, and the daily chart is starting to form a diamond top
if 101 breaks, 99.20 becomes our downside target.
another 2.2% move lower from here
the dollar bulls might be getting a little too comfortable, time to smash them
post-image
On November 4, Trump is very likely to lose support in both chambers of Congress. This could put some pressure on the crypto market, since the entire process of legalizing cryptocurrency has been driven by Trump.
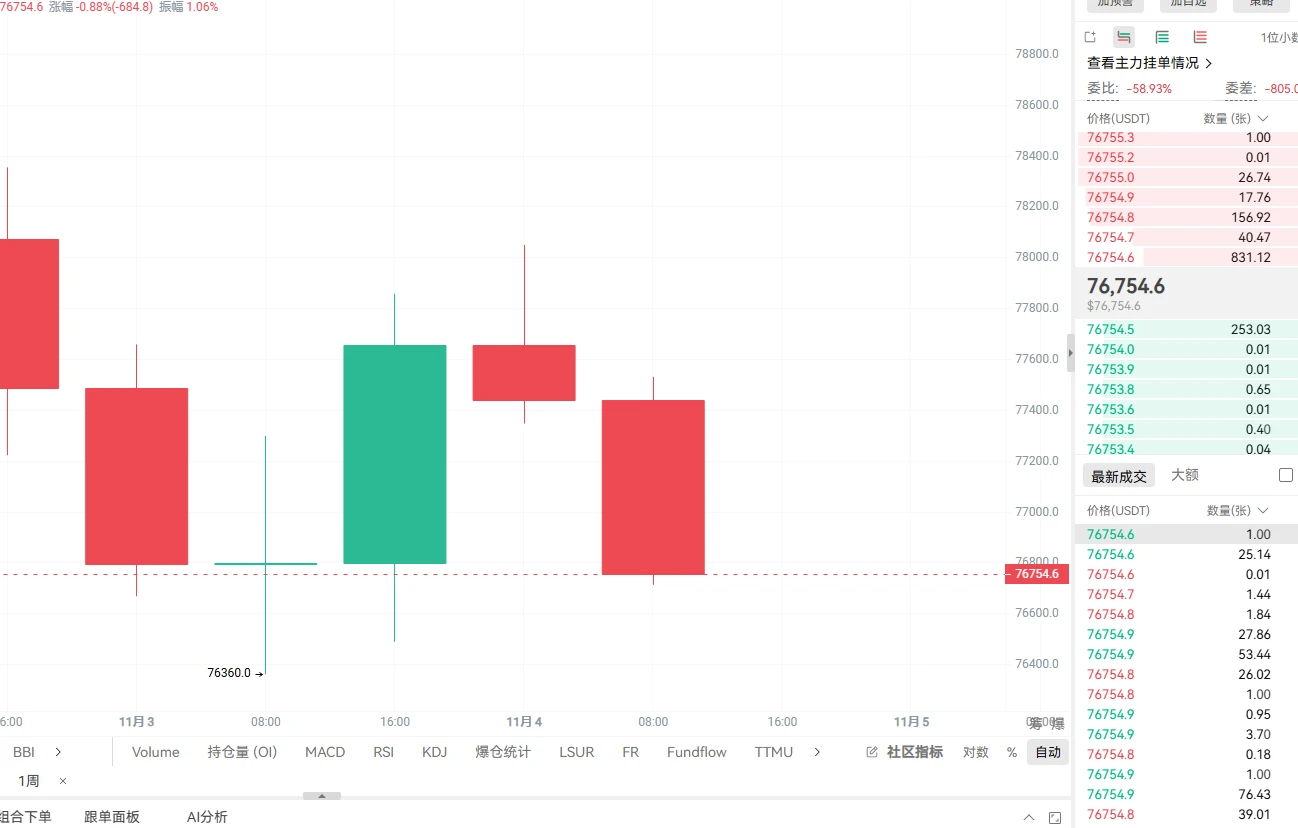
It could be considered somewhat bearish. Bitcoin is still repeatedly testing the daily support level around 76,000.
BTC-0.67%
  • 1
Trenches
ZIG
Z
bade
b
ZIG
0x8c...1145
Market Cap
$.
Change
.
24h Vol
$.
Holders
.
AMD
A
bade
b
AMD
DDmG...pump
Market Cap
$.
Change
.
24h Vol
$.
Holders
.
STONK
S
bade
b
STONK
6GmA...UNgx
Market Cap
$.
Change
.
24h Vol
$.
Holders
.
AGT
A
bade
b
AGT
0x5d...e274
Market Cap
$.
Change
.
24h Vol
$.
Holders
.
BTC
B
bade
b
BTC
C5xp...pump
Market Cap
$.
Change
.
24h Vol
$.
Holders
.
11.4 BTC analysis
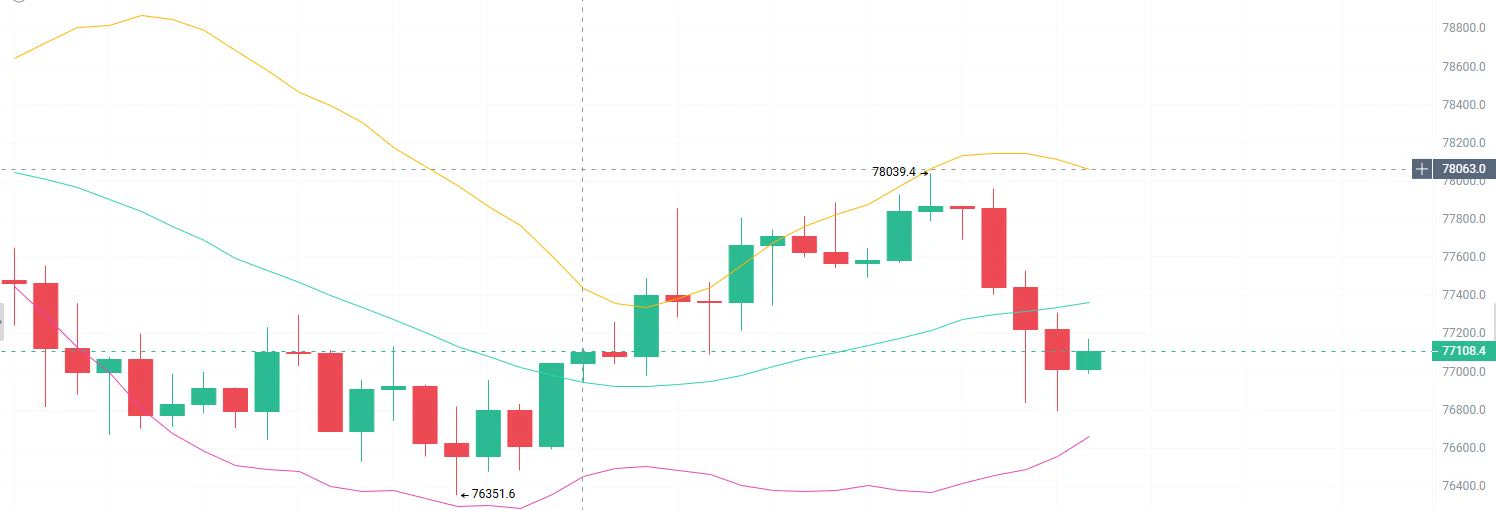
Analysis: Short near 77800-78200 on a rebound, with a stop-loss at 78700, first target at 76900, and second target at 76200
The 1H chart shows that after surging to 78039.4, the price came under pressure and pulled back. Resistance at the high held, and consecutive bearish candles disrupted the upward momentum. Short-term moving averages are beginning to turn down and weigh on the price. The current rebound is a corrective move following the decline. The high of 78040 has formed a strong resistance zone above. Until the price regains and holds this level, the rebound is more
post-image
BTC-0.67%
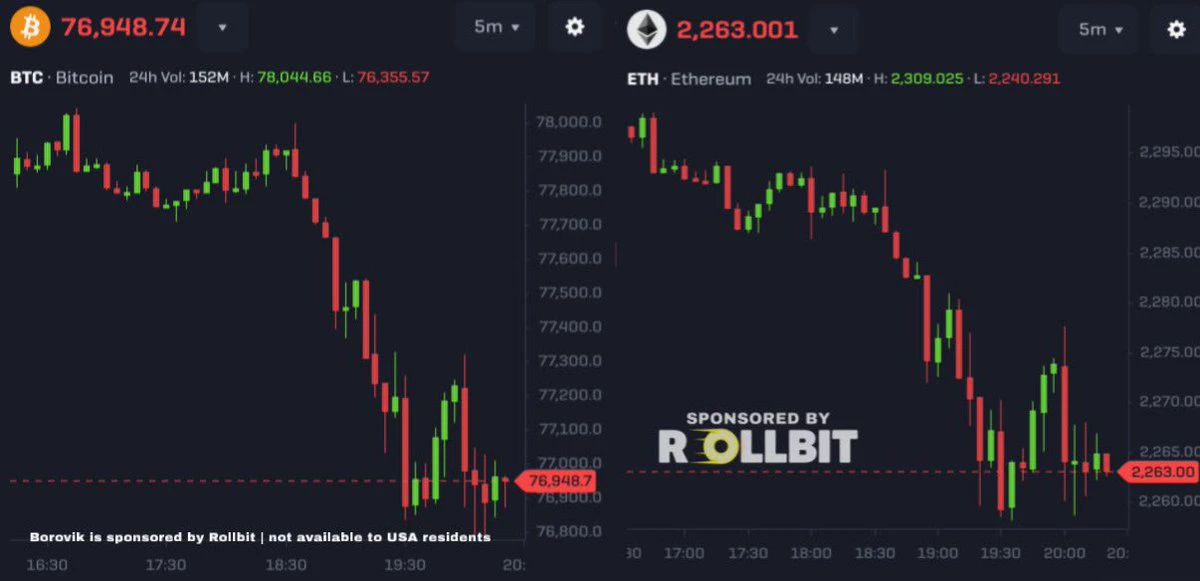
Crypto is getting crushed amid fears of a Democratic sweep in the US midterms
Bitcoin is down under $77,000
ETH is down under $2,300
post-image
BTC-0.67%
ETH-1.26%
Hurry up! Hurry up!
Come on, fingers, type faster!!! The shop’s going to be gone!!
post-image
#USEarningsSeason
#USEarningsSeason
The US earnings season is attracting major attention from investors, financial analysts, and market participants around the world. This is an important period when major American companies release their financial results and share updates about their business performance, revenue, profits, and future expectations.
During earnings season, investors carefully examine how companies are performing in the current economic environment. They want to understand whether businesses are growing, managing costs effectively, and preparing for future challenges. Strong e
BTC-0.67%
#ZECDropsAround6% #ShareWeekly ZEC Drops Around 6%: A Key Cooldown Amid Leverage Liquidations and Governance Disputes
Zcash (ZEC) has pulled back sharply after a strong run, trading near $1,150 with a roughly 6% decline over the past 24 hours. On the surface, this looks like routine profit-taking, but the derivatives liquidation data and a brewing community governance dispute make this pullback more noteworthy than the percentage alone suggests.
Long Leverage Takes the Brunt
The most striking data point from this correction comes from the futures market. A 24-hour snapshot shows roughly $11.85
ZEC+1.29%
HYPE+0.33%
11/4 Gold:
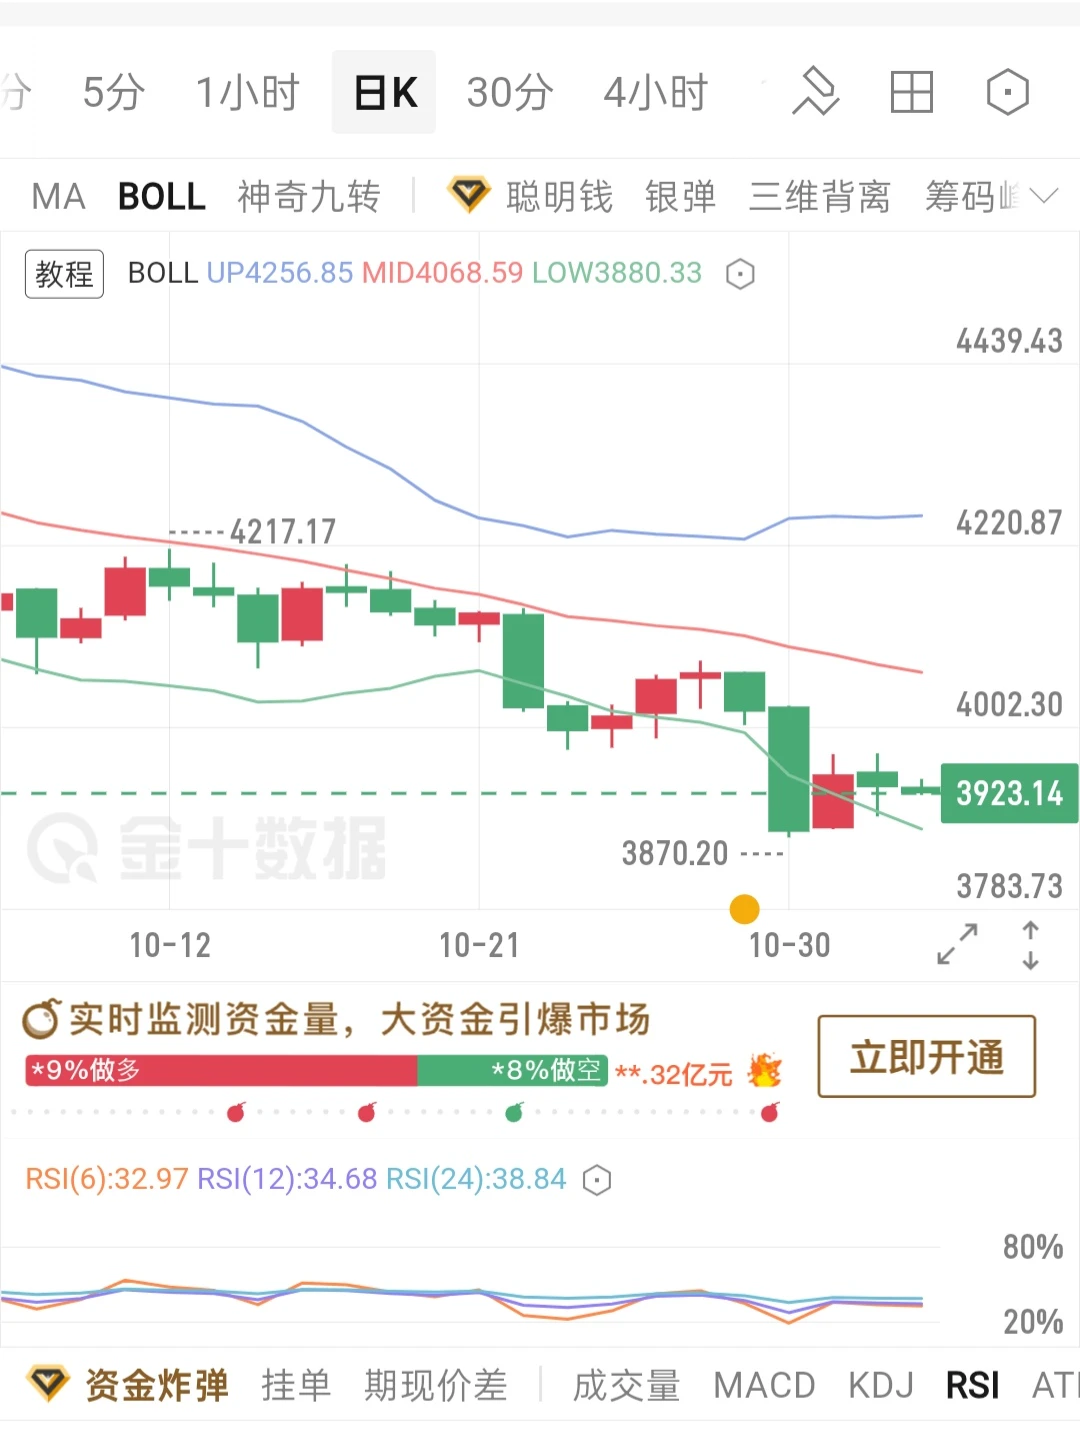
The daily Bollinger Bands are opening downward, with gold currently trading below the middle band. After a rapid drop to a low near 3870, price formed small candlesticks and moved sideways, temporarily stabilizing for a short-term pause.
RSI readings across all periods are below the 50 midpoint, and the broader bearish trend remains unchanged. RSI has edged up from low levels, and downward momentum has eased, but no bullish reversal signal has formed; this is only a technical recovery after being oversold.
Trading advice:
Short at 3940-3920, target 3850-3800, stop at 3950
(For refer
post-image
XAU+0.38%
Art comes from life; that final touch is the soul.
11-4 ETH&BTC
【Market】:Ranging
【Highs】:2280--2310--2330--2347
79200--78300--77600
【Lows】:2254--2227--2218--2200
76700--76200--75200--74800
Long stop-loss: 2215 2200 76270
Short stop-loss: 2350 2370 79330
Support: around 2240
Resistance: 2280 2295 around 2310
The market remains in a ranging trend. Wait patiently for a breakout below the 2255 support or above the 2310 resistance; only after a breakout will better opportunities emerge;
As for trading:
Aggressive short: around 2295 around 78300
Conservative short: around 2330
ETH-1.26%
BTC-0.67%
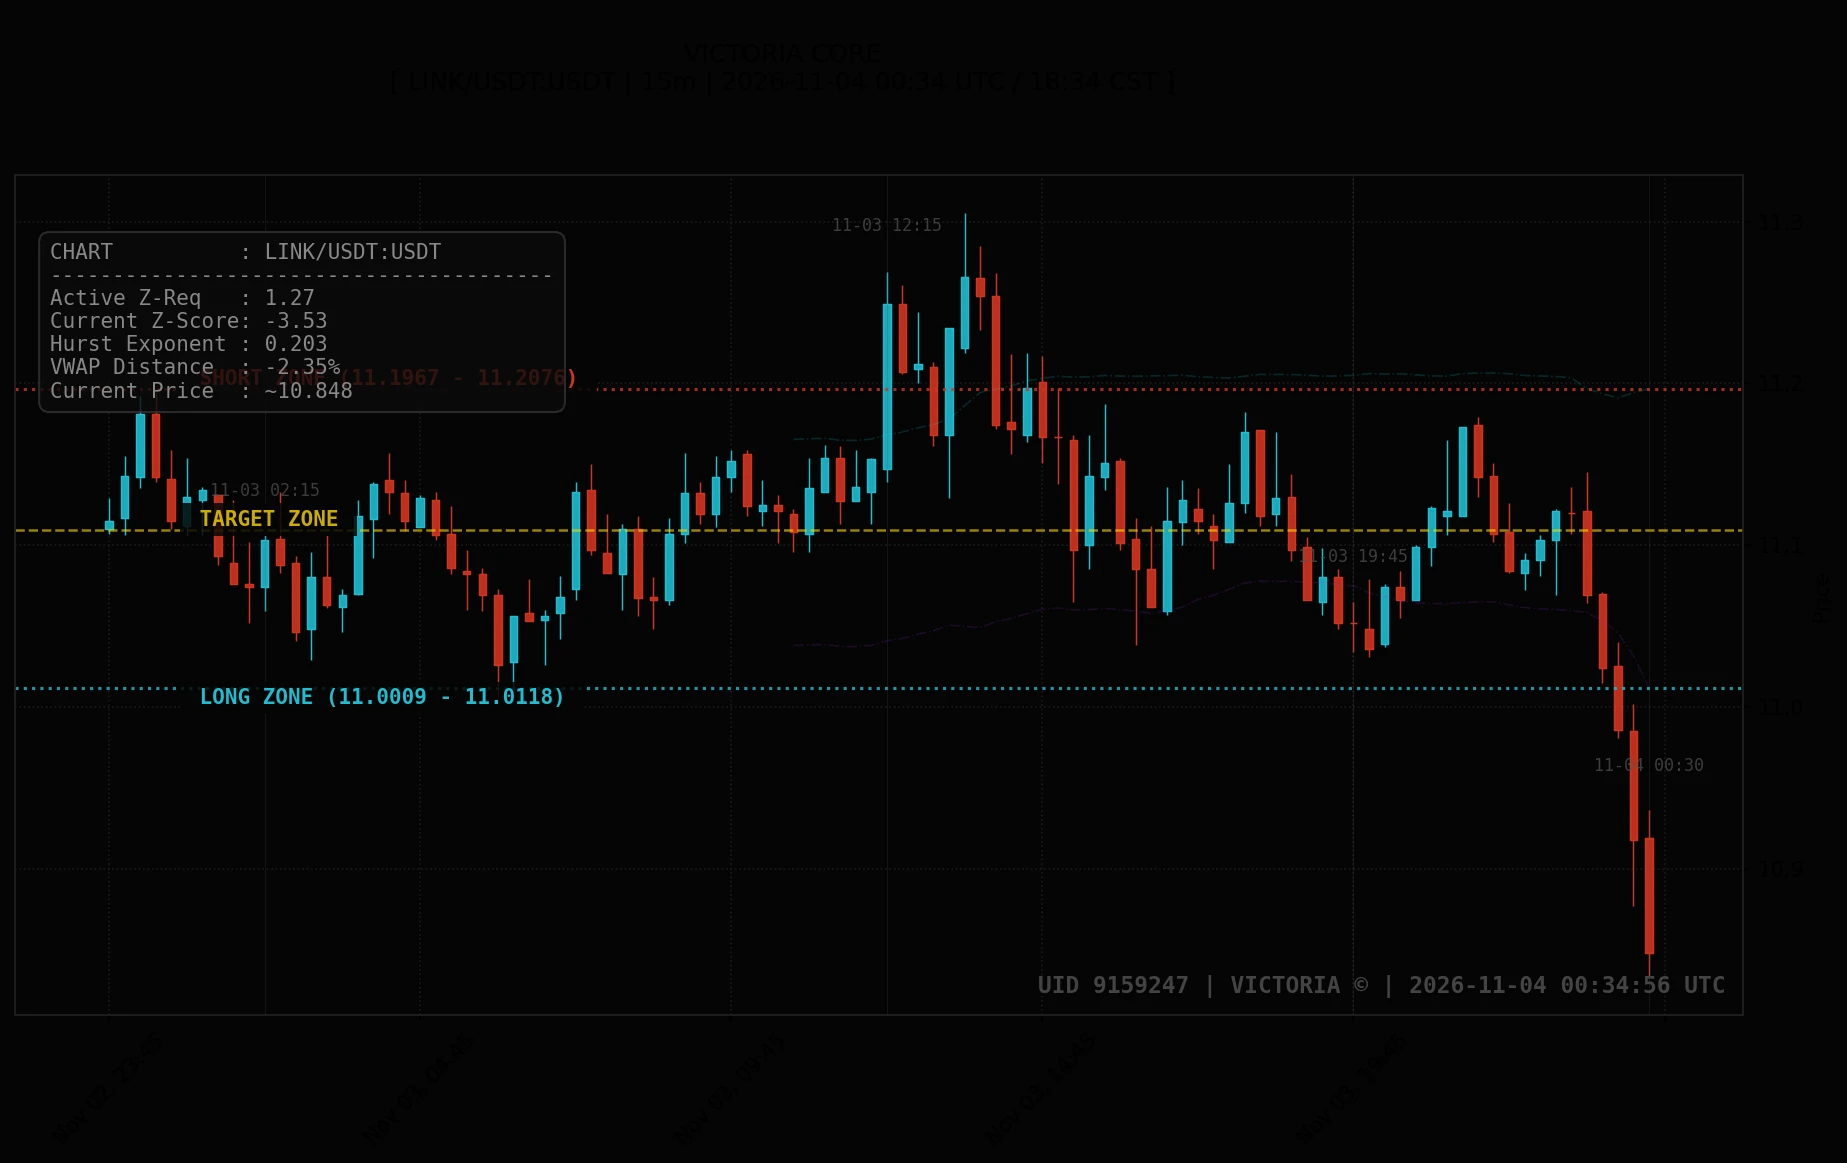
2026-11-04 00:35 UTC — LINK/USDT trades near ~10.848 USDT in an extended discount structure, testing demand after establishing a firm 4h low at 10.833. As price maneuvers below the LONG ZONE (11.0009 - 11.0118 USDT) seeking a push toward the TARGET ZONE (~11.1096 USDT) and capping at the SHORT ZONE (11.1967 - 11.2076 USDT), patience is advised to confirm support stability before entering.
We are also tracking ESPORTS/USDT (~0.01229 USDT | LONG ZONE: 0.0125415 - 0.0125833 USDT | TARGET ZONE: ~0.0128966 USDT | SHORT ZONE: 0.013294 - 0.0133358 USDT) and SOL/USDT (~91.66 USDT | LONG ZONE: 92.6973
post-image
ESPORTS-5.30%
SOL-0.77%
  • 2
Morning, guys.
First thing when I open my eyes, I check BTC: 76,900. It ran up to 78,000 overnight, then got pushed back down.
The U.S. finished voting yesterday, and results are coming in bit by bit. The market is still digesting them, swinging up and down without finding a direction.
Big Chao is still holding the long he opened at 77,800. The unrealized loss is small, and he hasn’t moved his 74,800 stop-loss. He slept easy.
Today, there’s just one thing to watch: once the election results are fully in, will money dare to come back? If BTC can hold steady at 78,000, this trade is still alive.
post-image
BTC-0.67%
The girl with glasses really got set up by a group this time.
Three “couples” were at the same event; hers is probably the only real married couple.
Did everyone see it?
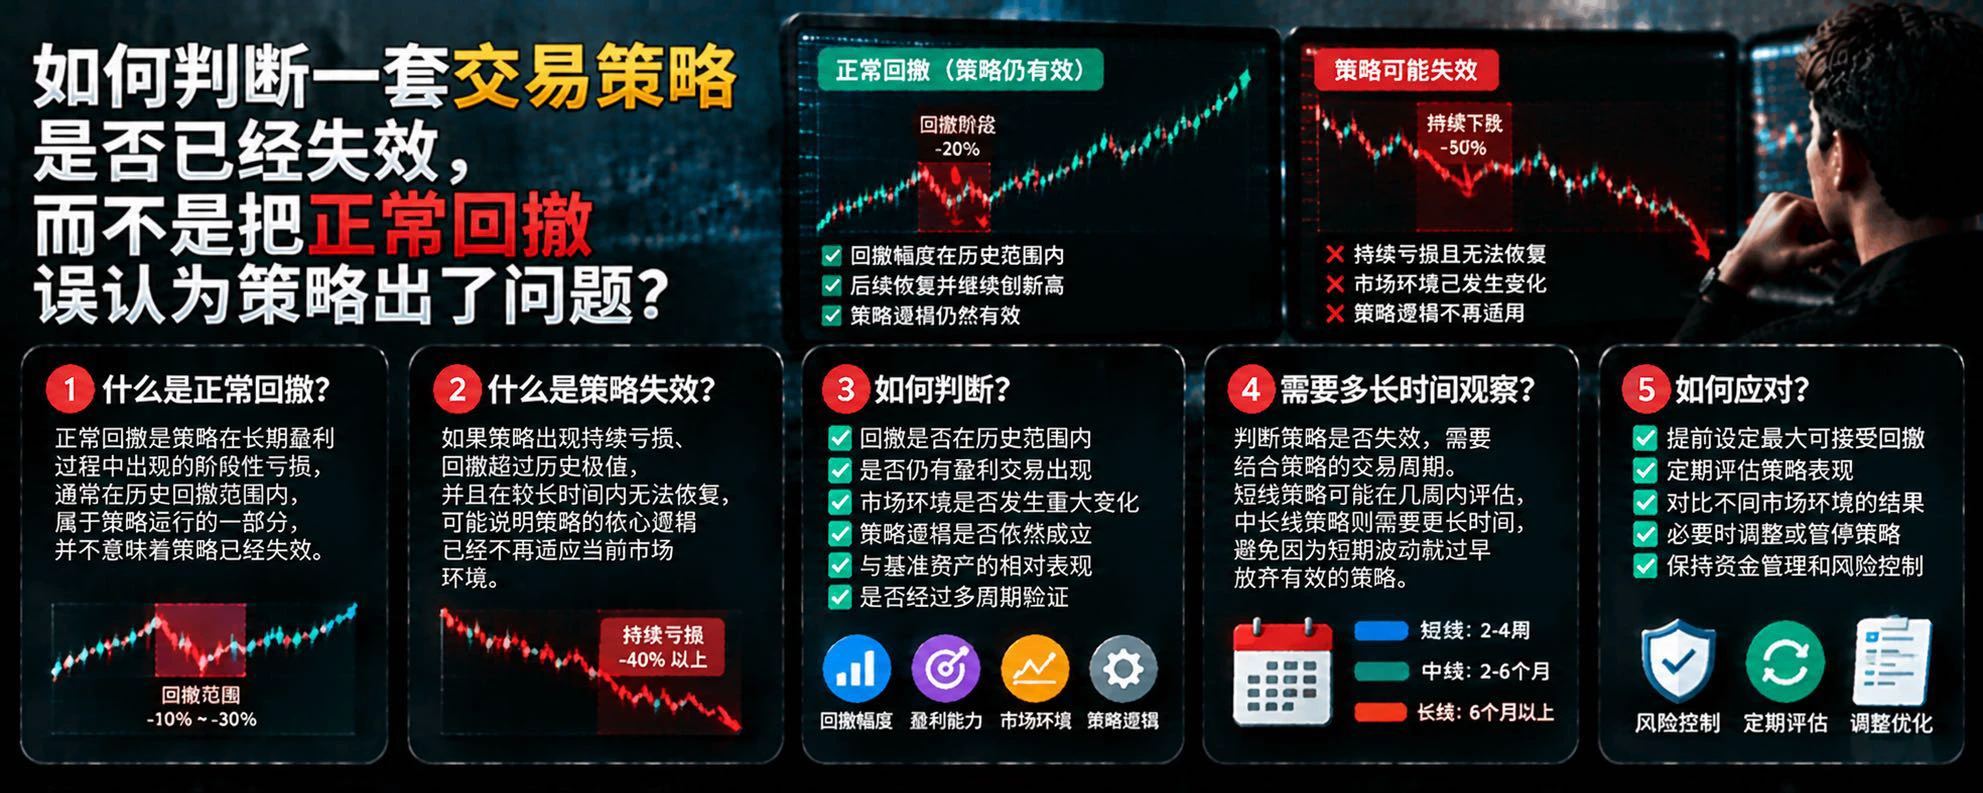
How can you tell whether a trading strategy has stopped working, rather than mistaking a normal drawdown for a problem with the strategy?
A trading strategy taking losses during operation does not necessarily mean it has stopped working. Any strategy involving uncertainty may experience drawdowns. What really matters is distinguishing normal fluctuations from signs that the strategy’s edge is disappearing.
First, check whether the drawdown exceeds its historical range. If the current drawdown is clearly beyond the levels commonly seen in historical tests, further investigation is warranted. Bu
post-image
Based on this set of return data, BTC in 2026 has followed a highly volatile pattern: declines in the first two quarters, a strong recovery in Q3, and another pullback in Q4.
As of the screenshot timestamp, BTC is down about 7.76% in Q4 2026 and about 11.93% for the year. The complete historical sample shows that BTC’s median Q4 return is about +27.94%; of 16 complete quarters, about 10 were positive, for a gain rate of about 63%. However, this only indicates that Q4 has historically been relatively strong. It does not mean BTC will necessarily rise this Q4. In particular, the current quarter
post-image
BTC-0.67%
ETH-1.26%
HYPE+0.24%
Nov 4 BTC/ETH Mi Shen Strategy
The midterm election results are about to come in. At this point, it looks highly likely that the Democrats will sweep both chambers, which is not good news for the Republican Party that Trump belongs to. However, the market had largely priced this in before the open. What matters most is how the market reacts. Incumbent presidents have typically lost seats in midterm elections, so this is not something to view as especially bearish. Instead, look for opportunities in the spirit of “be greedy when others are fearful.” If sentiment collapses again in the short ter
BTC-0.65%
XRP market update
live-cover
LIVE2,447
Fill up the tank, go collect the few hundred I’m owed last night, and today I don’t even know whether to bet on ETH going up or down?
post-image
ETH-1.26%
Crypto market update
live-cover
LIVE1,993
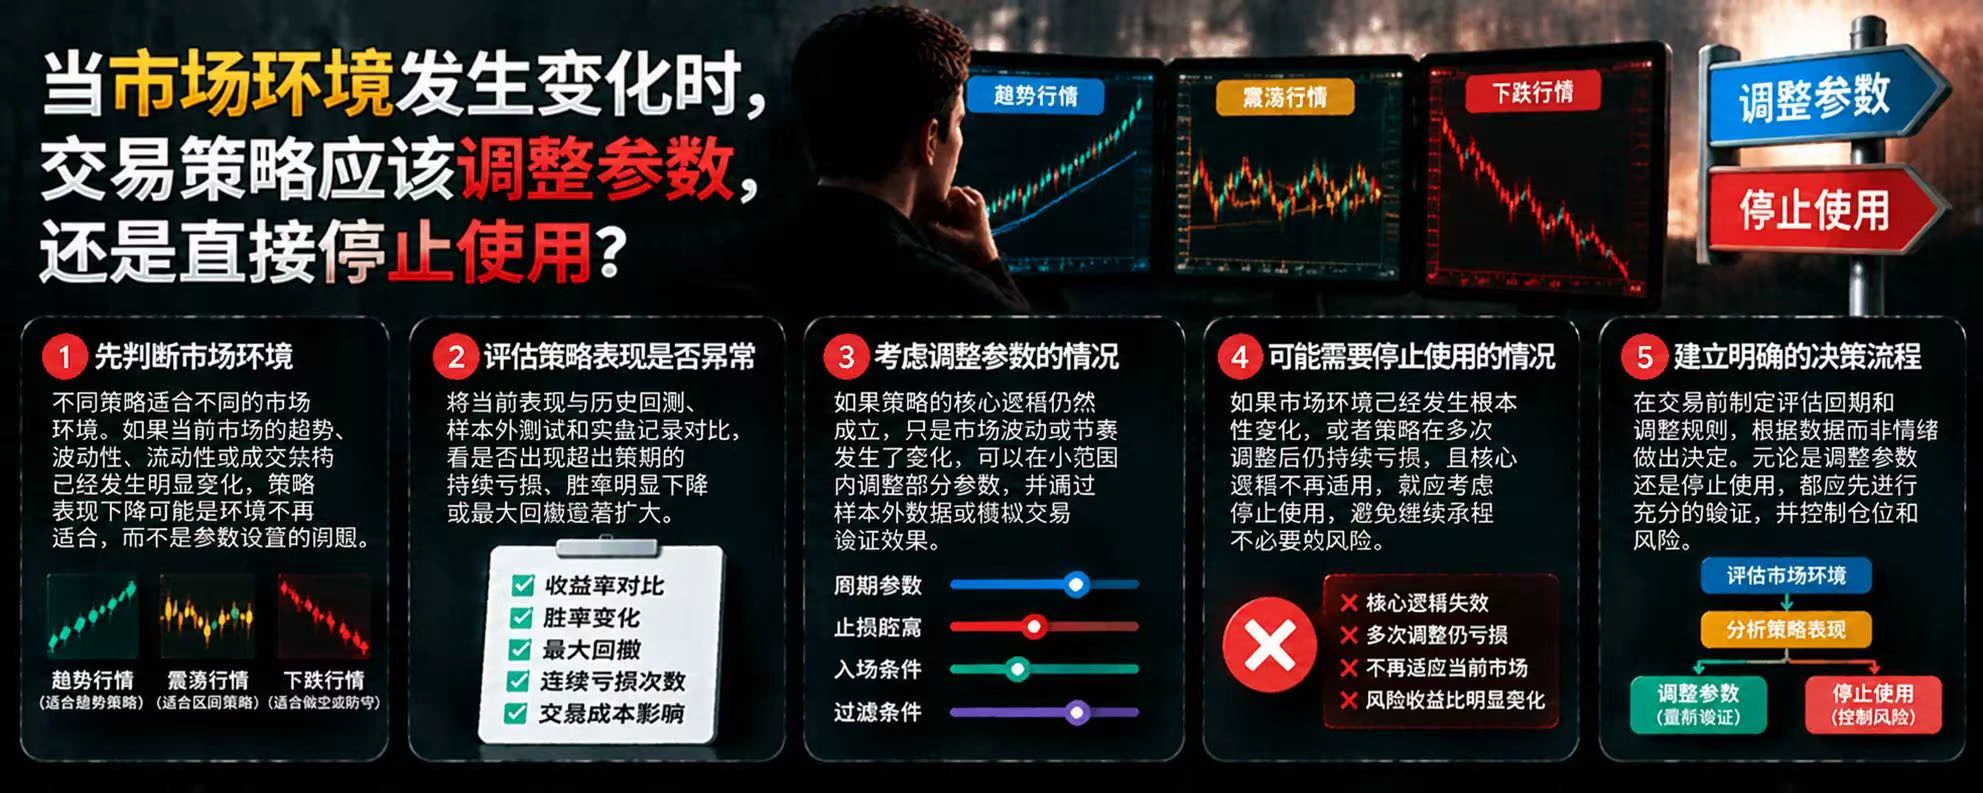
When market conditions change, should trading strategies adjust their parameters or be stopped altogether?
A trading strategy’s strong past performance does not mean it will always be suitable. When the market shifts from trending to range-bound, or liquidity and volatility change significantly, the strategy’s performance may decline. At this point, the key is not to rush into changing parameters, but to first identify the root cause of the problem.
First, determine whether the market has really changed. Observe indicators such as volatility, trading volume, trend strength, and liquidity to co
post-image
Load More

Join 40 M users in our growing community

⚡️ Join 40 M users in the crypto craze discussion

💬 Engage with your favorite top creators

👍 See what interests you

Trending Topics

GateRanksTop2AcrossMultipleCategories

22.13k Views3.1k Discussing

Recent third-party data shows Gate ranking among the global leaders across capital inflows, spot trading, derivatives, stock products and prediction markets. Gate ranked Top 2 in 30-day net inflows, spot market strength and prediction markets, while stock derivatives ranked Top 3. As exchanges expand beyond crypto into stocks, derivatives and prediction markets, what matters most when choosing a platform — liquidity, asset security, product coverage or capital efficiency?

BTCBreaksPastMidtermBearishPattern

2658.85k Views41.98k Discussing

ChipStocksRebound

199 Views2.86k Discussing

View More