Square
Following
Hot
News
Notifications
Profile
Share your thoughts
placeholder
Article
I truly didn’t see this move from the U.S. coming. From the White House podium, they held up India’s 7% GDP growth as a global benchmark and even praised its steady monetary policy. The world’s largest economy looking to New Delhi for lessons says enough on its own.

What’s the consensus? People think U.S. economic data still looks decent: employment hasn’t collapsed, and inflation is gradually easing. So dollar assets remain the best bet. That logic sounds flawless.

But I’m not so sure. Think about it: when an economy this large publicly admits it wants to learn from others about how to grow
post-image
  • 2
#PCEAndGDPDataNextWeek #ShareWeekly

Financial markets are approaching another important macroeconomic event as the United States prepares to release a fresh batch of inflation and economic growth figures on November 25. This time, investors will receive several important indicators together, including October's Personal Consumption Expenditures (PCE) Price Index, the revised third-quarter GDP estimate, personal spending, and durable goods orders.

In my view, this combination deserves particular attention because inflation and economic growth can tell two very different stories about the US
  • 1
Trenches
PIEVERSE
P
bade
b
PIEVERSE
0x0e...25a9
Market Cap
$.
Change
.
24h Vol
$.
Holders
.
IDOL
I
bade
b
IDOL
0x3b...ab07
Market Cap
$.
Change
.
24h Vol
$.
Holders
.
JAGENT
J
bade
b
JAGENT
0x8e...ae15
Market Cap
$.
Change
.
24h Vol
$.
Holders
.
Singularity
S
bade
b
Singularity
7R4M...pump
Market Cap
$.
Change
.
24h Vol
$.
Holders
.
mihao
m
bade
b
mihao
4Cxj...pump
Market Cap
$.
Change
.
24h Vol
$.
Holders
.
#CookBacksFurtherRateHikes The possibility of further interest rate hikes is bringing renewed attention to inflation, central bank policy, and the risks facing global financial markets. While investors naturally hope for rate cuts to support economic growth and liquidity, policymakers may be forced to maintain restrictive conditions or consider additional increases if inflation remains stubbornly above target.

Higher interest rates are not just a policy decision. They directly influence borrowing costs, consumer spending, corporate investment, bond yields, currency strength, and overall marke
post-image
SOXL-1.16%
BTC-0.67%
ETH-1.26%
XAU+0.38%
$BULLA Up 29%... Is 0.030 the next major target? After rebounding from 0.01110, BULLA is showing strong recovery momentum. Buyers have pushed the price to 0.01920, marking a strong rebound from recent lows. The latest breakout is encouraging, but the overall trend is still recovering from a major sell-off. BULLA Long Strategy Entry: 0.01810 Target 1: 0.02000 Target 2: 0.02200 Target 3: 0.02500 Final target: 0.03000 Stop-loss: 0.01550 The 0.01920–0.02100 range is the next major resistance zone. A strong breakout above this range could push the price higher. As long as BULLA holds above 0.01550
post-image
BULLA+10.92%
I treated the client to a whole roast lamb for a late-night meal tonight.
If I can’t close the deal, I’ll be out a lot of money, huh?
Whatever, I’ll get him drunk first and figure out the rest later.
post-image
$ZEC First, let me explain where I flipped. In the previous version, I was short, with my stop-loss set at 965, because I thought the drop from 1,683 to 860 wasn’t over yet.

Later, 860 held, and 880 never came either. Instead, all three retests found support above 892. The bottom didn’t turn into a bearish continuation; it formed a double bottom. A structural read was wrong, plain and simple. I closed the short and flipped long when it reclaimed the 100-day moving average at 696.

The only valid reason to reverse a trade is that the structure has changed, not that you’re unhappy about losing.
ZEC+1.29%
BTC-0.65%
ETH-1.23%
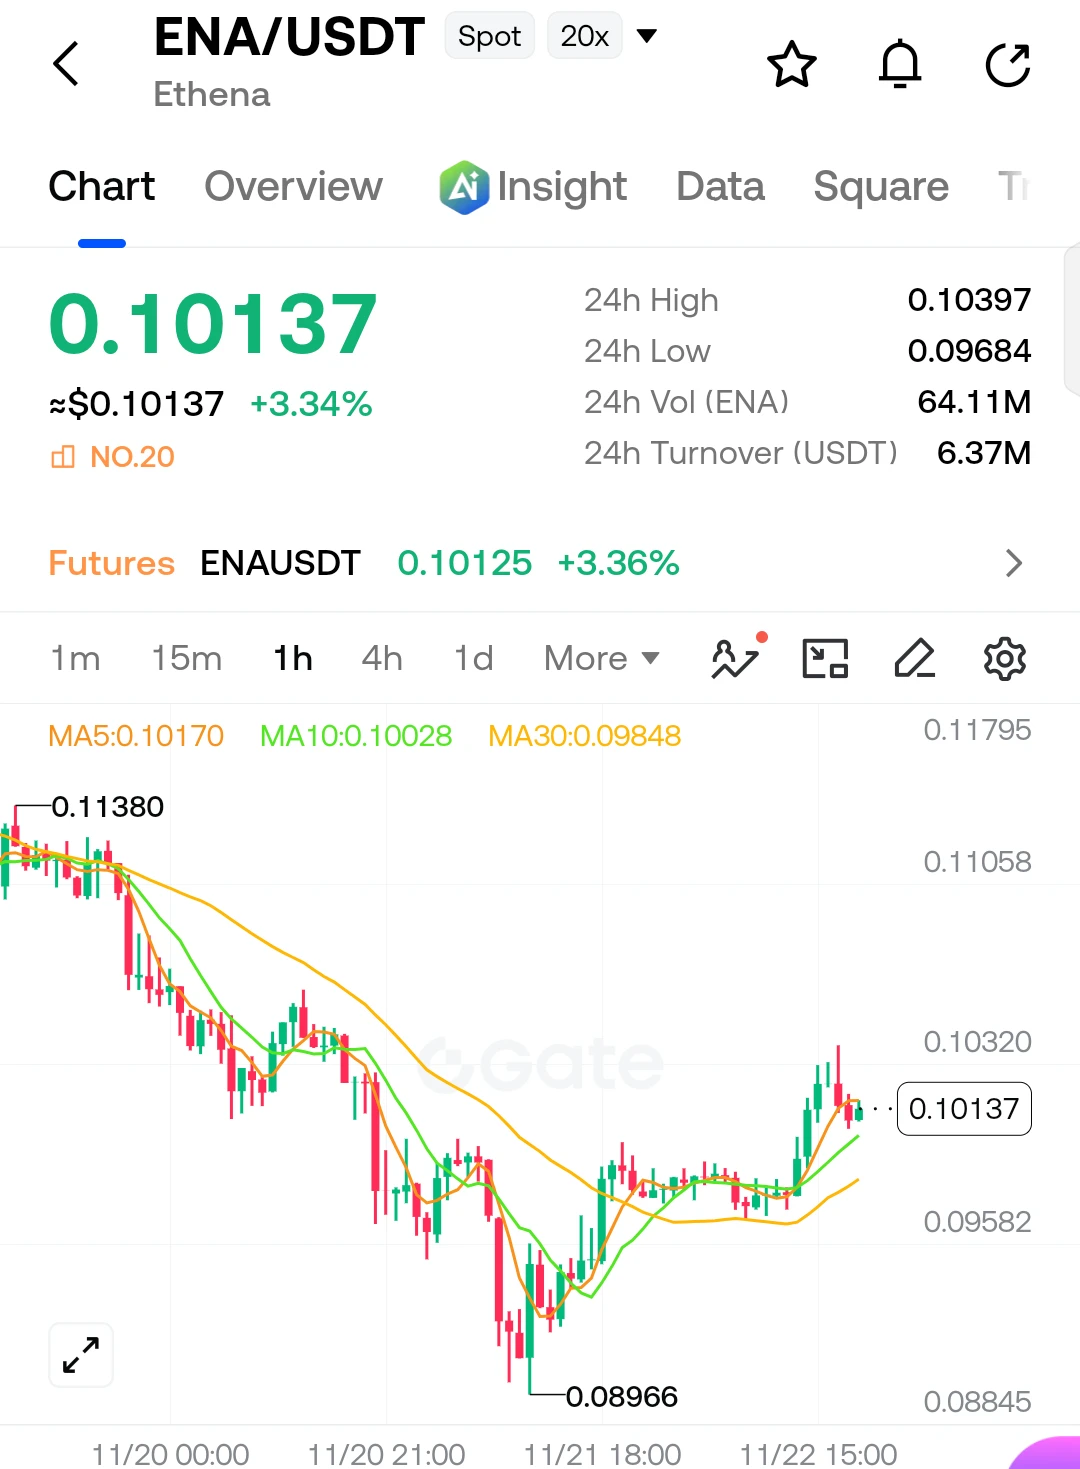
$ENA

Reclaiming ground after the brutal flush to 0.0896. Price is currently grinding up through the MAs, trying to establish a base. We need a clean break above the 0.1039 local high to confirm the next leg up; losing the 0.1002 support means we bleed back to the 0.0984 MA30 floor. Momentum is leaning bullish, but waiting for the breakout confirmation is key here.

Entry Zone: 0.1000 – 0.1015

TP1: 0.1039
TP2: 0.1100
TP3: 0.1138

Stop-Loss: 0.0980

#ENA #ShareWeekly #BTCReboundFaces60KTest #PCEAndGDPDataNextWeek #GateDirectIPOPhase3ANTAllocates92100Shares
post-image
ENA+8.04%
  • 2
  • 1
#GoldNears3500 #ShareWeekly
Gold stands at a pivotal psychological and technical juncture near the $3,500 per ounce level as of late November 2026, with the spot price hovering in the $3,530 to $3,540 range after a sharp multi-week decline. This area has become the focal point of intense market discussion, as the metal has already shed roughly 8.9 percent over the past week and approximately 12 percent over the past month, while sitting nearly 19 percent lower year-to-date and more than 34 percent below its all-time closing high near $5,405 recorded in late January 2026. The question dominati
#美国11月初请失业金人数高于预期
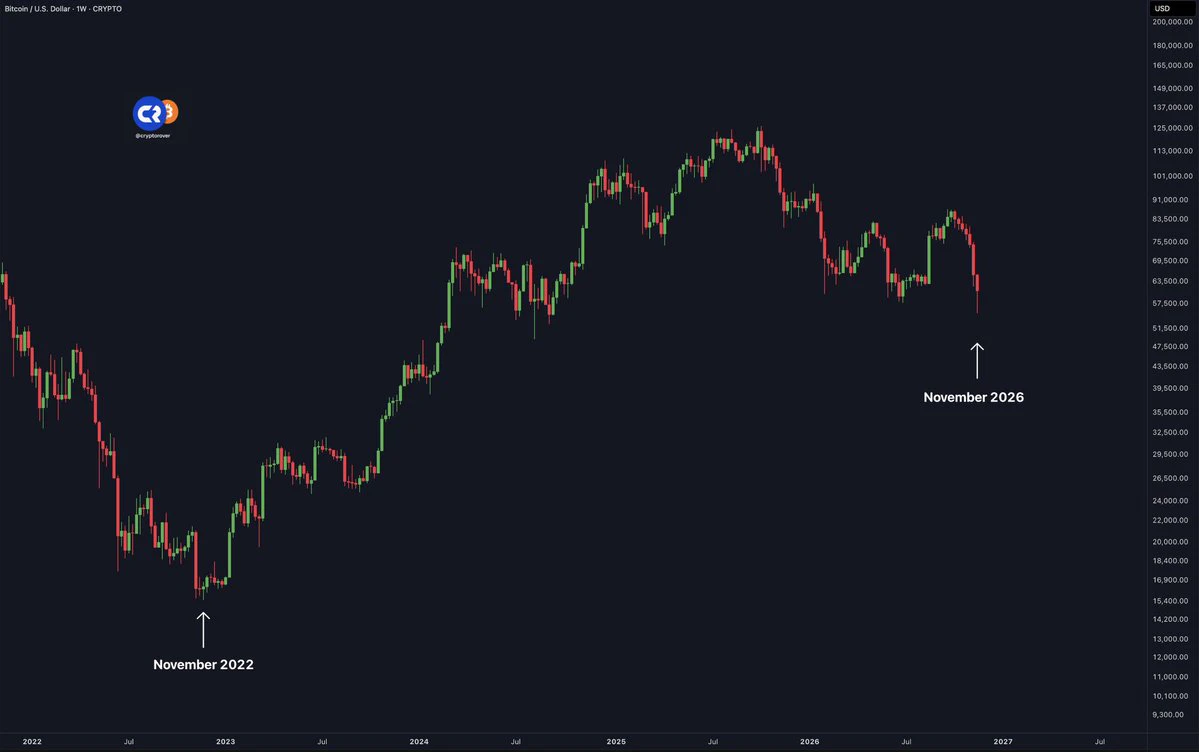
At first glance, a softer U.S. employment reading should give beaten-down risk assets room to breathe. Yet when the U.S. Department of Labor reported that initial jobless claims rose to 203,000 for the week ending November 14 coming in above Wall Street’s 197,000–198,000 consensus forecast the Nasdaq Composite still dropped roughly 2.25%–2.3% that session (before plunging another 5.28% on Friday, November 20), while Bitcoin broke decisively below $60,000 to test the $55,123–$58,914 zone into November 22, 2026.
Understanding why mildly cooler labor data failed to spark a reli
post-image
BTC-0.67%
NVDA-13.84%
$RLUSD The current price is 1.0014, but both the 1-hour and 4-hour timeframes look weak. The 1-hour RSI is 31.58, while the 4-hour RSI is 54.55. This contrast makes it difficult to determine the next move. The current price has already touched the 1-hour support level at 1.0014, but trading volume has not increased noticeably, indicating low participation from both bulls and bears. In this situation, price movements may lack staying power, and price changes alone are not enough to confirm a trend.
I’m short. I’ll wait for a rebound that fails to break above 1.0024 before entering, and I’ll adm
post-image
RLUSD+0.00%
The hard-and-fast rules distilled from seven years of trading
are all on the back of this sheet
post-image
  • 2
  • 3
Take a quick bite and get out; no entry points recommended for these wild coins.
Keep it up, everyone. Put your take-profit inside your stop-loss.
If you get stopped out, just accept it.
Because when you get hit, you have to stand at attention.
​#晒出我的持仓收益
post-image
PIEVERSE+0.50%
That was the bottom…
ENJOY THE RUN
🚀🚀
post-image
  • 1
#GateLeadsRWAPerpExpansion
#ShareWeekly
GateLeadsRWAPerpExpansion: Building the Future of Real-World Asset Trading
The rapid expansion of Real-World Assets (RWA) is becoming one of the most important developments in the cryptocurrency industry, and Gate is positioning itself at the forefront of this transformation. By expanding its RWA perpetual contract offerings, Gate is helping connect traditional financial markets with the opportunities of blockchain-based trading.
1. Bringing Traditional Assets Closer to Crypto
Real-World Assets represent financial and physical assets such as stocks, com
BTC-0.65%
ETH-1.23%
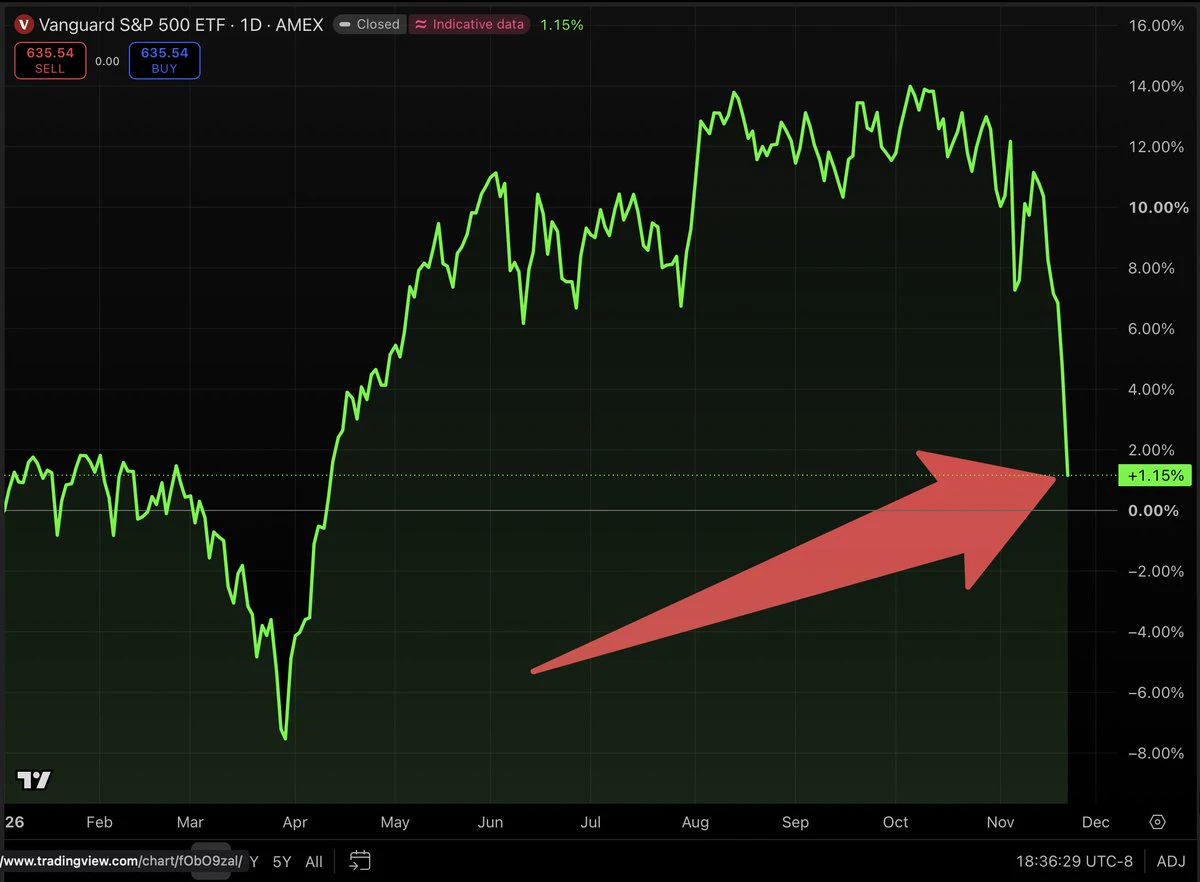
After the worst week in over 18 months, here’s where the S&P 500 is for the year
Up 1.15%
Yeah. It’s still green for 2026
Many think it feels like the world is ending because a week ago it was almost 9% higher. Everybody measures from the top
Now ask yourself a real question. Did the businesses get 9% worse in the last week?
S&P 500 earnings are up 32.9% from a year ago. That number went UP last week
The forward P/E is 17
The 10 year average is about 19
The 30 year average is about 17
So the price fell 9% while the earnings went up & valuations are close to the 30 year average.
Sentiment chang
post-image
$NEAR 3.042, up 4.5% over 24H. Price has been grinding against 1h resistance at 3.047 for a while. The 1h RSI is still overbought at 74, though volume is holding up at 1.38x. I’m betting it won’t break through that easily, so I’ll watch to see if it can close above resistance with a solid candle body. A pullback to 2.832 would count as a healthy retracement. Staying out for now and waiting for confirmation. Not investment advice.
#NEAR #NEAR
post-image
evening updates about btc with skyvera
live-cover
LIVE2,291
BTC-0.67%
ETH-1.26%
SOL-0.77%
#ThreeLaunchpoolProjectsNowLive

Three new Launchpool projects are now live, giving crypto users another opportunity to participate in the latest wave of token launches and ecosystem growth.

Launchpool has become an important part of the crypto market because it allows eligible users to potentially earn newly launched tokens through supported participation mechanisms. The arrival of three projects at the same time also puts greater attention on the opportunities available across the Launchpool ecosystem.

For traders and investors, the key things to watch are the individual project fundamenta
post-image
🔹 Ethereum(ETH) Surpasses 1,700 USDT with a Narrowed 1.69 Decrease in 24 Hours
live-cover
LIVE1,629
XAUUSD-2.40%
NVDA-0.35%
ETH-1.23%
BTC-0.65%
XAU+0.38%
Load More

Join 40 M users in our growing community

⚡️ Join 40 M users in the crypto craze discussion

💬 Engage with your favorite top creators

👍 See what interests you

Trending Topics

BTCReboundFaces60KTest

2.1M Views30.1K Discussing

BTC rebounded from around $55,300 on November 21, briefly reclaiming $60,000 before pulling back to around $59,300. The $60K level is back in focus as traders assess whether the recovery can last. Is this rebound a sign of stabilization or a short-lived recovery? Would reclaiming and holding $60K be enough, or do you need confirmation from trading volume and fund flows?

PCEAndGDPDataNextWeek

259.8K Views2.6K Discussing

GateDirectIPOPhase3ANTAllocates92100Shares

842.8K Views5.1K Discussing

View More