Square
Following
Hot
News
Notifications
Profile
Share your thoughts
placeholder
Article
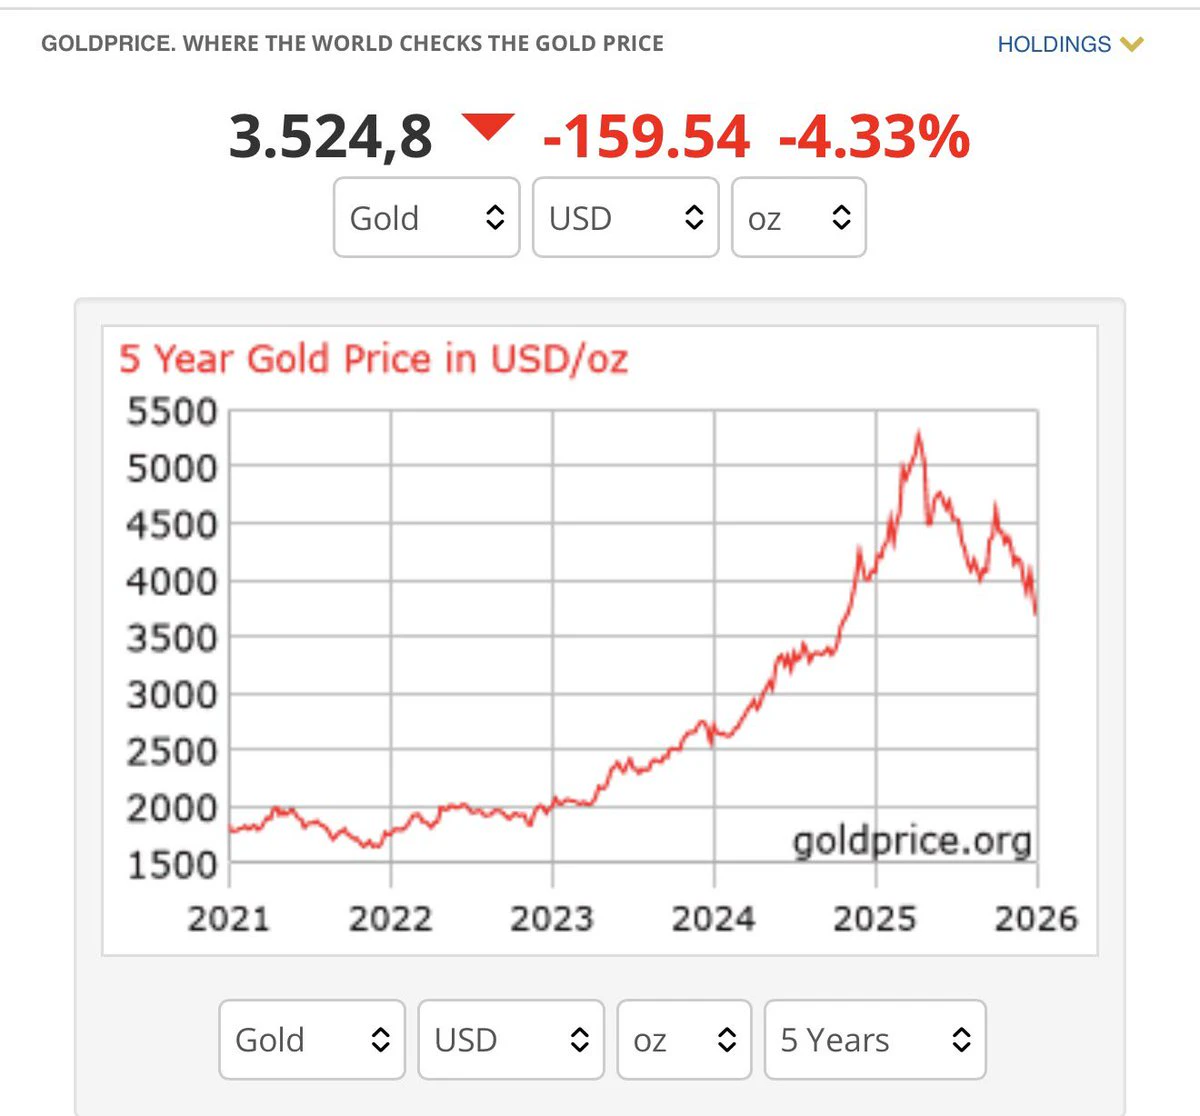
GOLD: 5-YEAR RALLY!!
Over the past 5 years, gold prices $XAU have risen nearly +100%. But after reaching an ATH of around $5,327/oz, gold prices are now undergoing a fairly deep correction.
Even over the past 6 months!!
gold prices have fallen around -18.87%.
So, if your mother or wife is planning to buy gold, what do you think:
At what price would you buy?
Would you wait for an even deeper correction or start buying gradually now? Or another option: buy digital gold $BTC , they say.
Drop your opinions below.👇
post-image
XAUUSD-2.40%
BTC-0.67%
All Eyes on US Data This Week!

Next week, the markets will be focused on US data, set to be released on Wednesday. These figures—covering economic growth and inflation—will provide fresh insights into the Federal Reserve’s interest rate policy.

What do the numbers suggest?
Expectations point to an economic growth rate of 3.6% (up from the previous 3.4%). Regarding inflation, the headline PCE (Personal Consumption Expenditures) is projected at 3.8%, while the core PCE is expected to come in at 3.2%.

Which way is the wind blowing in the markets?
According to current CME rate projections, the
BTC-0.67%
ETH-1.26%
SOL-0.77%
NVDA-13.84%
XAUT+0.30%
  • 2
  • 1
Trenches
IDOL
I
bade
b
IDOL
0x3b...ab07
Market Cap
$.
Change
.
24h Vol
$.
Holders
.
JAGENT
J
bade
b
JAGENT
0x8e...ae15
Market Cap
$.
Change
.
24h Vol
$.
Holders
.
PIEVERSE
P
bade
b
PIEVERSE
0x0e...25a9
Market Cap
$
Change
.
24h Vol
$.
Holders
.
FIONA
F
bade
b
FIONA
B34n...pump
Market Cap
$.
Change
.
24h Vol
$.
Holders
.
mihao
m
bade
b
mihao
4Cxj...pump
Market Cap
$.
Change
.
24h Vol
$.
Holders
.
On one side, the iPhone Duo; on the other, the iPhone 1 from nearly 20 years ago.
How much of this upgrade can you spot with the naked eye?
BTC pulled back on lower volume today, which is a chance to get in. BTC around 59000—both spot and futures can be used to go long. It probably won't keep falling below 55000 in the near term. The bottom has already formed; you can be a diehard bull for now. $BTC
post-image
BTC-0.67%
market update
live-cover
LIVE1,946
BTC-0.67%
SOL-0.77%
XRP-1.15%
USDC+0.01%
ETH-1.26%
BITCOIN MELTDOWN EXPLAINED: AI Stock Crash, Macro Storm & Gate.io Strategy!
live-cover
LIVE1,365
BTC-0.67%
$PARTI Bearish pressure is building... Is 0.033746 the next target? PARTI continued weakening after breaking below 0.036020. Sellers applied pressure with two consecutive strong red candles, pulling the price down from 0.036140 to 0.035400. Volume was about 1.9 times the recent average. As long as PARTI stays below 0.036020, the short-term bearish outlook remains valid. If the price climbs back above 0.036020, this view will be invalidated. Will there be another wave down? Sell and trade $PARTI
$ZEC $IDOL
post-image
PARTI-1.06%
ZEC+1.16%
IDOL-6.71%
#GateAnnualGala 🎉 Gate Annual Gala Is Here!

The Gate Annual Gala is bringing the community together for a special celebration of another exciting year in crypto! 🚀

🏆 From memorable moments and achievements to creators, streamers, and community members, the Gala is a chance to celebrate everyone who has been part of the journey.

✨ Stay tuned for exciting highlights, recognition, rewards, and unforgettable moments from the event.

💙 Let’s celebrate the progress, passion, and future of the crypto community together!

#Gate #GateAnnualGala #Crypto #Web3
post-image
Limited-time offer! Sign up now to get an exclusive new-user bonus of over 10,000 USDT and save on trading.
post-image
JCT | Short 🔴 | Bearish | 15-minute 24-hour: +0.45% | Volume: 33.8M USDT. Short rationale: Price below EMA200; EMA20/50/200 in bearish alignment; RSI14 at 41.1; MACD histogram negative; ADX14 at 16.8; volume is 0.46x the 20-candle average; trend pullback/continuation. Entry: 0.001575 Stop loss: 0.00162982 Take profit 1: 0.00150647 | Take profit 2: 0.00146535 | Take profit 3: 0.00141053 For reference only; do not chase the entry. The trade setup is invalidated if the stop-loss level is hit. Technical analysis only; not investment advice. $JCT
post-image
JCT-3.26%
Shorting those coins that have pumped through the roof yet again.
Bearish outlook.
$PIEVERSE Seriously, the whole market is plunging, and you're the only one stubbornly holding up and not dropping, huh? Clearly you're going against me. $PIEVERSE
PIEVERSEUSDT perpetual position direction: Short; unrealized loss: -12,796.58 USDT; PIEVERSE +20.26%
Risk warning: The above is only a personal trading record and does not constitute any investment advice. Contract trading carries extremely high risks; please participate with caution.
post-image
PIEVERSE+0.58%
Keep a close eye on the spot gainers list. These hot assets are worth watching, with the following target prices for the next phase:
$AIGENSYN target: 0.020 $NIGHT target: 0.050 $DODO target: 0.0450 ORCA target: 1.50 ETHFI target: 0.0550 COOKIE target: 0.01 DASH target: 47
My approach is simple: pick the spot coin you’re most bullish on, buy it, then avoid trading too frequently. Hold patiently until it reaches your take-profit target, and the gains will naturally materialize.
This does not constitute financial advice.
post-image
AIGENSYN+1.18%
NIGHT-3.10%
DODO+11.43%
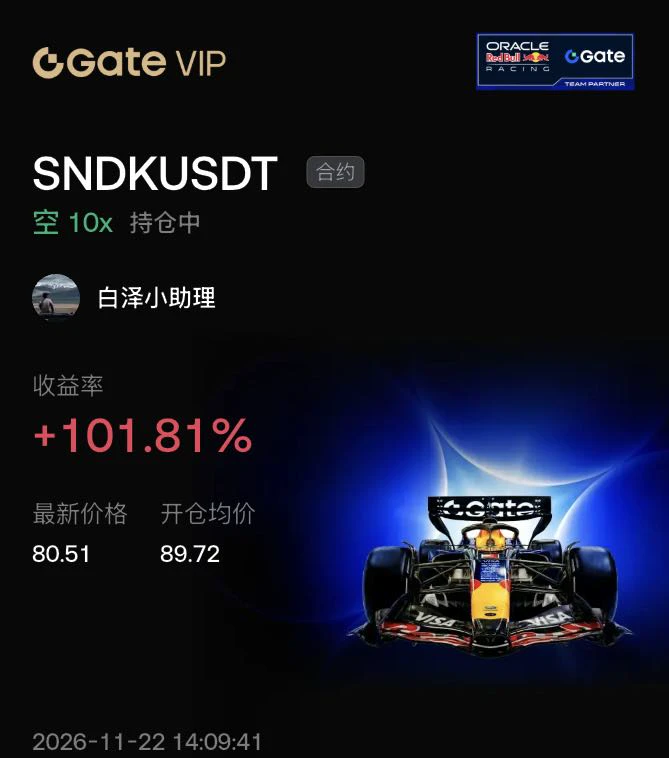
$SNDK After the close on 11/19, it had an 8-for-1 stock split. 11/20 was the first trading day after the split. The previous day's close of $755.16 was adjusted to $94.40 after the split.

It opened sharply lower at $89.98 that day, reached a high of $90.67 and a low of $78.25, and closed at $79.24, down 16.05%. Trading volume was 127 million shares, 1.5 times the average daily volume over the past three months. In after-hours trading, it recovered to around $81.40.

Your entry price was $89.72, right around the open, so you basically caught the whole move. This week, it fell from $110.63 to
post-image
SNDK-0.18%
AKE+6.39%
ARK-7.35%
  • 2
$STRK Short setup underway: sellers are finally about to act 👀
Plan to establish a short position in the 0.02984–0.02993 range $STRK , waiting for a clear rejection signal from price here. If the 0.0299 level above successfully holds as resistance, watch for downside targets of 0.0294, followed by 0.0290. Conversely, if price reclaims 0.0304, the entire short thesis is invalidated, and you should exit promptly.
🔴 Short setup entry range: 0.02984–0.02993 Take-profit targets: 0.02956 / 0.02935 / 0.02903 Stop-loss level: 0.03041
Technical confirmation: On the 4-hour timeframe, price at 0.0299
post-image
STRK-3.55%
The 10% cap on first-day sales is bringing the “windfall of a lifetime” that many media outlets calculated back down to the realities of the balance sheet.

On November 19, Anthropic officially rang the Nasdaq opening bell under the ticker symbol ANT, pricing its shares at $83 and raising $81.3 billion. Combined with a concurrent $26 billion private placement, the offering set a record as the largest IPO in U.S. history.

Domestic tech media then identified at least 25 Chinese technical and management employees still working at the company who had benefited from this leap in wealth. The headli
post-image
ANT-8.68%
When it comes to cuisine, few places can be as diverse as Hanoi
There is never any shortage of choices.
post-image
$EVAA Bought the dip, bought the dip—the rebound is pretty quick
EVAA-0.49%
  • 1
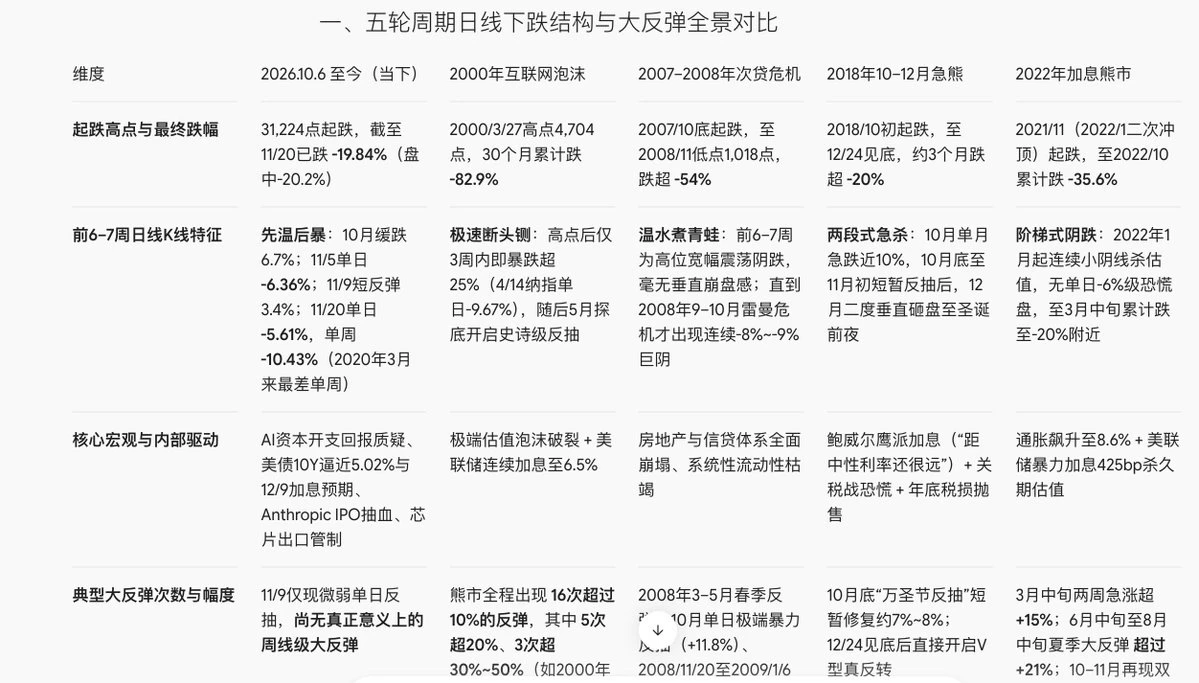
Comparison of the decline from NAS100’s October 2026 peak with declines beginning at the 2000, 2007, 2018, and 2022 peaks.
1) Speed of decline: The second-fastest of the five, numerically close to 2022.
2) Rally before the peak: On the same scale as 2007, 2018, and 2022, lacking the parabolic rise of 2000.
3) Candlestick pattern similarity: Most similar to 2018, but the differences among the four comparisons are small.
4) Subsequent moves: The decline in the first 33 days cannot determine the final depth; markets keep extending and evolving.
The current decline is close to the path of the Q4 2
post-image
NAS100-0.07%
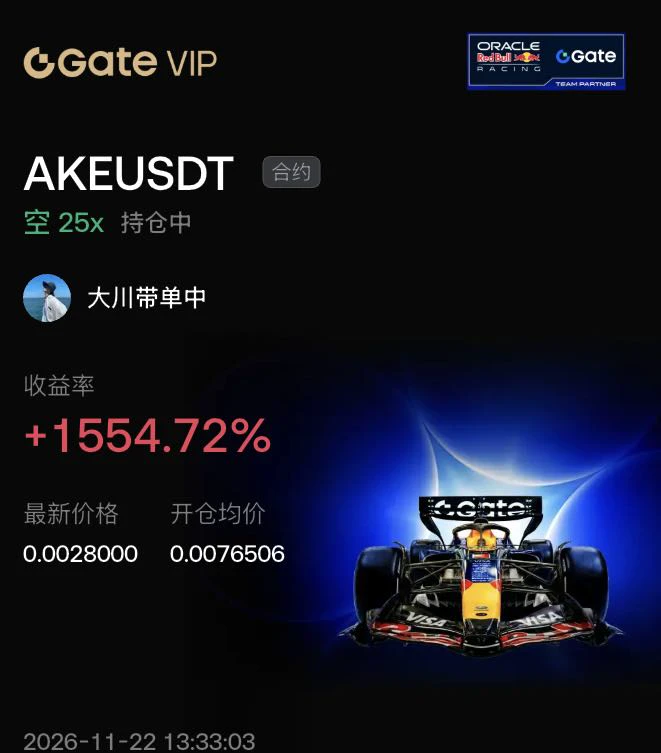
$AKE I opened a short at 0.0076506, and this wasn’t a random entry. AKE repeatedly tested above 0.007, but three attempts to push higher all failed to break the previous high, with volume weaker each time—the price moved, but volume didn’t follow, a classic price-volume divergence. On the moving-average system, MA5 had already crossed below MA10, MACD had formed a death cross below the zero line, and the histogram had turned from red to green and continued to expand. I entered on the candle where the second push ran out of steam and formed a long upper shadow.
$BTC
At the moment I entered, I
post-image
AKE+6.39%
BTC-0.65%
  • 2
  • 1
Load More

Join 40 M users in our growing community

⚡️ Join 40 M users in the crypto craze discussion

💬 Engage with your favorite top creators

👍 See what interests you

Trending Topics

BTCReboundFaces60KTest

2.1M Views30.1K Discussing

BTC rebounded from around $55,300 on November 21, briefly reclaiming $60,000 before pulling back to around $59,300. The $60K level is back in focus as traders assess whether the recovery can last. Is this rebound a sign of stabilization or a short-lived recovery? Would reclaiming and holding $60K be enough, or do you need confirmation from trading volume and fund flows?

PCEAndGDPDataNextWeek

258.5K Views2.6K Discussing

GateDirectIPOPhase3ANTAllocates92100Shares

820.4K Views5K Discussing

View More