



Share your thoughts
placeholder
Article
No moves, no analysis, just pure luck—this performance is embarrassing to even talk about. When the market plunged intraday, everyone was running, but I kept my eyes on $PONS ’s chart and noticed that someone stepped in every time it dipped, with key levels never breaking. Be greedy when others are fearful—directly signaled to open a long at 0.4775. And now, 0.8614, +1584.6%. It feels great when you get the rhythm right. It was truly sluggish at first, but the result is truly satisfying. Take profit on 80% first, and set a breakeven stop to protect the remaining 20%. Staying out of the market
post-image
PONS-9.49%
BTC+0.51%
SNDK+0.79%
The hand that set the stop-loss a few days ago trembled slightly; this morning, I realized that act of filial devotion had been unnecessary. During the repeated intraday swings, while everyone else was selling at a loss, I saw $OKB hold firmly at 96.30, with pullbacks never breaking the level and funds quietly entering. I said at the time that this was a position worth trying. As a result, today it surged straight to 113.82, delivering +444.41%—what a rush. This run was worth the wait. I’ve taken profit on 80% first, locking in the gains; I’ll move the stop-loss on the remaining 20% closer to
post-image
OKB+0.44%
ZEC+20.11%
XRP+0.60%
9.7 Gold Morning Strategy
On the hourly chart, gold prices surged and then pulled back under pressure. After a rapid retracement, the decline slowed, and prices found support above the lower Bollinger Band. The lower Bollinger Band is gradually flattening. After the sharp short-term drop, a technical rebound is likely, while the pace of the decline has eased. Do not blindly chase short positions in the morning; focus on opportunities to stabilize after a pullback.
Key Levels
Resistance: 4450, 4470
Support: 4410, 4395
Strategy:
Go long after prices stabilize in the 4400–4415 range following a p
post-image
XAUT-0.12%
#GateTops7DayNetInflowsGlobally Gate Tops Global 7-Day Net Inflows — A Strong Signal of Growing Market Confidence
In the fast-moving world of crypto, capital flow is one of the most important indicators of market sentiment. While prices can change within minutes, sustained net inflows can provide a broader picture of where users and capital are moving.
GateTops7DayNetInflowsGlobally highlights Gate’s strong position in global 7-day net inflows, drawing attention to the platform’s growing activity and increasing participation from the crypto community.
Why does this matter?
Net inflows reflec
post-image
BTC+0.50%
ETH+1.33%
I did nothing—just went to the restroom, and when I came back, the candlestick chart had already done the work for me. A few days ago, I glanced at $SKHYNIX before bed. The price was right around 1202.67; the key level held, the pullback stabilized, and funds were quietly flowing in—not being advertised to you with one huge bullish candle. While everyone else was running, I instead felt it had an opportunity. When I opened the chart today, it had clearly moved above 1283.25, and +476.57% had simply landed in my account. This profit feels great—staying up late was worth it. Take 80% off the tab
post-image
SKHYNIX+0.26%
ZEC+20.11%
SNDK+0.79%
This $ETH trade was handled relatively steadily, using a strategy of taking profits in batches. The entry premise was simple: the higher timeframe was still in a bullish structure, while the lower timeframe was merely undergoing a rapid shakeout, trapping those who chased shorts before quickly recovering. I judged this to be a shakeout rather than a reversal, so I opened a long position at a key panic level. After the market confirmed the move, I did not rush to exit everything, but first took profits on 80% to lock in the existing unrealized gains, while using a protective level to trail the
post-image
ETH+1.32%
BTC+0.51%
ZEC+20.11%
#HYPEBreaks88HitsNewAllTimeHigh HYPE BREAKS $88 AND HITS A NEW ALL-TIME HIGH!
The Hyperliquid ecosystem is once again taking center stage as HYPE pushes into fresh price-discovery territory. The token recently broke above the $88 level and went on to print a new record high near $89.6, confirming one of the strongest rallies in the crypto market.
A Powerful Breakout
HYPE had already been showing remarkable strength throughout the recent market recovery, but breaking above previous highs is a different story. Once an asset enters price discovery, there are no major historical resistance level
post-image
HYPE+3.05%
BTC+0.50%
$MARSCOIN 24-hour dump of 22%, with $350 million in trading volume—this isn’t a pullback; someone is throwing their holdings in your face. Here’s the conclusion: if the 0.177 low breaks, there is no meaningful support below, so don’t rush to catch a falling knife.
You’re asking about the macro picture? There is indeed no CPI or nonfarm payrolls today, and the Federal Reserve is still in its blackout period, but don’t forget that last week’s meeting minutes revealed one signal—the internal disagreement over rate cuts is much greater than what the market has priced in. I pulled nearly three year
MARSCOIN-23.53%
BTC+0.50%
NAS100+0.11%
How to identify hundredfold- and thousandfold-return assets in a bull market
1. Choose the right track, with a high enough ceiling, great potential, and ample room for growth;
2. This year’s hot spots are the BTC ecosystem, ETH ecosystem, and SOL ecosystem;
3. Hundredfold-, thousandfold-, and ten-thousandfold-return assets have emerged in the BTC ecosystem, with clear profit-making opportunities;
4. The ETH and BSC ecosystems have performed fairly average, with no dark horses emerging for now and no clear profit-making opportunities so far;
5. Many coins in the SOL ecosystem have surged this y
post-image
BTC+0.50%
ETH+1.33%
SOL+3.11%
CORE-0.24%
Everyone’s eyeing BNB at 750—but the 4h chart is silently screaming “trap” while the daily range holds its breath.

$BNB /USDT - SHORT

Trade Plan:
Entry: 749.30 – 751.40
SL: 760.45
TP1: 742.77
TP2: 737.72
TP3: 730.14

Why this setup?
- Price is pinned at 750.35 with a 1D range, yet the SHORT bias (conf 55) targets a clean drop to 742.77 first.
- RSI on the 15m is only 56.1—no overheated bounce fuel, while ATR (4.2) shows volatility is compressed, priming a snap.
- Why now? The “waiting” status means the entry zone (749.30–751.40) is the exact battlefield; a rejection here flips momentu
BNB-1.65%
Keep holding, and be a bit more determined. By the way, if you’ve already reduced your position, hitting the stop-loss still means a profit.
I just took profit on my long position, so I’m reviewing it while the memory is still fresh. The market was moving sideways at the time, with the moving averages on the hourly chart converging, volatility narrowing further, and the chips clearly being compressed. I judged that the direction would most likely break upward, so I first positioned part of my long near the lower boundary of the range.

The move started a little later than I expected, with even several false dips in between. However, none of the dips broke down the range structure, and the key levels were actually moving higher. Th
post-image
ZEC+20.11%
BNB-1.65%
$DOOD Signal】Bullish breakout + overbought continuation
$DOOD RSI 14 surged to 91.21, while 1H/4H MACD showed dual bullish expansion, and the price advanced along the upper Bollinger Band. Depth imbalance stood at 16.31%, with clear bid support. 1H surged from 0.001673 to 0.001951 at a steep slope, while 4H volume increased simultaneously. The funding rate of 0.0351% remains moderate, and OI is stable. The price continues to be aggressively pushed higher in the overbought zone, with a risk-reward ratio of 1.5; strict stop-loss placement is required.
🎯Direction: Long
⚡Entry/limit order: 0.001
post-image
DOOD+29.89%
BTC+0.50%
ETH+1.33%
SOL+3.11%
bitcoin:native about to take off
BTC+0.50%
Layout for Bitcoin, Ethereum, and Dogecoin
live-cover
LIVE3,655
  • 1
$NAORIS Signal】Long + End of High-Level Consolidation
$NAORIS 4H is pushing upward along the upper Bollinger Band at 0.0397, while RSI is flattening at a high level of 84.8. 1H MACD momentum is contracting, and the price has not broken down. Order book depth imbalance is -7.04%, with sell-side orders slightly thicker. The funding rate is 0.0323%, long/short positioning interest is stable, and OI is steady. There is a short stop-loss zone near 0.0405 above; a breakout could easily trigger cascading buy orders. The current price is at the end of a 15-minute consolidation.
🎯Direction: Long
⚡Ent
post-image
NAORIS+29.63%
BTC+0.50%
ETH+1.33%
SOL+3.11%
[New Streamer] Market Prediction
live-cover
LIVE52
I didn’t chase $LIT when it surged during the day, as a long-term trendline was directly overhead and it would have been difficult to place a stop-loss after entering. I waited for it to pull back and regain stability before entering a long position based on the lower-timeframe structure.

After entering, it consolidated for a while. I didn’t rush to trade in and out; once the price moved a certain distance away from my entry zone, I first closed 80% to lock in the profit on the core position, leaving the remaining 20% to follow the trend.

After the breakout candlestick appeared, I first to
post-image
LIT-5.41%
SNDK+0.79%
BNB-1.65%
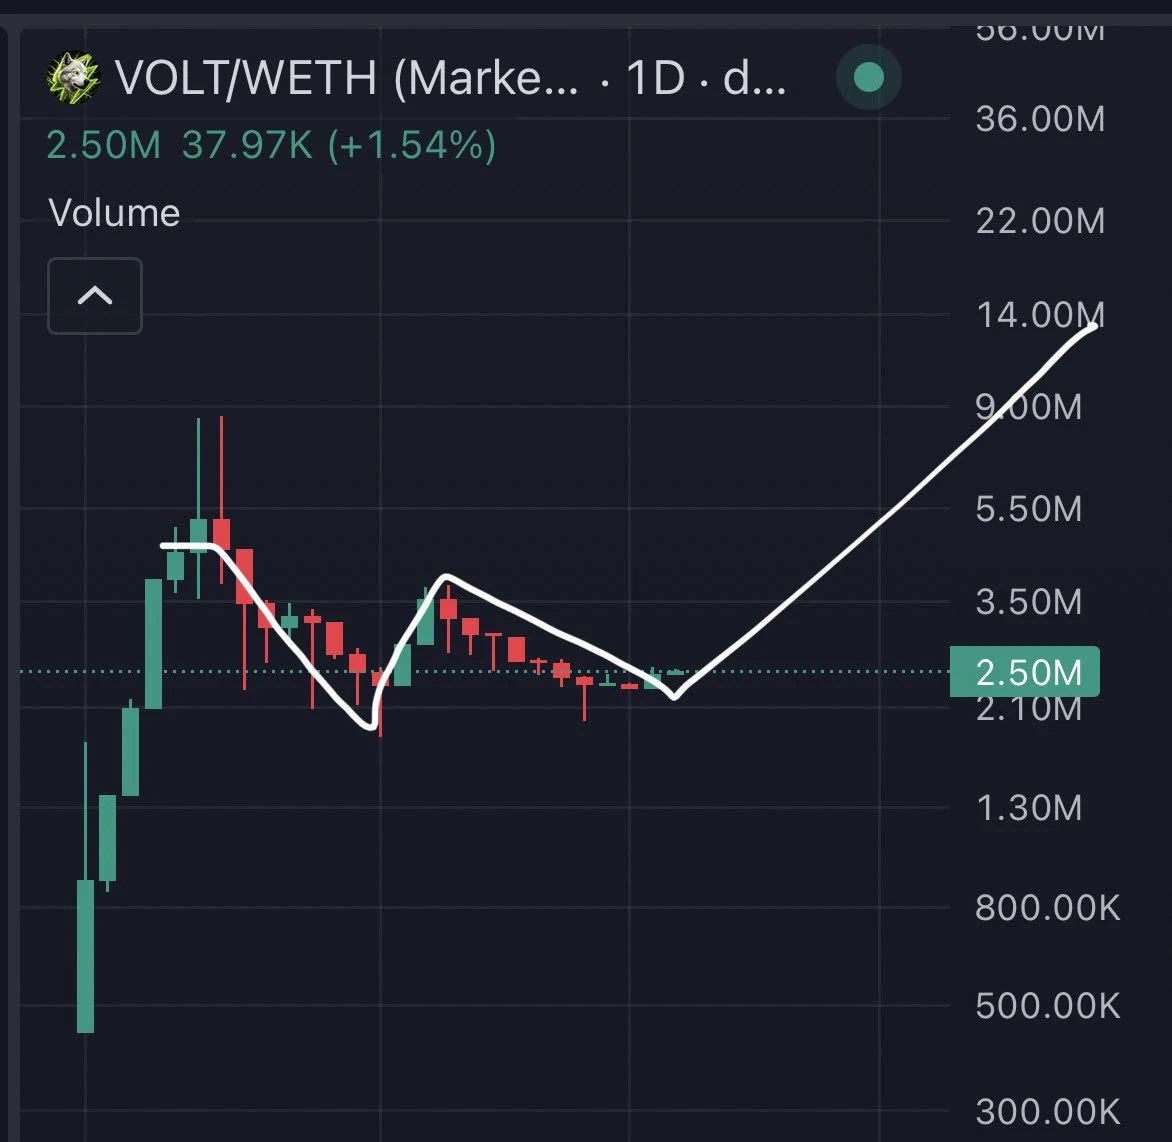
solana:FtHCpYdjVx8WR6vc4zqe6iXqHydZcKhNnmSNF2NXKfy1 big pump coming
10x
TcnKFgDZc6RhAz83JHHbWeZ5wLc2at8iHK6FhsxkTLh
Keep buying the dip
#crypto #memecoin $sol $btc
post-image
SOL+3.11%
MEME-1.39%
BTC+0.50%
The 10x contract $UNI rises every day; I should be able to achieve financial freedom.
UNI+1.59%
Load More

Join 40 M users in our growing community

⚡️ Join 40 M users in the crypto craze discussion

💬 Engage with your favorite top creators

👍 See what interests you

View More