Square
Following
Hot
News
Notifications
Profile
Share your thoughts
placeholder
Article
#70%OfAltcoinsFallBelow200DMA
#OfAltcoinsFallBelow200DMA

The cryptocurrency market is facing another important moment as a large number of altcoins fall below their 200-day moving average (200DMA). This development is attracting attention from traders and investors because the 200-day moving average is an important indicator used to understand the long-term market trend.

The 200DMA helps investors identify whether an asset is showing strength or weakness over a longer period. When an altcoin falls below this level, it can indicate increasing selling pressure and weaker market momentum.

Thi
BTC-0.67%
  • 3
In BTC trading, how can you develop a truly actionable trading plan?

Many BTC traders study the market every day, analyzing candlesticks, trading volume, and various technical indicators. They also often discuss whether the market will rise or fall next. But when it comes to actually trading, a common problem arises: there are no clear entry criteria, stop-losses are decided on the fly, and traders don’t know when to take profits.

That’s why some people can study the market for a long time yet still see inconsistent account performance.

To build a truly actionable trading plan, you can star
post-image
BTC-0.65%
Trenches
ZIG
Z
bade
b
ZIG
0x8c...1145
Market Cap
$.
Change
.
24h Vol
$.
Holders
.
STONK
S
bade
b
STONK
6GmA...UNgx
Market Cap
$
Change
.
24h Vol
$.
Holders
.
IDOL
I
bade
b
IDOL
0x3b...ab07
Market Cap
$.
Change
.
24h Vol
$.
Holders
.
CLAUDIA
C
bade
b
CLAUDIA
2j5S...W2ZM
Market Cap
$.
Change
.
24h Vol
$.
Holders
.
MAGGIE
M
bade
b
MAGGIE
8rHo...PmZV
Market Cap
$.
Change
.
24h Vol
$.
Holders
.
Why Can Frequent Trading Make Your Account Smaller?

In BTC trading, many people watch the market every day, afraid of missing any rise or fall. When the price goes up, they want to go long; when it goes down, they want to go short. When they see an indicator signal, they can’t resist opening a position. They trade over ten times a day, seemingly working very hard, but when they look back at the end of the month, their account balance may have shrunk.

Where exactly does the problem lie?

First, trading costs keep adding up. Every time you open or close a position, you may incur a fee. If you
post-image
BTC-0.65%
Crypto Card Security Comes Under Scrutiny After Gnosis Pay Reports Unauthorized Access
live-cover
LIVE1,051
I've been shorting ZEC since above 1600, and I'm still at it. Damn ZEC, keep shorting it for me $ZEC
ZEC+1.29%
How Can You Manage Position Size in BTC Trading?

In BTC trading, many people spend a great deal of time studying market direction but overlook a more important question: even if you correctly predict the market, unreasonable position sizing can still prevent you from achieving your desired trading results.

Why Is Position Management So Important?

First, position size determines how much losses affect your account. If BTC falls 2%, a trader with a small position may incur only a minor loss, while a trader using high leverage and a large position may face severe losses or even liquidation. Co
post-image
BTC-0.65%
Ahr999 flashes a buy-the-dip signal—why are seasoned investors afraid to buy?

When Ahr999 falls below 0.45, the first people to get excited are often those preparing to buy the dip.
But seasoned investors who have been through several bull and bear cycles may just quietly open their calculators. 🤣
BTC has now pulled back to around $76k, with Ahr999 at about 0.43, once again entering the range commonly seen as a buy-the-dip zone.
This indicator combines BTC’s current price, its 200-day dollar-cost-averaging cost, and its long-term growth valuation to gauge Bitcoin’s position relative to its h
BTC-0.67%
  • 14
gm frens,
happy sunday.
post-image
$XMSFT Quick take: Microsoft’s capital expenditures in Q3 came in about $5 billion below market estimates, mainly because third-party data center deliveries fell behind schedule, prompting a clear pullback in expansion. The current price is $529.87, down a slight 0.47% over 24 hours, with trading volume of only about $5,227; weekend liquidity is essentially frozen. Cash equities rose about 1.67% last week, while Nvidia fell about 8.8% and Tesla about 10.4% over the same period (Hong Kong Wen Wei Po). Scrutiny of external computing-power partners Nebius, IREN, and Nscale is tightening, with hig
post-image
MSFT-0.95%
NVDA+2.80%
TSLA+4.26%
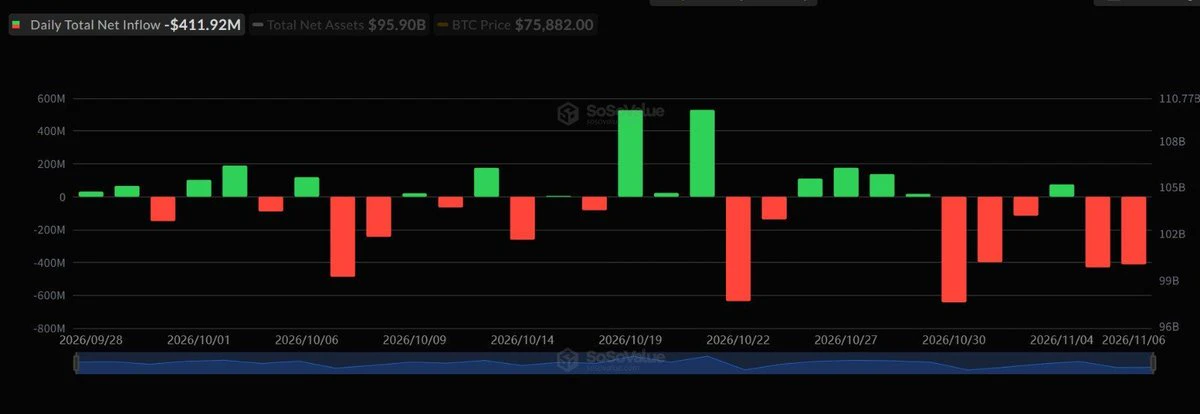
Bitcoin ETF outflows look ugly, but one fund is driving almost all of it.
Nov 6:
US BTC ETFs: -$411.9M
BlackRock IBIT: -$403M
Fidelity FBTC: +$42.8M
For the week, IBIT alone lost ~$1.21B.
That concentration matters before calling this a broad institutional exit.
$BTC
post-image
BTC-0.31%
#USNonfarmPayrolls #ShareWeekly
The US Nonfarm Payrolls (NFP) report remains one of the most closely watched economic releases in global markets. Released monthly by the Bureau of Labor Statistics, it measures the change in the number of employed people in the United States, excluding farm workers, private household employees, and non-profit organization employees. It captures the pulse of the broader economy through private-sector hiring trends across manufacturing, services, construction, healthcare, professional services, transportation, and more.

On November 6, 2026, the October NFP prin
#70%山寨币跌破200日均线 70% is a high proportion, but still far from extreme oversold territory. For now, it looks more like the market is continuing to weaken; there is no clear sign that a reversal is near.
The proportion has rebounded quickly: At the beginning of October, only about 10% of altcoins were below this line, but it has since risen to 70%, showing that the decline came quickly.
Still far from extreme oversold territory: At the end of June, this proportion once reached about 84%. Some analysts believe that only a reading above 90% counts as an extreme oversold signal.
The drivers are macr
USDC+0.01%
BTC-0.67%
ETH-1.26%
SOL-0.77%
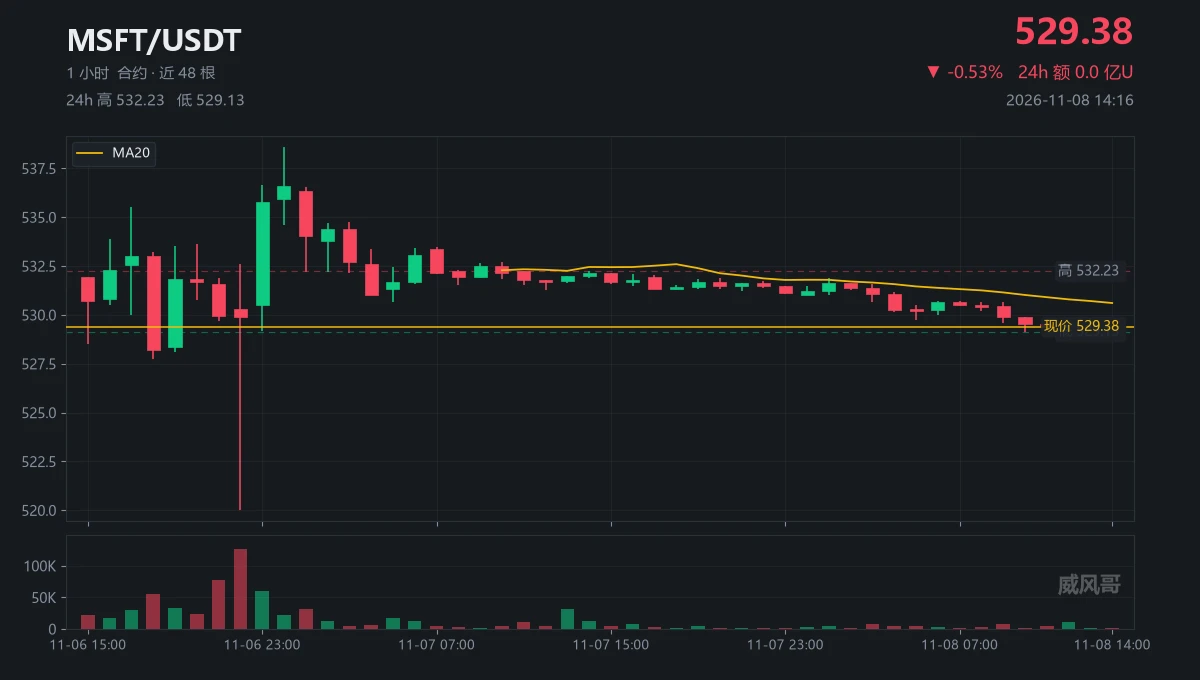
At 14:00, that candle had 1,110 lots, 30% of average volume. I checked twice.
· Position cost: stop-loss at 520.02, a $9.36 distance from 529.38.
· Reward cost: only 9.22 to 538.6, for odds of 0.98.
· Time cost: until Monday 22:30, the price won’t be determined by the market for thirty-two hours.
· Sweep cost: 1,110 lots move it $0.32; 11,541 lots move it $0.08.
· Trend cost: even after thirty-eight hours, it only recovered 9.22; it hasn’t touched 537 since 538.6.
With all five costs laid out, the gain is less than the loss. No need to run the numbers twice.
$MSFT 24-hour trading volume is $4
post-image
MSFT+0.59%
  • 1
#Ahr999EntersBottomBuyingZone
The Bitcoin market may be approaching one of its most interesting phases as the Ahr999 indicator enters the potential bottom-buying zone. For long-term Bitcoin investors, this is an important signal worth watching. Whenever the market experiences a major correction, investors start asking the same question: Is this the right time to accumulate Bitcoin, or could prices fall even further?

The Ahr999 indicator has become a popular tool among Bitcoin investors because it attempts to identify periods when BTC may be undervalued compared with its historical growth tre
post-image
BTC-0.67%
Today's star is undoubtedly CLAUDIA!
Will it keep rising, or are the floodgates about to open?
【Fully Automated Quantitative Trading Software】

Strategy Backtesting|Automated Execution|Cloud Management|Multi-Strategy Support

Want to learn quantitative trading? Want to test your trading ideas? Want to see how different strategies perform on historical market data?

【Key Features】

I. Diverse Strategy Templates

* Built-in quantitative strategy templates
* Choose freely from a variety of trading approaches
* Supports custom strategies and parameter adjustments

II. Historical Data Backtesting

* Supports backtesting with historical market data
* Simulates the performance of different str
post-image
crypto market update
live-cover
LIVE1,001
$HMSTR #HMSTR
Trying to break Falling Wedge on 1D chart.
Successful breakout could provide 70-75% bullish rally during coming days✍️
HMSTR-1.98%
Load More

Join 40 M users in our growing community

⚡️ Join 40 M users in the crypto craze discussion

💬 Engage with your favorite top creators

👍 See what interests you

Trending Topics

USCPIDataIncoming

4.16k Views1.53k Discussing

The U.S. October CPI report will be released on November 10 at 8:30 a.m. ET. September CPI came in at 3.7% year over year, and markets will be watching closely for signs that inflation is cooling, especially in core CPI. A softer-than-expected reading could strengthen rate-cut expectations, while hotter inflation may pressure risk assets through higher Treasury yields and a stronger dollar. How do you think this CPI print will move $BTC, U.S. stocks and gold?

USAIStocksHitHard

24.99k Views3.71k Discussing

USNonfarmPayrolls

44.93k Views4.44k Discussing

View More