Square
Following
Hot
News
Notifications
Profile
Share your thoughts
placeholder
Article
🧧 Gate Live’s red envelope rain comes every day. Have you grabbed one today?
🎙 Chat about trending markets in real time, with professional hosts monitoring the charts live. You can also connect with them on mic anytime to interact, discuss hot topics, and find opportunities~

Look for livestreams with a red envelope icon on the cover. Join to claim a red envelope!
⚡ Get your fingers ready: https://www.gate.com/live
post-image
  • 5
  • 3
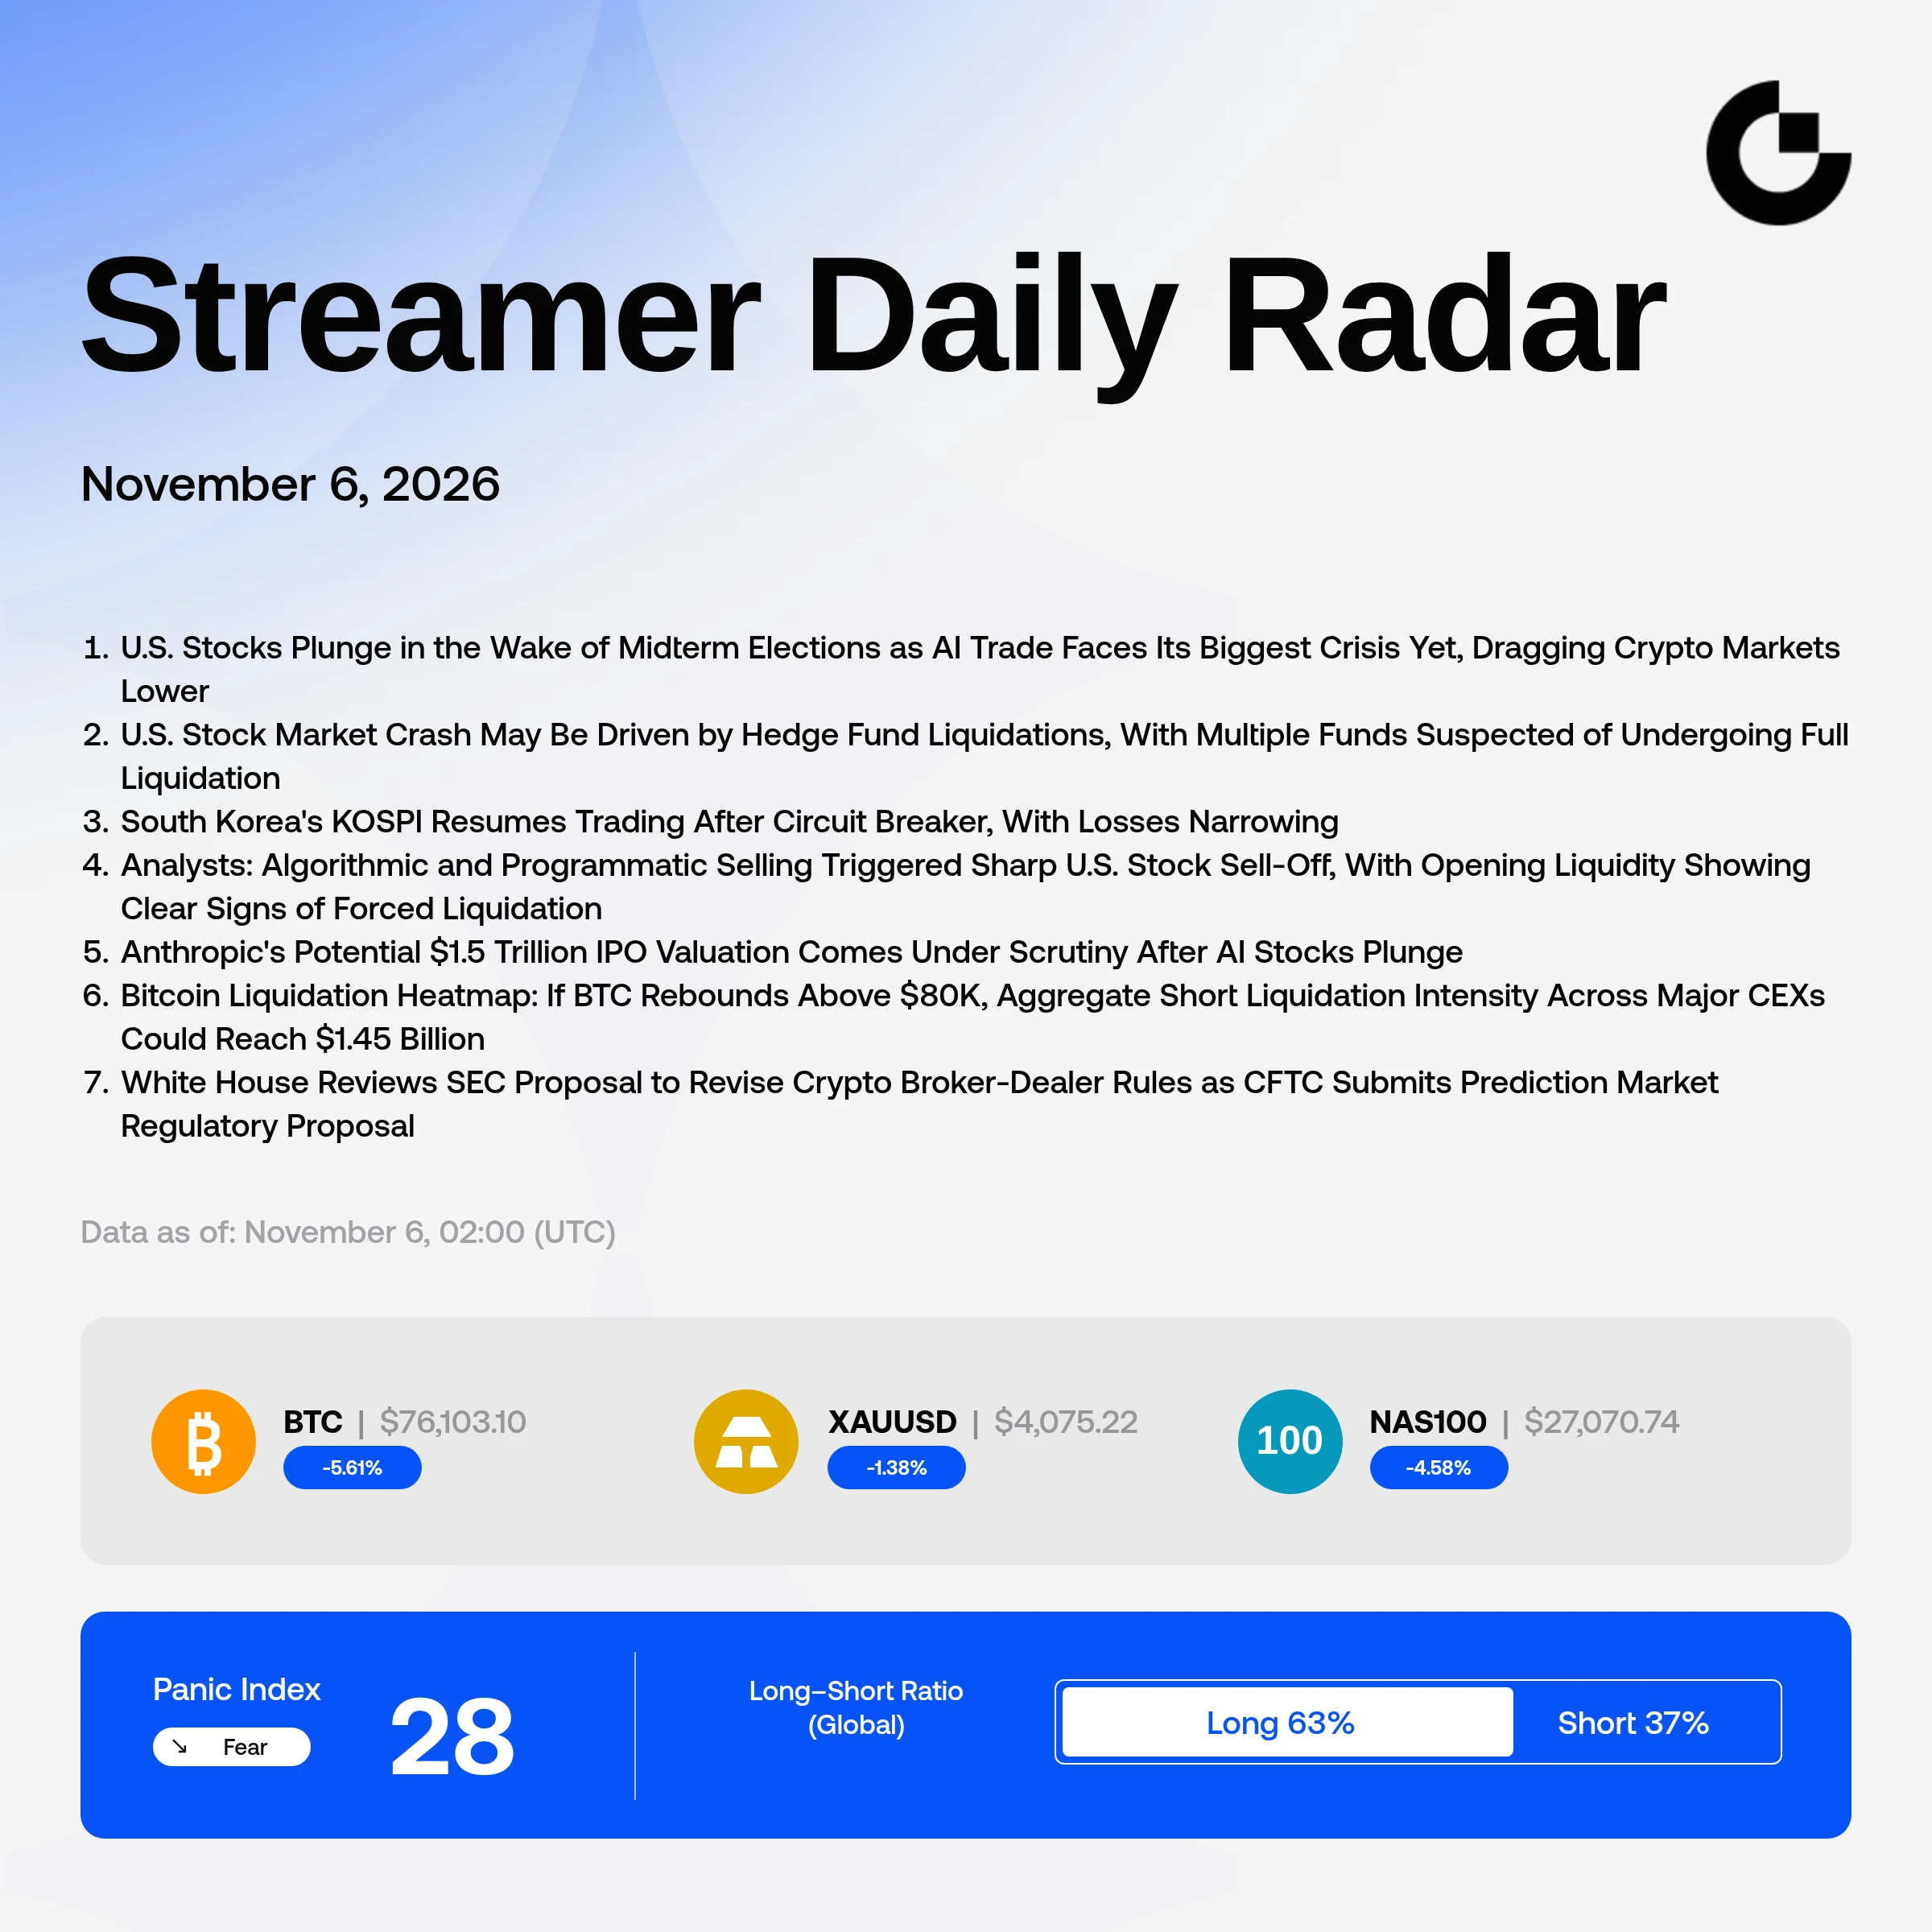
𝗖𝗥𝗬𝗣𝗧𝗢 𝗕𝗟𝗘𝗘𝗗𝗦 𝗔𝗦 𝗥𝗜𝗦𝗞 𝗔𝗣𝗣𝗘𝗧𝗜𝗧𝗘 𝗙𝗔𝗗𝗘𝗦 🔻
The crypto market is under pressure as Bitcoin and Ethereum follow the broader risk-off move.

$BTC Around $76,200
$ETH Around $2,242

Bitcoin has dropped toward its lowest levels since September, while Ethereum has also suffered a sharp decline.

My approach is cautious:

- Avoid chasing falling prices.
- Watch important support zones.
- Wait for a confirmed recovery.
- Preserve capital during uncertainty.

Buying every dip is not a strategy. Sometimes staying on the sidelines is the smarter move.
#ShareWeekly
#CryptoMa
BTC-5.05%
ETH-7.19%
  • 6
  • 2
Trenches
fxUSD
f
bade
b
fxUSD
0x08...d8f6
Market Cap
$.
Change
.
24h Vol
$.
Holders
.
ZIG
Z
bade
b
ZIG
0x8c...1145
Market Cap
$.
Change
.
24h Vol
$.
Holders
.
BTC
B
bade
b
BTC
C5xp...pump
Market Cap
$.
Change
.
24h Vol
$.
Holders
.
CORLA
C
bade
b
CORLA
0xba...7777
Market Cap
$.
Change
.
24h Vol
$.
Holders
.
STONK
S
bade
b
STONK
6GmA...UNgx
Market Cap
$.
Change
.
24h Vol
$.
Holders
.
First, I'll get fresh data on #PEPE, because the previous report is based on data roughly a day old.

**Short summary:** For the next few days, the base case for PEPE is sideways trading in a range of approximately **$0.00000463–$0.00000509**. A breakout above the upper boundary with a daily close would open the way to $0.00000531, while a close below $0.00000463 would bring the price back to $0.00000451 and lower. This is a technical forecast based on current levels, not a guarantee of price movement.

**Current data** (Gate spot market, daily candle, data as of around 03:00 UTC on 2026-11-0
PEPE+0.97%
⚖️ ELIZABETH WARREN EYES SENATE BANKING CHAIR!
The anti-crypto Senator could gain major influence over US financial and crypto regulations.
Tougher crypto oversight could be on the horizon.
A major concern for the crypto industry!
Gate Live’s daily Red Packet Rain is here! Have you grabbed yours today?
🎙 Catch the latest market moves with pro streamers watching the charts live. Join the conversation, hop on mic, and talk trends & trading opportunities together~

Look for livestreams with the 🧧 icon on the cover, jump in, and grab your red packets!
⚡ Get your fingers ready: https://www.gate.com/live
post-image
  • 6
  • 4
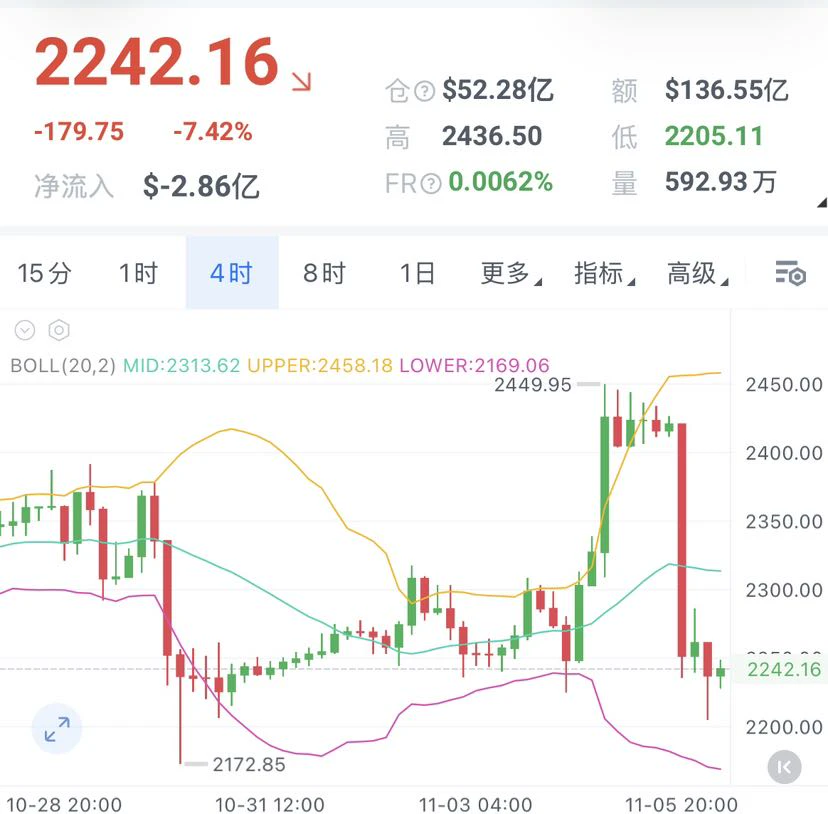
Tong Ge's 11.6 ETH outlook
$ETH Short near 2260-2280, stop loss at 2300, targets 2200-2150-2100

Up 200 one day, down 200 the next. Yesterday's high reached 2449, while today's low plunged to 2205, making for an almost 500-point A-shaped crash in two days. The longs were still celebrating wildly yesterday, thinking the bull market was back, but today the market showed a completely different face and taught them a lesson.

Look at the chart now: the daily candle is a huge bearish candle that engulfed everything, while the 4-hour chart has formed a guillotine pattern, even breaking below the low
post-image
ETH-1.23%
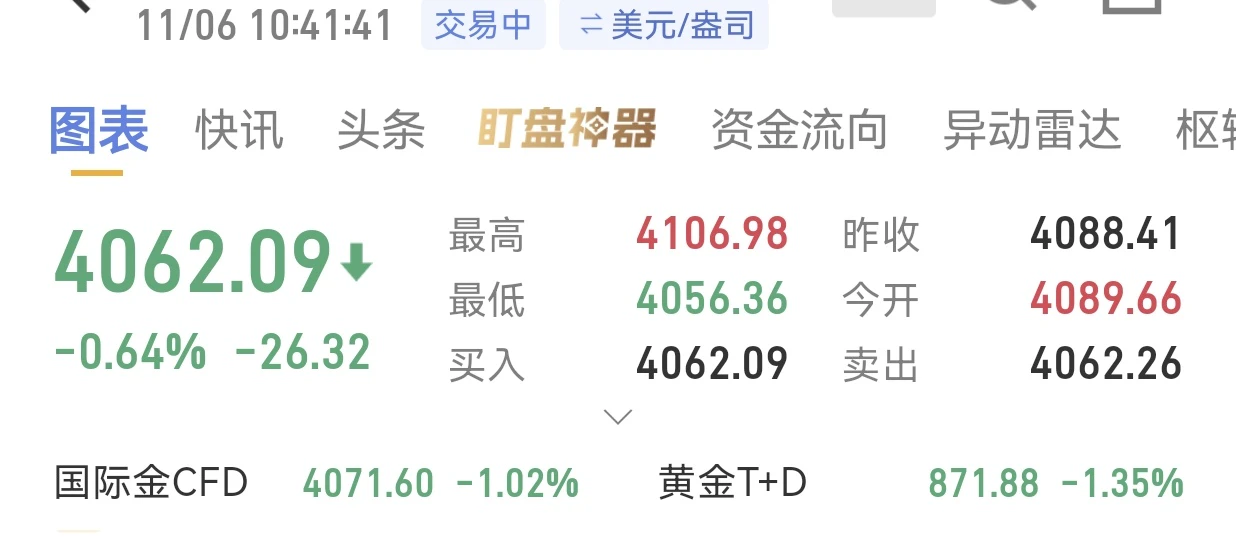
Go long at the current price of 4062, stop-loss at 4055, targets at 4071 and 4080$XAU #ETH跌5.5% #黄金 ‌
post-image
XAU+0.38%
  • 3
$BTC The current trend is clearly weak, down 5.96% over the past 24 hours. The key driver behind this sell-off is the forced liquidation of long positions—long liquidations reached $108 million, more than twice the amount of short liquidations. Of the $7.20 billion in total contract open interest, only a small portion was wiped out this time, with a large number of long positions still stacked below. If the price approaches the previous low, these positions will become a source of selling pressure from the next round of forced liquidations.

The options market shows no signs of a rush to buy p
post-image
BTC-0.65%
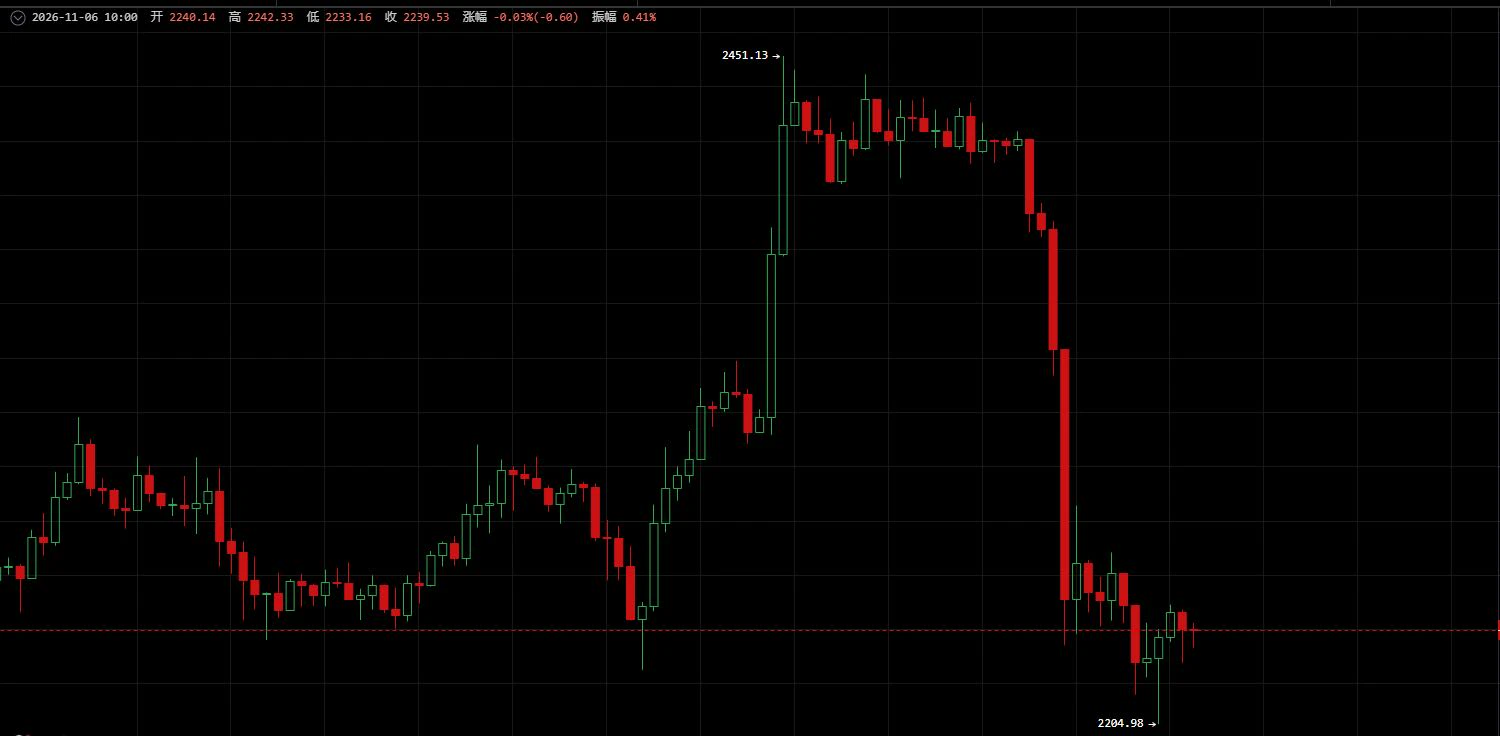
November 6 $ETH After the U.S. election results were finalized, the market shifted to pricing in expectations of fiscal expansion, triggering concentrated selling pressure. After plunging, prices recovered from their lows; short into the rebound.
【Today's Trading Plan】
Short entry range: Position on a rebound to 2260–2280
Take-profit: 2220–2205
【Core Logic】
A surge in hourly trading volume accompanied a sharp breakdown, with bears in control in the short term. The 2260–2280 range is a dense resistance zone formed after the breakdown, with heavy selling pressure on rebounds. A technical recover
post-image
ETH-1.26%
Friday Morning Market Updates
live-cover
LIVE1,794
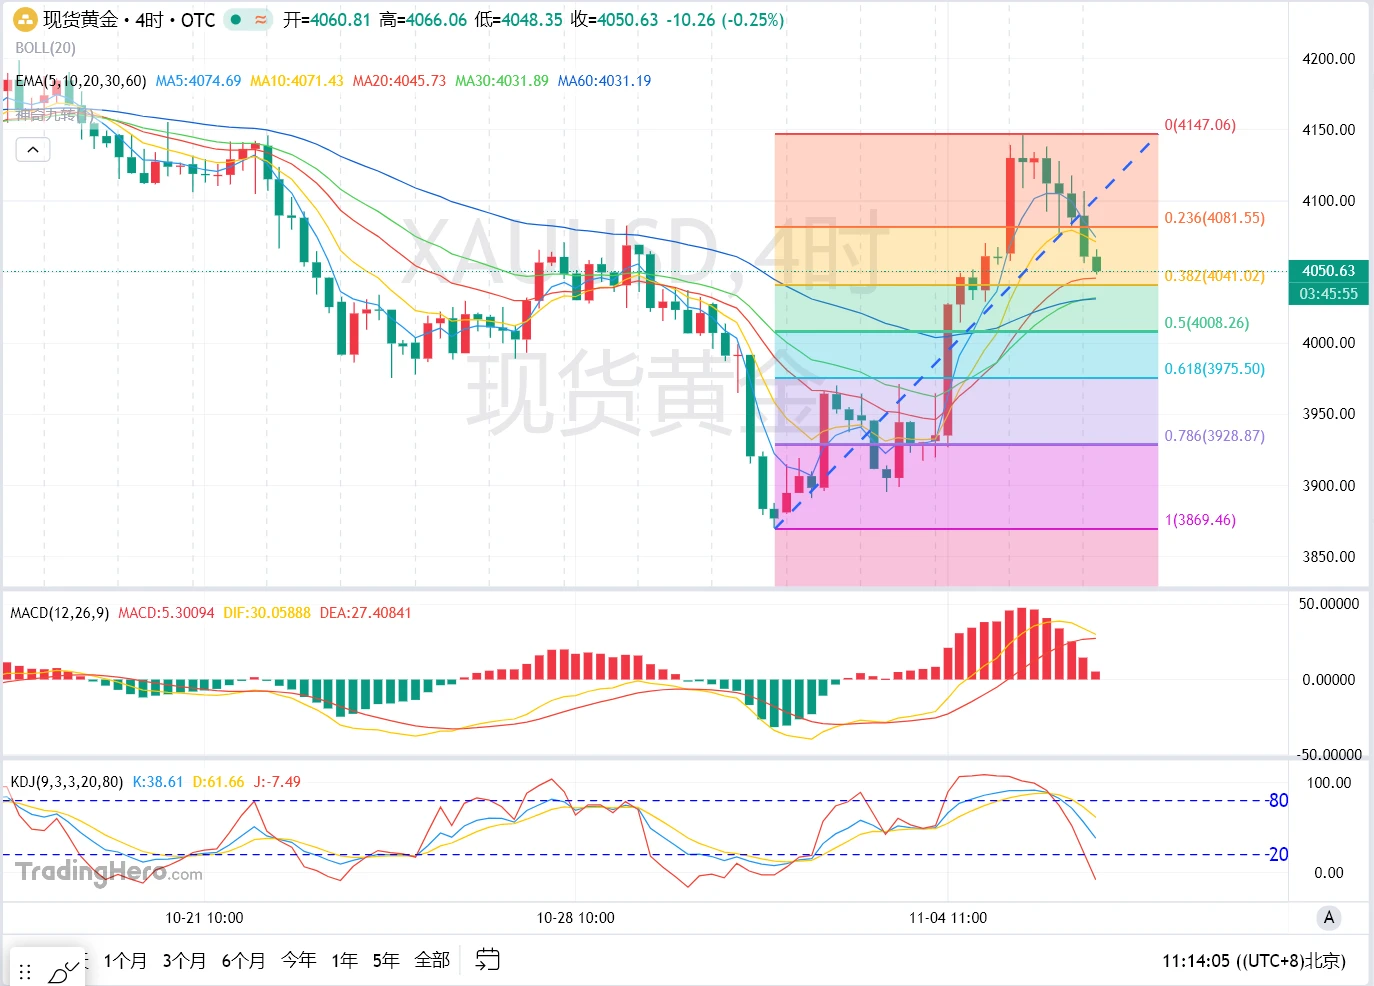
November 6: Gold enters a correction, pulling back sharply overnight

Yesterday, gold surged rapidly during the Asian session, with prices climbing to around $4,146. It then began to fluctuate lower during the European session, with the decline accelerating from session to session. Gold closed near $4,088. After opening slightly lower during today’s Asian session, prices continued yesterday’s weak trend, moving further down to test the $4,048 area.

The market logic has not changed, but the focus has shifted. With the midterm election results settled, expectations of a “blue wave” have been fu
post-image
XAUUSD-1.11%
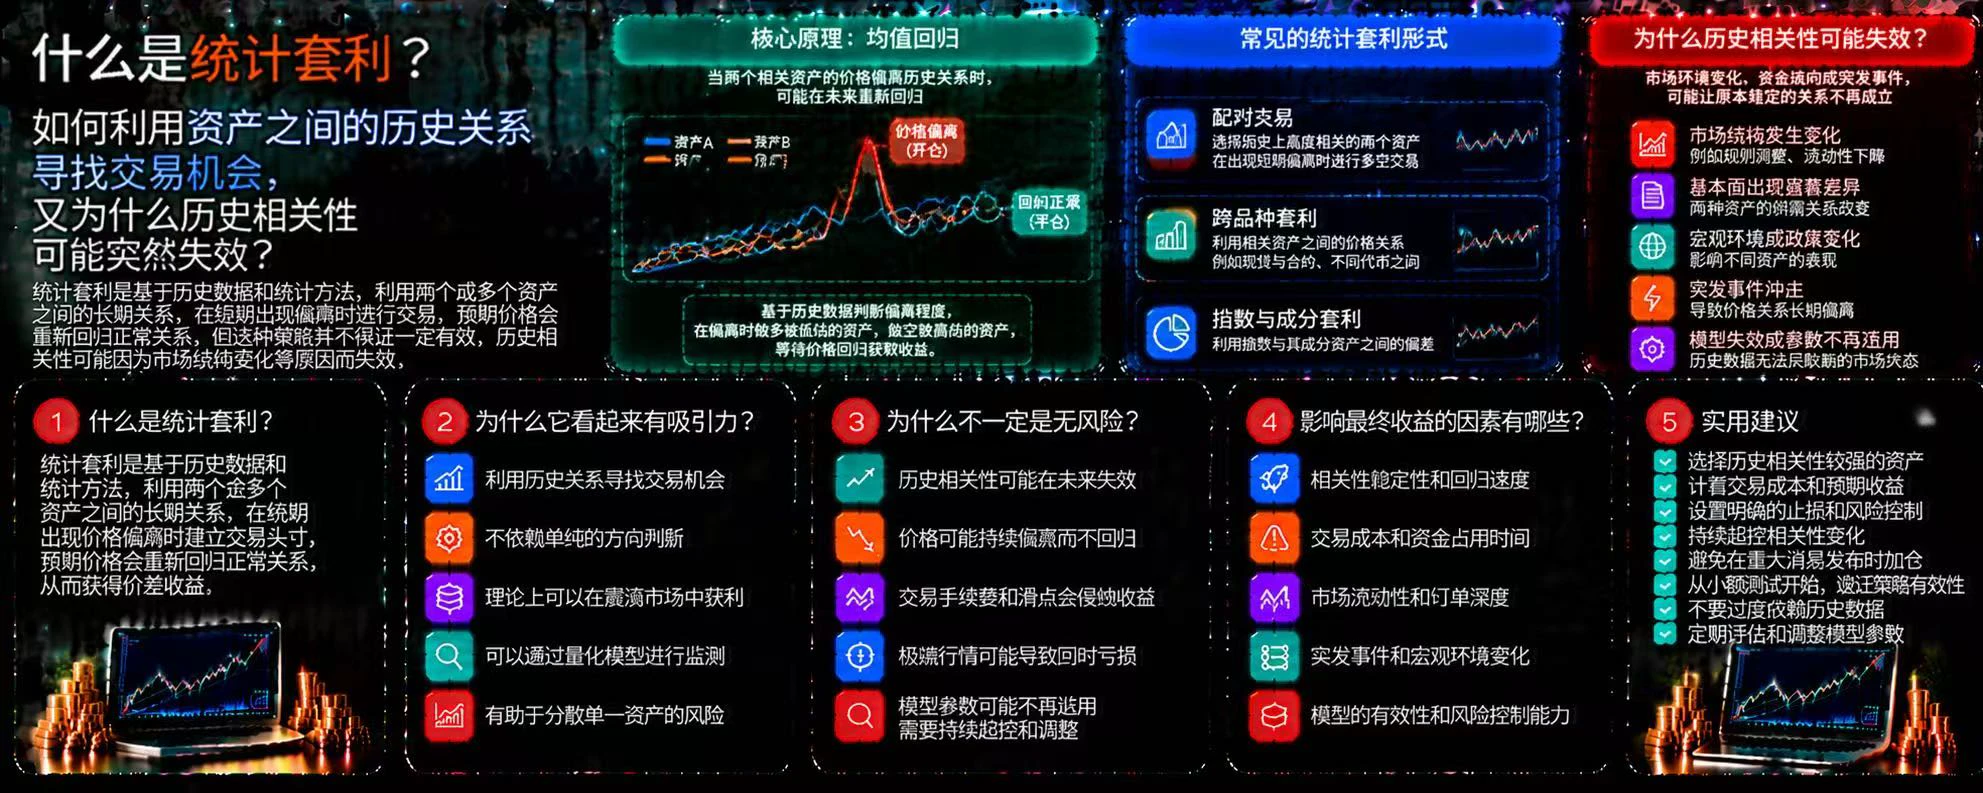
What Is Statistical Arbitrage? How Can Historical Relationships Between Assets Reveal Trading Opportunities, and Why Might Historical Correlations Suddenly Break Down?

In the crypto market, some assets have long displayed similar price movements. When their historical relationship temporarily deviates, traders may try to use that divergence to identify opportunities. This is the basic idea behind statistical arbitrage, but historical patterns are no guarantee of future repetition.

First, what is statistical arbitrage?

Statistical arbitrage is a type of trading strategy that uses historical
post-image
$BTC $ETH Midday Analysis, Nov. 6, published at 12:12 p.m.

The midterm elections are the fuse; last night’s sharp drop was just the appetizer. Tonight will be the hunt. The short on Sandisk at 996 and the short on gold at 4129 both hit their take-profit targets last night. Congratulations to everyone who followed along. Here at Rui Ge’s, all take-profit and stop-loss trades are reviewed so you can learn to respect the market. By reviewing and reflecting with me, you’ll become stronger. If you like the streamer, feel free to follow and watch for a while to see whether a subscription is worthwh
BTC-0.65%
ETH-1.23%
  • 3
What is blockchain? Why is it considered important infrastructure for Web3?
In the Web3 world, blockchain is an important technological foundation for digital assets, smart contracts, and decentralized applications. It is used not only to record cryptocurrency transactions, but also to help multiple participants jointly maintain and verify data without a single central administrator.
First, what is blockchain?
Blockchain is a technology for organizing, validating, and recording data according to specific rules. Transaction information is packaged into blocks, which are then linked to existing
post-image
  • 3
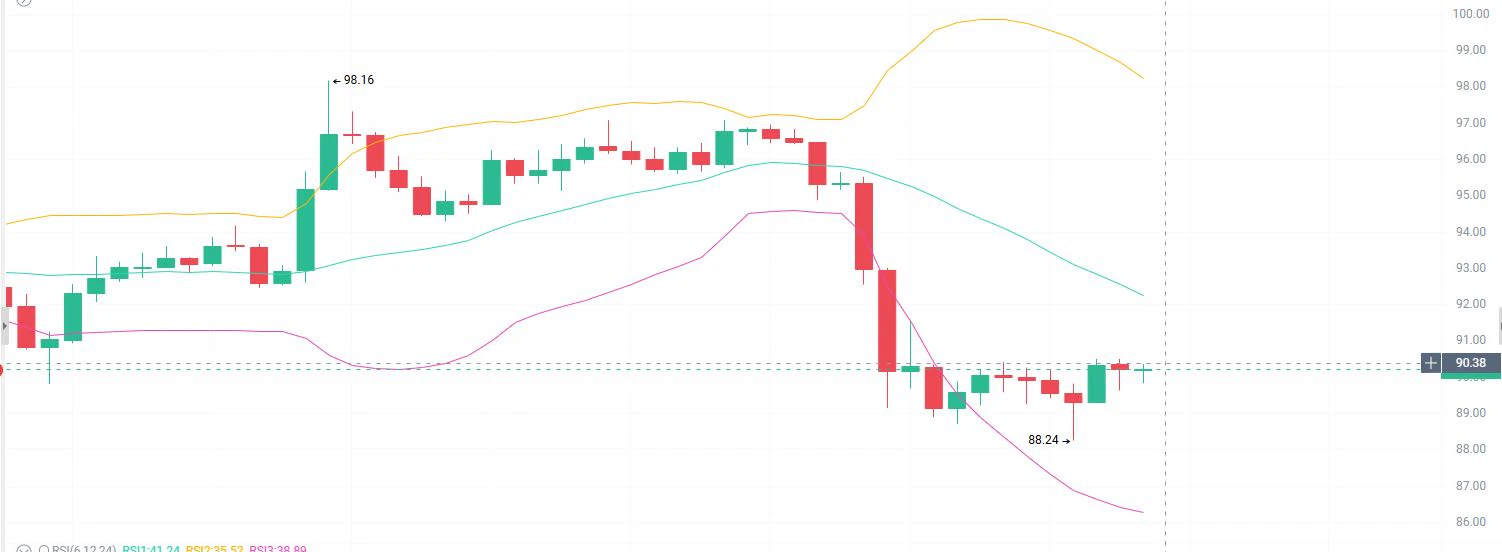
11.6 SOL Analysis

Analysis: Short near 91.5-92.5 on a rebound, with a stop at 93.2, a first target of 90.0, and a second target of 88.24

The 1H chart shows that after surging to a high of 98.16, the market came under pressure and retreated, closing with a high-volume long bearish candle and breaking below key support levels in succession. It hit a low of 88.24 and is currently quoted at 89.93. The short-term uptrend structure has been broken, with concentrated selling pressure from bears. The market has officially entered a weak corrective phase, and after becoming oversold, it has only seen
post-image
SOL-0.77%
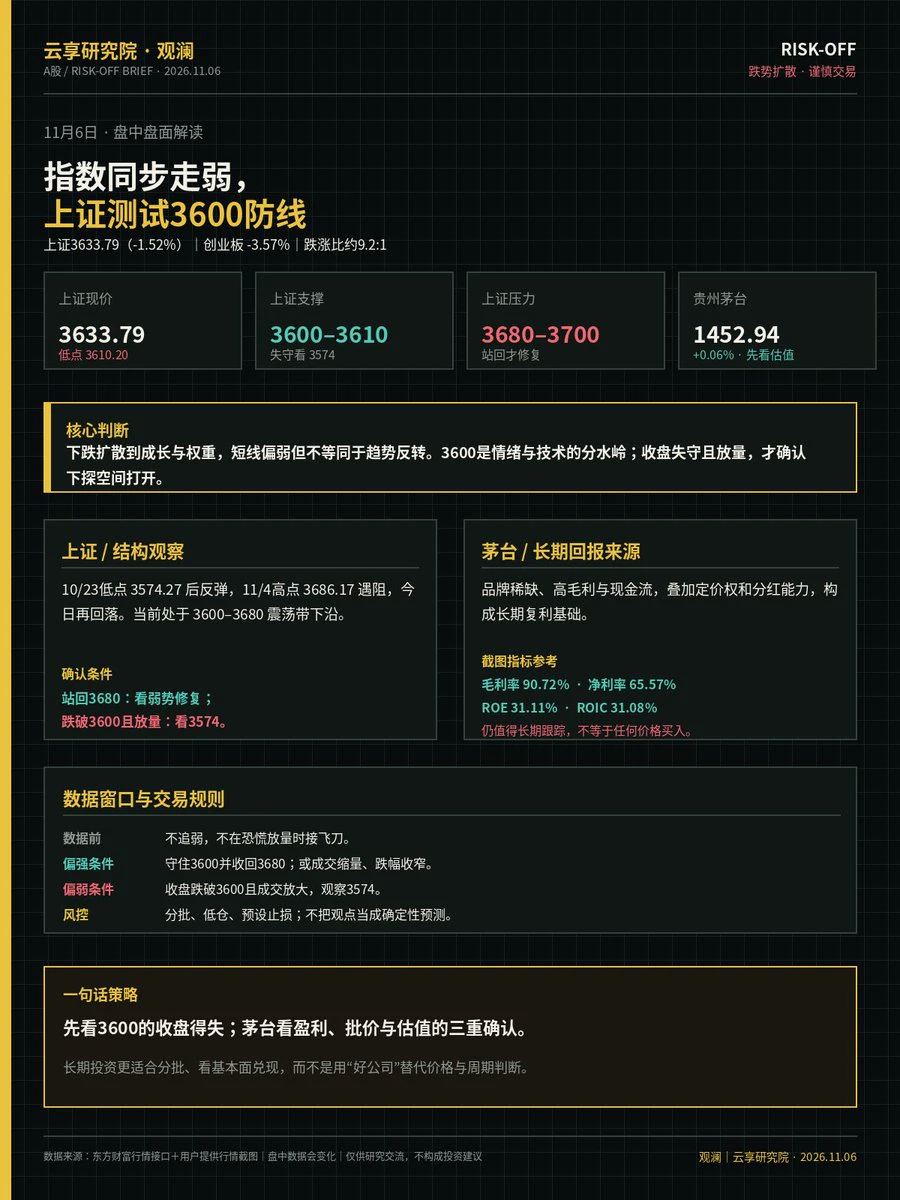
【Yunxiang Research Institute · Guanlan | Nov. 6 Intraday A-Share Market Commentary】
Major indexes weakened in tandem, with the Shanghai Composite testing the 3,600 support level.
Shanghai Composite 3633.79 (-1.52%), ChiNext Index -3.57%; 229 advancers and 2109 decliners, a decline-to-advance ratio of approximately 9.2:1, indicating a marked contraction in risk appetite.
Shanghai Composite: 3600–3610 is the first support zone. A close below this range on higher volume would put 3574 in focus as the next area to watch. 3680–3700 is resistance on a rebound; a return above this range would signal
post-image
Gold has formed an upward structure. How much farther can this rebound go?🔹 BTC is approaching $82,
live-cover
LIVE1,094
🪔 HAPPY DHANTERAS 2026 🪔
🙏 शुभ धनतेरस
✨ May Goddess Lakshmi bless you and your family with wealth, good health, happiness & prosperity.❤️
🙏 धनतेरस की हार्दिक शुभकामनाएँ!
❤️ With Love
🔥 TEAM CRYPTO AMAN 🔥
post-image
Load More

Join 40 M users in our growing community

⚡️ Join 40 M users in the crypto craze discussion

💬 Engage with your favorite top creators

👍 See what interests you

Trending Topics

USStocksFaceHistoricSelloff

586 Views3.47k Discussing

U.S. stocks suffered a sharp selloff on Thursday, with the Nasdaq closing down more than 5% and the Philadelphia Semiconductor Index falling over 12%. AI and chip stocks including $NVDA and $AMD were hit especially hard. Markets are reassessing AI valuations, data-center spending and future returns. Is this just short-term deleveraging, or the start of a deeper correction in the AI trade? Which sectors are you watching next?

GateLaunchesPoSECProofOfSecurity

11.51k Views568 Discussing

USNonfarmPayrolls

8.95k Views3.99k Discussing

View More