Square
Following
Hot
News
Notifications
Profile
Share your thoughts
placeholder
Article
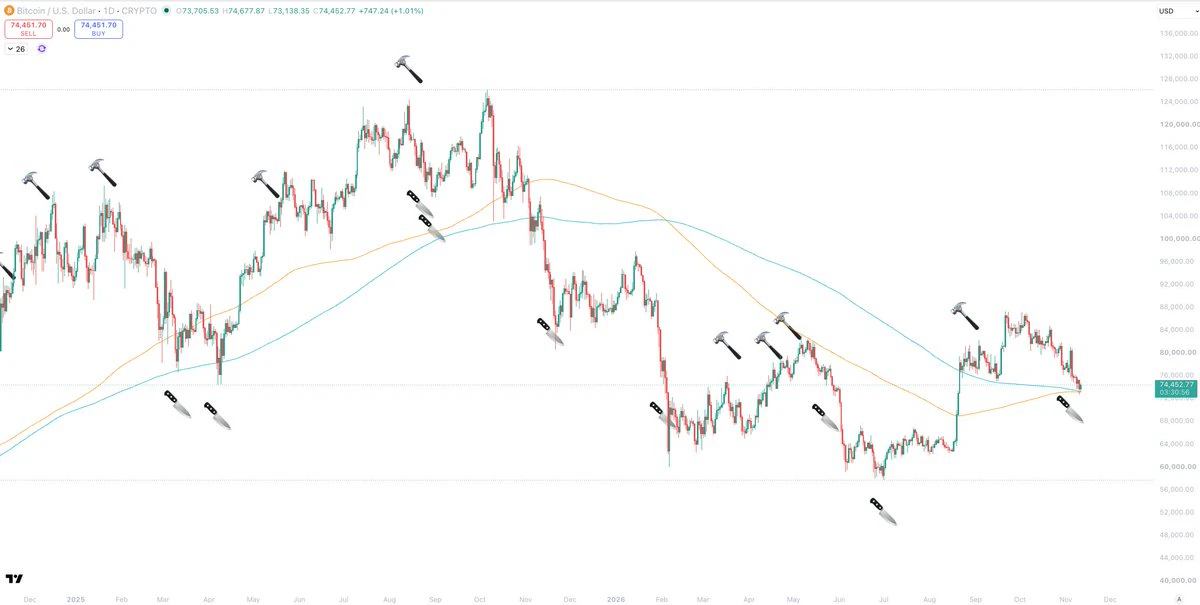
The Syko-meter says bottom is in.
No signal is perfect, but over the last 12 months this indicator has called:
- 8 out of 9 local bottoms
- 7 out of 8 local tops
Sometimes price goes slightly lower/higher after it fires, but it almost always gets very close.
The one false bottom reading was in May this year.
The one false top reading was in April this year.
This recent bottom signal is happening at the 200D + 300D SMA level.
Very strong confluence.
post-image
  • 1
Those haters who were talking trash before should be changing their tune and calling me Daddy again—the profits have gotten so insane that people can only say, “That’s ridiculous.”
Trenches
mihao
m
bade
b
mihao
4Cxj...pump
Market Cap
$.
Change
.
24h Vol
$.
Holders
.
Max
M
bade
b
Max
5qaP...pump
Market Cap
$.
Change
.
24h Vol
$.
Holders
.
AGT
A
bade
b
AGT
0x5d...e274
Market Cap
$.
Change
.
24h Vol
$.
Holders
.
DacityCoin
D
bade
b
DacityCoin
DKYc...pump
Market Cap
$.
Change
.
24h Vol
$.
Holders
.
HOLD
H
bade
b
HOLD
4iJ7...pump
Market Cap
$.
Change
.
24h Vol
$.
Holders
.
With the same 1000 U, the outcome can be worlds apart—$KGEN ’s 22% bullish candle is a revealing indicator. 24h trading volume is 14M, with intense turnover. From a low of 0.0654 to a high of 0.0827, the price range was 26%—that’s not the kind of volume retail traders can generate. Fundamentally, 0.08 sits right at the upper edge of a previous high-concentration cost-basis zone. There’s no sign of whales dumping in bulk on-chain, and the low cost of pushing the price gives major players an incentive to keep driving the market. Technically, the current price of 0.0805 is consolidating near the 2
KGEN-5.46%
  • 4
  • 2
Google said in an official blog post that its veterans network, VetNet, is working with nonprofits, industry partners, and product teams around the world to provide veterans and military families with career paths and grassroots support, helping them transition to civilian life.

Yesterday, you were getting used to orders coming down the chain of command; today, you’re getting used to a mountain of meetings. The shift feels like suddenly switching game maps. At least Google’s VetNet is something like a guide NPC, so people don’t get lost the moment they land.

$BTC
post-image
BTC-0.67%
Nothing beats the X algo
post-image
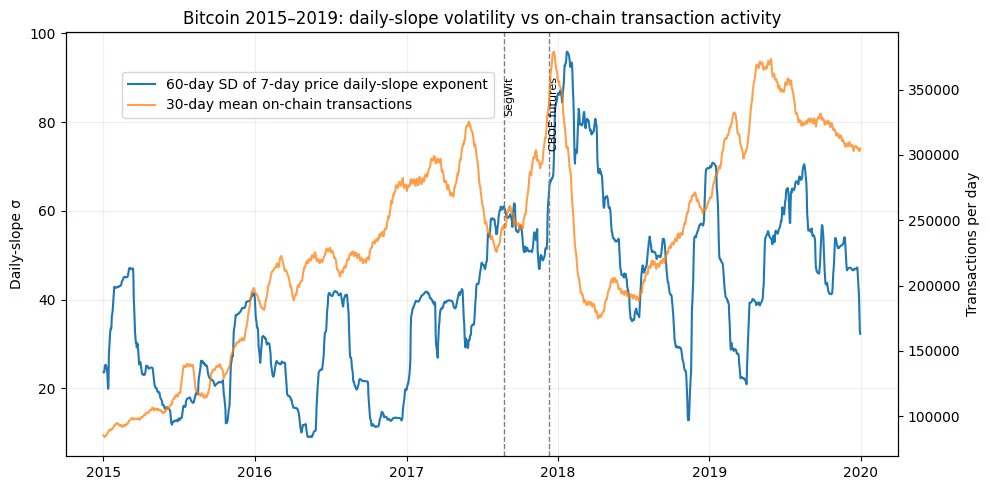
Something remarkable happened to Bitcoin around 2017.
Our latest research at the Scientific Bitcoin Institute reveals a striking coincidence.
On-chain transactions, previously growing according to a power law with an exponent near 4, experienced a dramatic slowdown.
At approximately the same time, the volatility (σ) of Bitcoin's Price Power Law Daily Slope more than doubled between 2016 and 2017.
Two major changes occurring during the same period.
Coincidence, or evidence of a fundamental structural transition in Bitcoin's economic ecosystem?
The emergence of Bitcoin derivatives, institutional
post-image
BTC-0.67%
[New Streamer] Market Updates!
live-cover
LIVE1,236
BTC Technical Outlook: Bitcoin Slips Below $75,500 as Selling Pressure Builds

Bitcoin is showing renewed weakness on the daily chart, with price trading near $74,386 after falling below the important $75,563 support level. Sellers remain in control, while BTC continues to trade below all four major exponential moving averages (EMAs).

The latest decline puts the $71,500 support area in focus. The key question now is whether buyers can defend this region or whether Bitcoin will extend its correction toward the $70,000 and $67,000 levels.

1. EMA Structure: Bearish Momentum Dominates

Current E
BTC-0.67%
  • 2
  • 2
#ShareWeekly Crypto Market Faces Heavy Selling Pressure as Bitcoin Falls Below $74,000

The cryptocurrency market is experiencing significant selling pressure on November 12, 2026, as Bitcoin struggles to recover above $74,000. Bitcoin recently dropped toward $72,700 before recovering slightly, while Ethereum declined toward $2,050. The global crypto market capitalization also weakened to approximately $2.51 trillion.

Several factors are contributing to the downturn, including stronger-than-expected US inflation, rising Treasury yields and institutional ETF outflows. US spot Bitcoin ETFs reco
BTC-0.67%
XRP-1.15%
ETH-1.26%
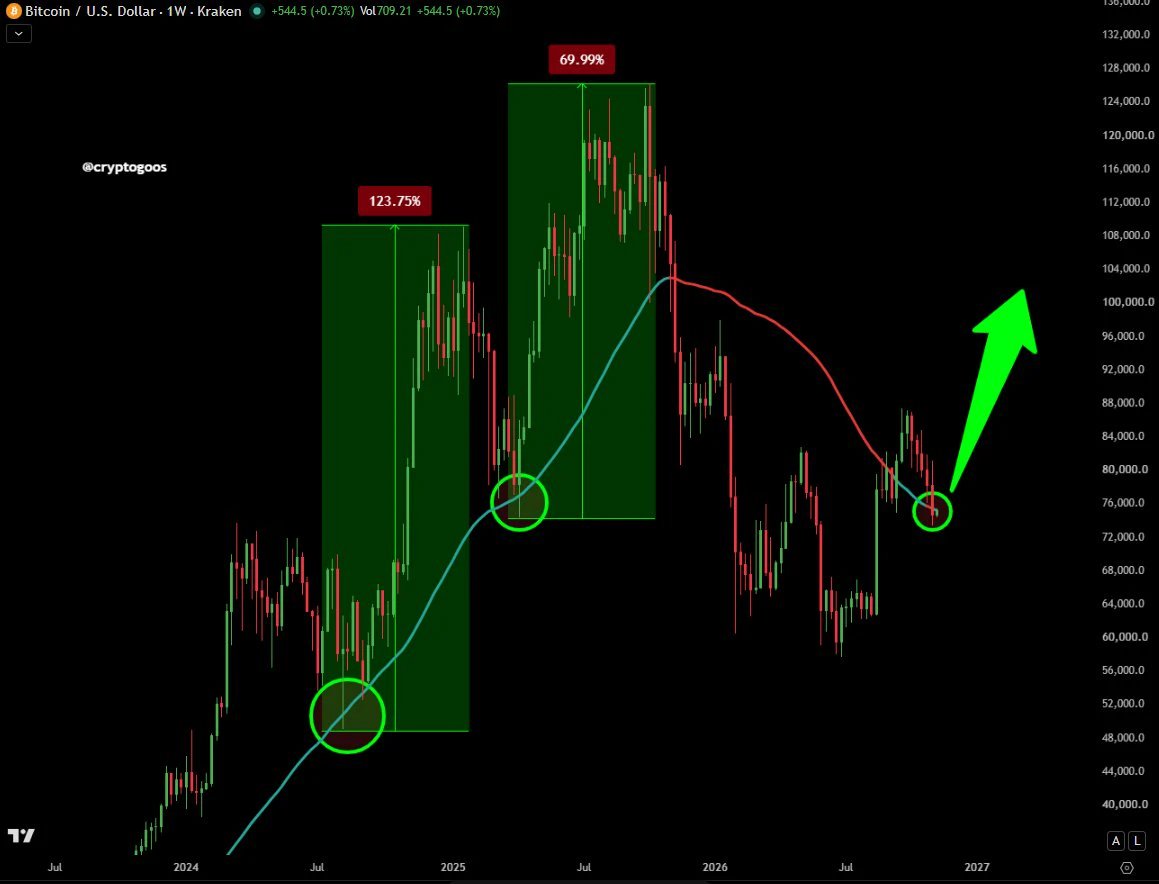
👀 The last two times $BTC briefly dropped below the 50-week moving average during a bull run, it was followed by MASSIVE rallies! 🚀
Could we be witnessing the same setup again?
History doesn't always repeat, but it often rhymes. 📈🔥
Will Bitcoin bulls deliver another explosive move? 👇
post-image
BTC-0.67%
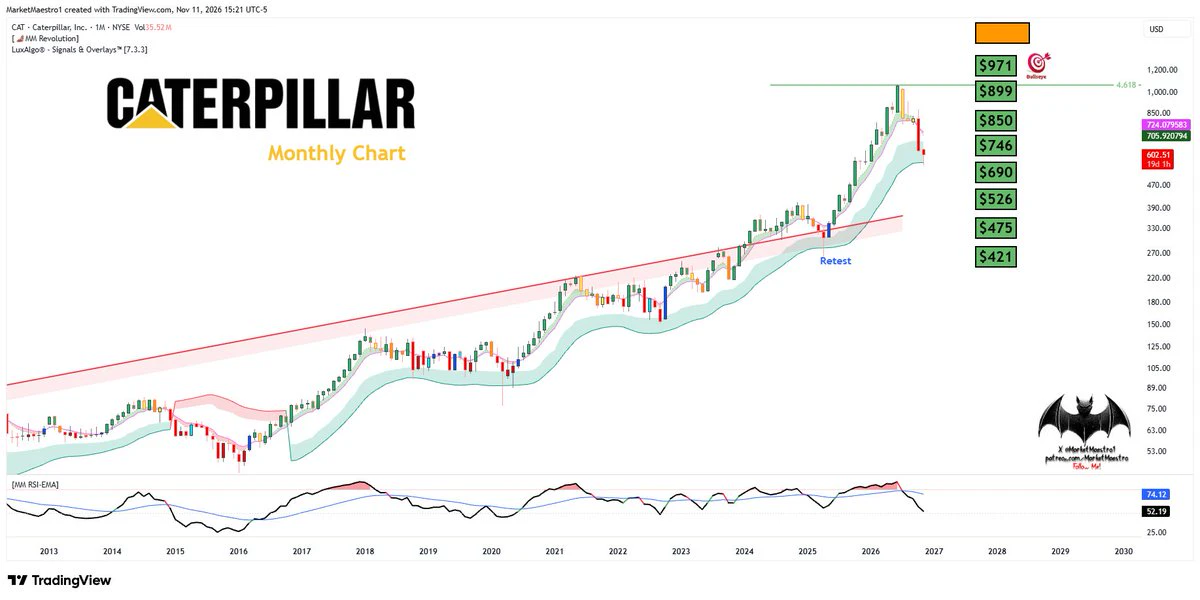
$CAT
It’s at the support band once again
post-image
CAT+2.98%
Leaders at Google, Google Cloud, and Mandiant published an analysis titled “Security 2027” on Google’s official blog. They noted that enterprise software is shifting from static applications to autonomous agents managing core business operations, bringing a fundamental change to cybersecurity, and outlined key defense priorities for 2027.

Companies are handing core operations over to AI agents while asking security teams to figure out how to keep them from going off the rails—like hiring an all-around housekeeper and installing a dashcam on their first day.

$BTC
post-image
BTC-0.67%
$ZHONGJI It’s up 21.91% in a day, and at 88.75, I’d advise you not to rush in and chase it.
The macro picture hasn’t provided a clear direction today. The Fed minutes and nonfarm payrolls are both past their windows, the dollar index is moving sideways, and BTC’s correlation with the Nasdaq has fallen to around 0.3 this week, indicating that external liquidity isn’t driving this move. This rally is being driven by funds already in the market and on-chain activity. 24h trading volume is 55M, which isn’t small for a low-cap asset, but note the range from a low of 72.79 to a high of 89.64: nearly
USIDX+0.67%
BTC-0.67%
NAS100+2.03%
  • 7
  • 1
Register to Draw, Unlock ESP, Shopping Spree Rewards and High-Yield Plans https://www.gate.com/campaigns/6972?ref_type=132&utm_cmp=WaP3F1V2
post-image
ESP-0.04%
Pepe market update
live-cover
LIVE49
Ever notice how everyone gets dead silent when $BTC ‌ dips, but the charts are literally whispering where the move is? Let's talk about this setup.

The Vibe: We are holding that $72.7k floor, and honestly, the sell wall at 85.7% asks looks like pure exit liquidity waiting to get trapped once momentum shifts.

Entry: $74k – $74.5k zone.

Stop-Loss: $71.9k (keep it clean below the wick).

Targets: TP1 at $77.5k, TP2 at $80.5k, and TP3 cooking up to $84.2k.

Don't sleep on this range. What's your play here?
$NVDA ‌#GateIPOAccessAnthropic #USOctoberCPIBeatsExpectations
BTC-0.67%
NVDA+2.99%
  • 2
  • 2
*🇷🇺 Russia opens the door to BITCOIN trading after YEARS of efforts to keep crypto at bay...*

*Starting this month, Russians will apparently be able to trade Bitcoin, Ethereum and USDT via approved platforms.*

*But...*

*•⁠ ⁠Ordinary investors face an annual limit of about $3,630*
*•⁠ ⁠Russia’s largest exchange, the Moscow Exchange, is under U.S. sanctions*
*•⁠ ⁠USDT issuer Tether can freeze tokens linked to sanctioned activities.*

*Russia is embracing crypto… but Washington still holds considerable leverage.*

Source: Reuters / Writer: Samuel
$BTC ‌
post-image
BTC-0.65%
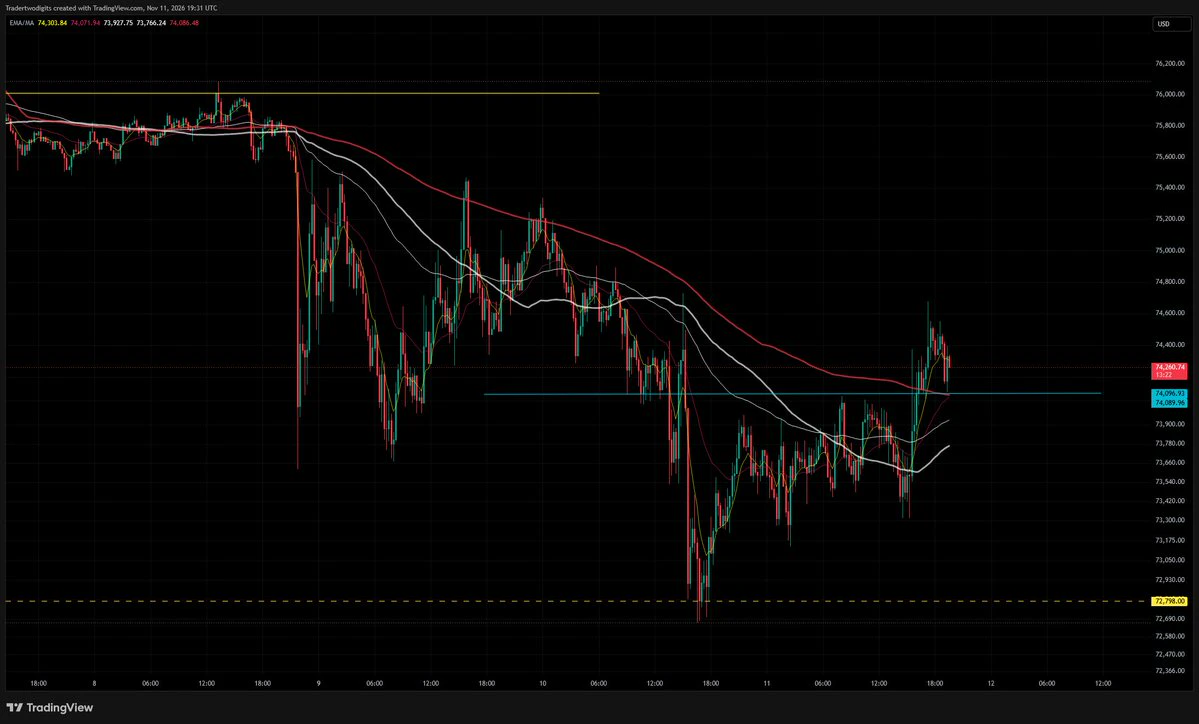
BTC . 74100 LFT S/R, if holds here ->>>> quick gains at 76400+
post-image
BTC-0.67%
  • 1
$ZEC Currently at 1001.66, down 4.91% over 24H. The 1H structure is weak (RSI 49.63), and the 4H structure is even weaker (RSI 10.39), with clearly insufficient rebound momentum. For the short term, watch whether price can hold above resistance at 1063.9; only then is a recovery worth considering. If it breaks below support at 961.07 and fails to reclaim it, weakness may persist. Current volume is just 0.00 times the average of the past 20 candles, so participation is questionable. In the next review, focus on whether price can hold above 1063.9; the setup is invalidated if it breaks below 961
post-image
ZEC+1.16%
The details are so incredibly realistic—I thought it was a photo, but it turns out to be an oil painting.
Load More

Join 40 M users in our growing community

⚡️ Join 40 M users in the crypto craze discussion

💬 Engage with your favorite top creators

👍 See what interests you

Trending Topics

GateIPOAccessAnthropic

6.83k Views1.51k Discussing

Gate IPO Access Phase 3 features Anthropic (ANT), with USDT subscription interest starting from 100 USDT. Successful allocations will be delivered as real shares to Gate Stock Accounts. Indicative price: $70–$78/share Subscription: Nov 12–17 (UTC+8) Allocation is not guaranteed. Please manage risk accordingly. [👉 Subscribe Now](https://www.gate.com/ipos/ipo-access/anthropic-ipo-access/69)

USOctoberCPIBeatsExpectations

107.77k Views2.81k Discussing

GateGlobalComplianceExpansion

25.56k Views421 Discussing

View More