MARKET ALERT - HNT/USDT
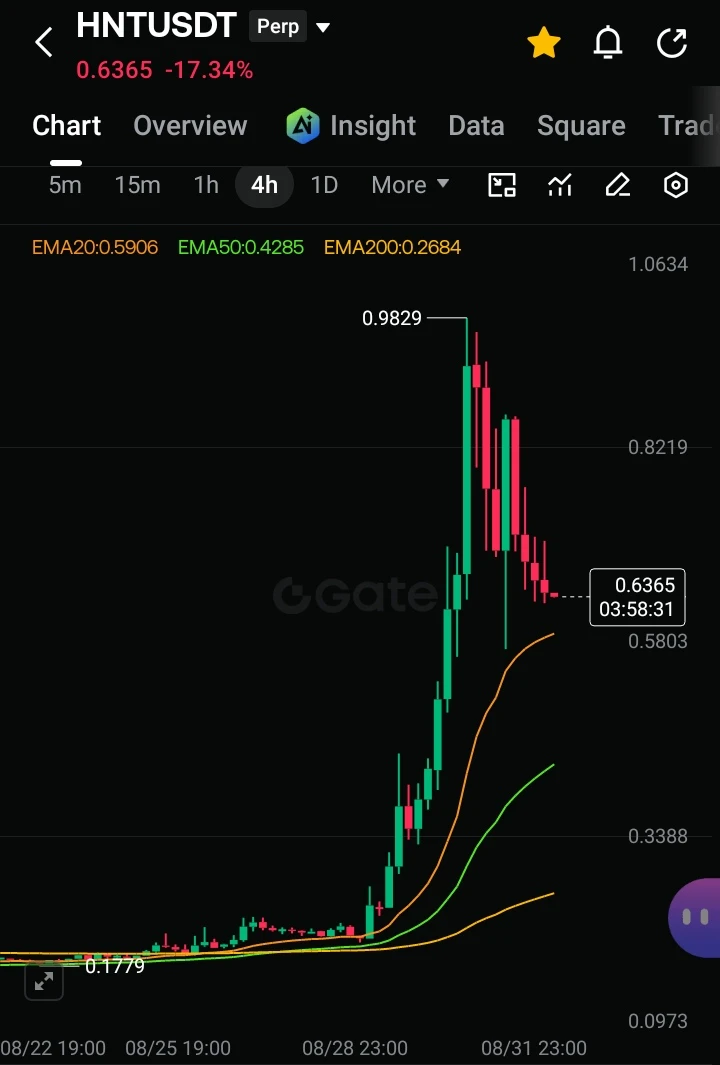
Technical HNTUSDT (timeframes 4H and 1H), the price experienced a sharp correction of around -17% after reaching its peak at 0,9829.
Technical Analysis
Timeframe 4H: The main trend is still upward (bullish), but the price is currently in a retracement/correction phase. The current price (0.6365) is approaching the dynamic support at EMA 20 (0.5906). EMA 50 (0.4285) and EMA 200 (0.2684) are far below, indicating that the previous rise occurred very quickly (pump).
Timeframe 1H: The short-term structure tends to be bearish/consolidating. The price has broken below EMA 20 (0.6758) and is currently testing EMA 50 (0.6389). If EMA 50 1H breaks, a correction toward EMA 20 4H is very likely.
Trading Opportunities & Scenarios
Long Scenario (Buy):
Entry: Wait for confirmation of a bounce (rejection) in the strong support area of 0.5800 - 0.5900 (EMA 20 4H).
Target (TP): 0.7500 to 0.8200.
Stop Loss (SL): Below 0.5500.
Short Scenario (Sell):
Entry: If the 1H candle closes firmly below 0.6300 (breakdown of EMA 50 1H) or if a retest fails to break through the 0.6750 resistance.
Target (TP): 0.5900.
Stop Loss (SL): Above 0.6800.
Note: HNT volatility is very high following the parabolic move.
$HNT