Square
Following
Hot
News
Notifications
Profile

MİSSİNGCANDLES

vip
Candlestick Trader
Peak Tier VIP 55.0 Year(s)Diamond Hands
5
Following
339
Followers
19.1k
Liked
$HK50 Hong Kong 50 ($HK50) Technical Analysis and Market Outlook
Hang Seng Index ($HK50) is moving around 24,637 in current trading, maintaining a positive trend of approximately +1.05% on a daily basis. Despite short-term fluctuations on the chart, buyers’ efforts to remain above certain support zones stand out.
Critical Technical Levels
Resistance Zones: The first strong resistance area is located in the 24,800–25,000 psychological band. If sustained closes occur above this level, upward momentum may accelerate.
Support Levels: In the event of potential pullbacks, the 24,200 level should be
HK50+0.00%
$EURUSD ‌The EUR/USD pair is moving sideways around the 1.14 level. We continue to monitor technical levels for the short-term outlook and potential moves. 📉🇪🇺🇺🇸 #EURUSD #Forex #Trading
The EUR/USD pair continues to move sideways under pressure in the 1.1400 resistance band. Critical technical levels to monitor to meet the reward conditions and provide a detailed analysis:
Resistance Levels
* 1.1420 - 1.1450: The first significant resistance zone. If the price holds above this level, buying could strengthen toward the 1.1500 psychological resistance.
* 1.1530: The breakout point of the
EURUSD+0.00%
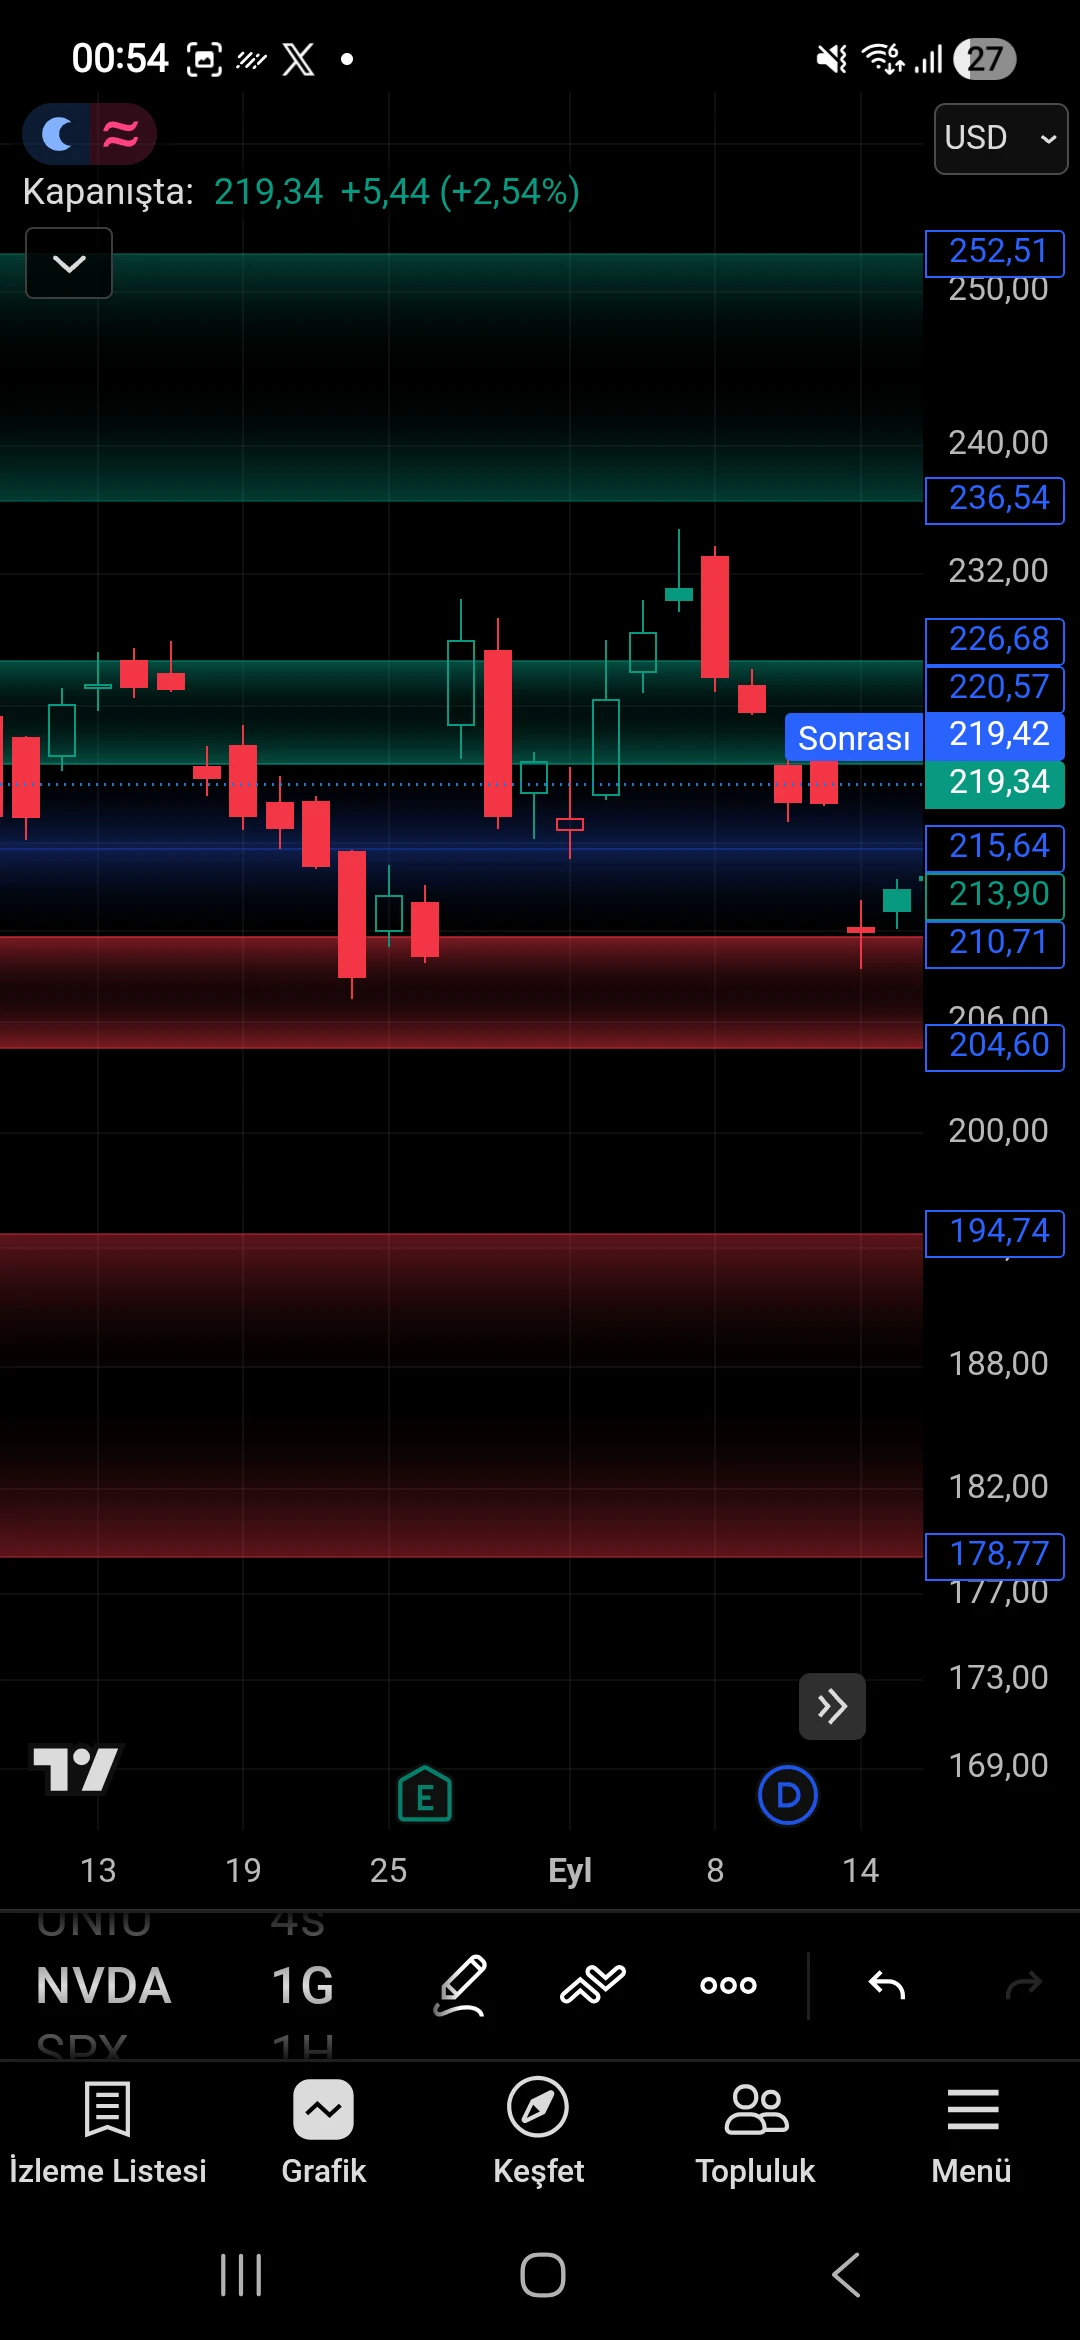
$NVDA The daily (1D) candlestick chart of NVDA (NVIDIA) stock and key support/resistance levels are shown.
​Key Levels and Session Status
​Closing Price: 219.34 USD (+2.54%)
​After-hours: 219.42 USD
​Critical Levels
​Upper Resistances: The 220.57–226.68 USD range is the first significant resistance zone. If this level is breached, 236.54 USD and then 252.51 USD could come into play.
​Lower Supports: The 215.64 USD level currently serves as support. Below it are 213.90 USD and the main support zone at 210.71 USD.
​If pullbacks remain limited, closes above 220.57 USD could strengthen the upward
post-image
NVDA-1.92%
ETH/USD Daily Technical Analysis
ETH wicked into the purple band resistance at $2,650 following a sharp impulse wave and is currently trading around $2,532.
Bullish Scenario: If the $2,649 resistance is broken and a daily candle closes above it, the uptrend may gain momentum.
Correction Scenario: In a potential pullback, the first strong support is $2,379, followed by $2,212. The 1,942 - 1,847 range is a critical support zone for preserving the trend’s main structure.
The purple dashed lines on the chart define the main range boundaries #CoinDeskRevealsGateRWAPerpetualsTop3Globally
ETH-1.26%
  • 1
$GPS #kazandiranislem

GPS LONG

Entry 0.0118 - 0.0118

Target 1: 0.0125$
Target 2: 0.0127$

Stop loss: 0.0114#GateTop4MainstreamCEX
GPS-2.23%
  • 1
  • 1
$REIGN 🚀 REIGN/USDT - Bottomed Out or Just a Relief Bounce?
​Following a massive drop, a sharp reaction from the bottom levels stands out on the chart.
​📊 Key Highlights:
​24h Change: Trading around 0.00006542 USDT with a +94.12% surge.
​Highs & Lows: Rebounded from a 24h low of 0.00003363 to a high of 0.00008398.
​Long-Term Performance: Down over 89% in the last 30 days, the token is now attempting a volume-backed recovery from its bottom zone.
​Order Book Sentiment: Strong buy-side dominance in the order book (93.47%).
​💡 Analysis:
This 90%+ bounce after a prolonged dump could either be a
REIGN+1.84%
  • 10
  • 2
$NAKA NAKA is ON FIRE 🔥
NAKA/USDT: $0.07410 +37.30% in 24h

- 24h High: $0.09
- 30D: +175.19%
- 7D: +39.03%
- Volume pumping: 990.11K NAKA

From $0.02384 to $0.07410... that’s a 3x move 👀
Who’s still holding NAKA?

#NAKA #NakamotoGames #Crypto #Altcoins #Gateio
NAKA-2.50%
  • 3
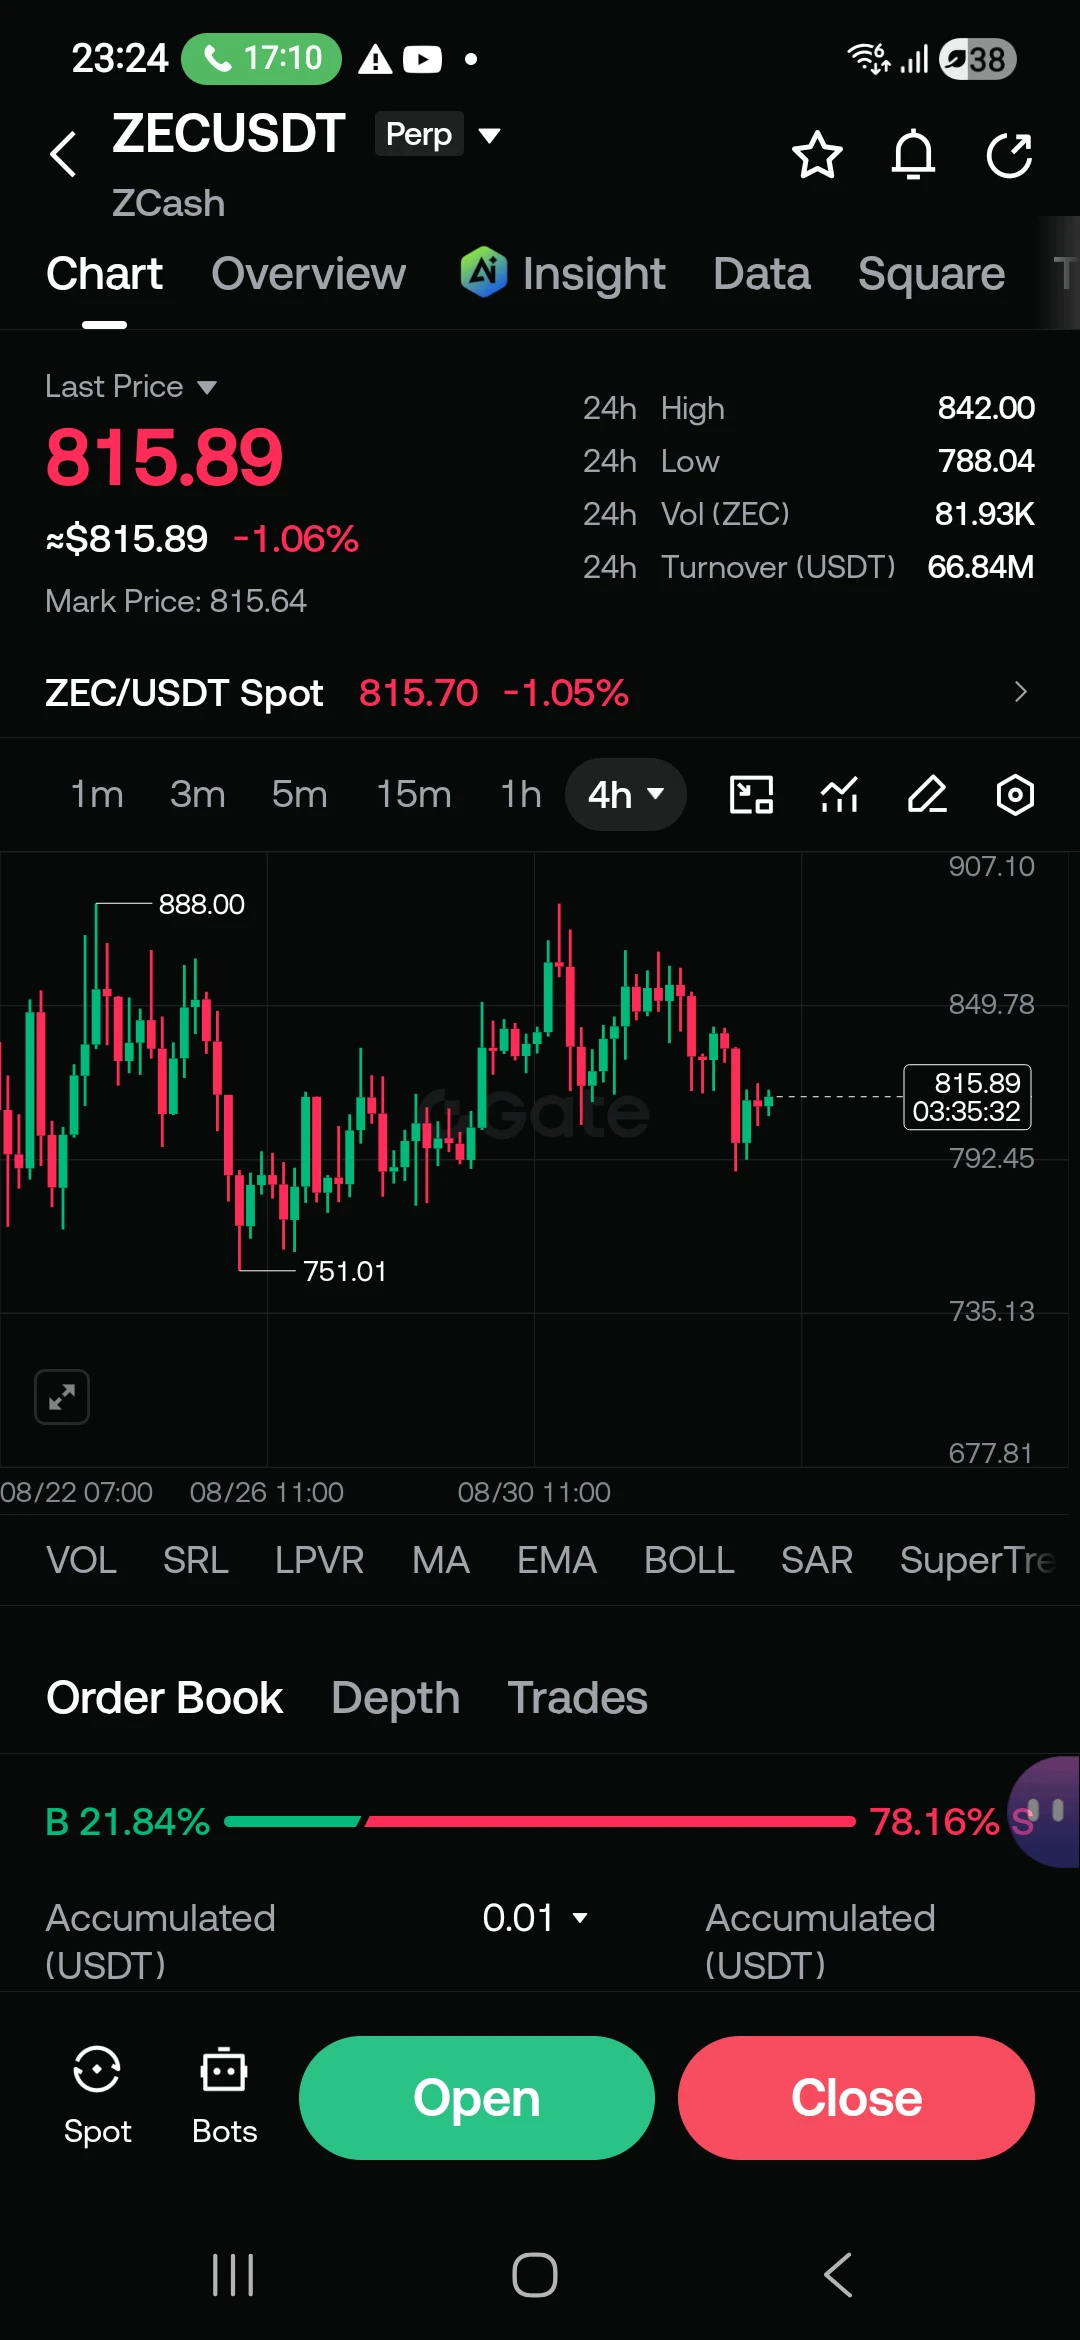
$ZEC ZEC consolidating above $815 after the recent dip to $751.01. The 24h volume reached 81.93K ZEC ($66.84M turnover). Is this the accumulation phase before the next leg up to $842? 🚀 #Zcash #Altcoins #Gate60MillionUsers
post-image
ZEC+1.16%
  • 6
$BTC 🚀 Will BTC Break the "September Curse" on Gate.io? 🚀

Historically, every single time Bitcoin closed August in the green, September closed in the red (4/4 times). With August 2026 just closing up a massive ~25% near $78,500, this historical streak is facing its ultimate test.

📊 Historical Data (Green August vs. September):
• 2013: Aug +30.9% 🟩 | Sep -1.3% 🟥
• 2017: Aug +64.2% 🟩 | Sep -7.9% 🟥
• 2020: Aug +2.7% 🟩 | Sep -7.5% 🟥
• 2021: Aug +13.6% 🟩 | Sep -7.0% 🟥
• 2026: Aug +25.1% 🟩 | Sep: ❓

➡️ Why this time COULD be different:
1️⃣ Institutional Floor: August's rally was back
BTC-0.67%
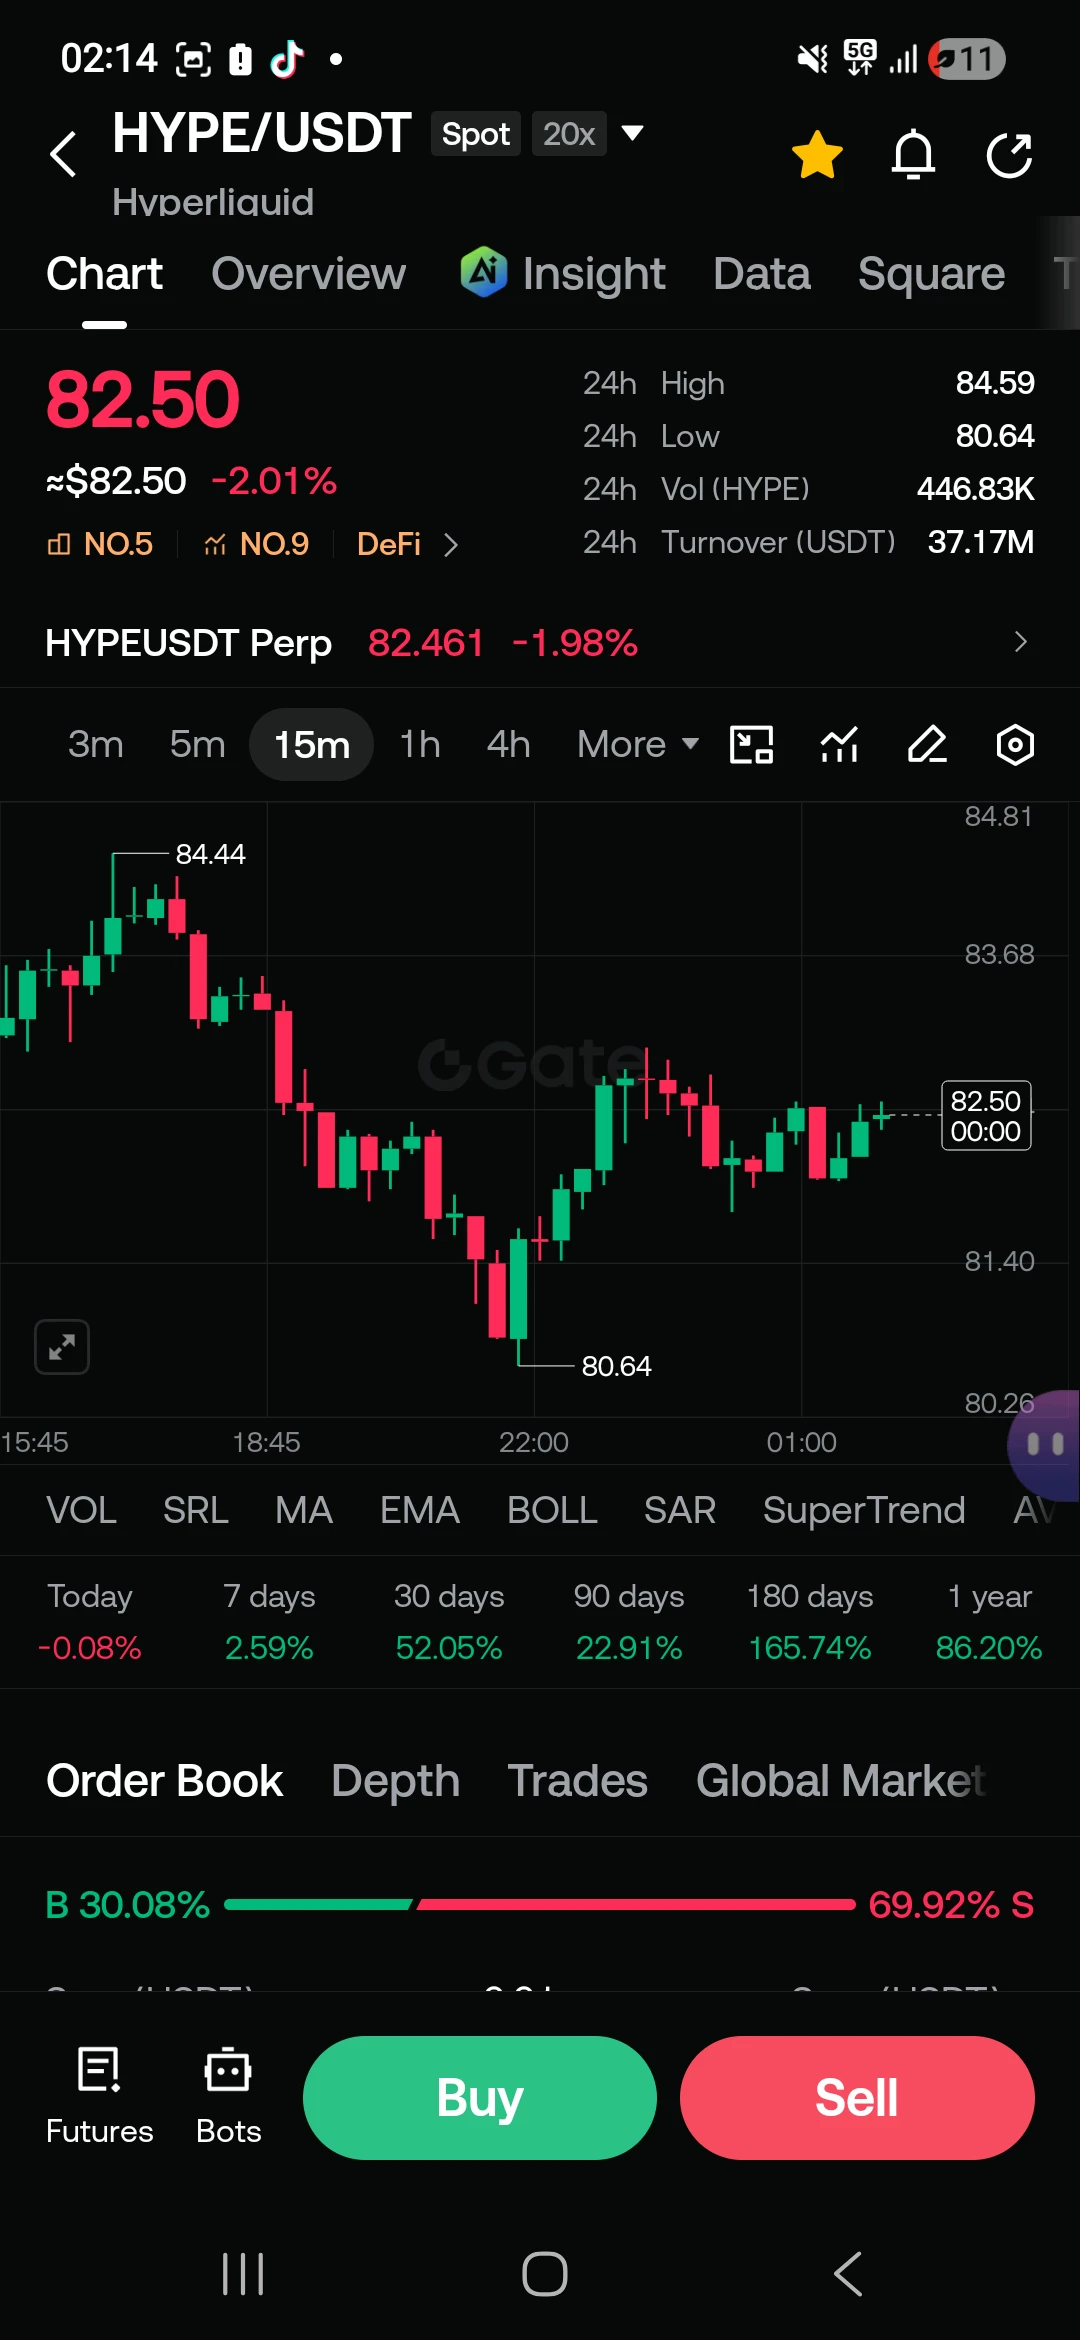
$HYPE Hyperliquid Strategies (PURR) plans to increase the amount of shares it can sell to fund HYPE purchases from $1 billion to $2.5 billion.”#Gate60MillionUsers
post-image
HYPE+0.24%
  • 18
  • 1
GateBlog
Independent privacy narrative market outlook? ZEC rises against the trend, capturing volatility with Gate leveraged ETF
On June 3, ZEC rose against the trend during a market pullback, with a 24-hour gain of 14%. Its market capitalization jumped to over $10 billion and moved into the top 11. The rally was driven by three main catalysts: the SEC closing the case to eliminate regulatory uncertainty, rising momentum behind Grayscale ETF applications, and expectations for the halving. Gate introduced ZEC3L/ZEC3S ETF leveraged tokens, offering a short-term trading tool with no margin and daily rebalancing, suitable for going long/short and for hedging; however, high leverage comes with high risk, so it is recommended to manage exposure cautiously (5–10%).
ZEC3L+3.45%
$FIO $FIO JUST WENT FULL BEAST MODE 🚀

+101% IN 24 HOURS 💥
$0.0005219 → WENT TO $0.0008057 HIGH
115M VOLUME. BUYERS EATING ASKS.

This was dead for 180 days: -94%
Now? +100% TODAY ALONE.

FIO PROTOCOL IS AWAKE.
LOW CAPS ARE BACK.

You watching or buying? 👀
#FIO #ALTSEASON #CRYPTO
FIO-2.00%
  • 8
$BEAT3L BEAT3L/USDT 4H - BEAT3xLona ETF

CURRENT STATUS
- Price: $0.005274 -33.21% 24h
- 24H High: $0.008109
- 24H Low: $0.005000
- 24H Volume: 11.37M BEAT3L
- 24H Turnover: 71.28K USDT
- Net Value: $0.00530876
- Rank: #9 ETF on Gate

4H CHART ANALYSIS
1. Crashed from $0.013619 high on 08/30 → -61% drop
2. Currently testing $0.005000 support level
3. Down -18.74% today, -78.43% this month, -97.71% in 90 days
4. Massive red candles after the spike. No recovery yet

Order Book: 67.93% BUYERS vs 32.06% SELLERS
Buyers dominating but price still falling = weak hands buying the dip

WHAT HAPPENS N
BEAT3L-1.94%
  • 1
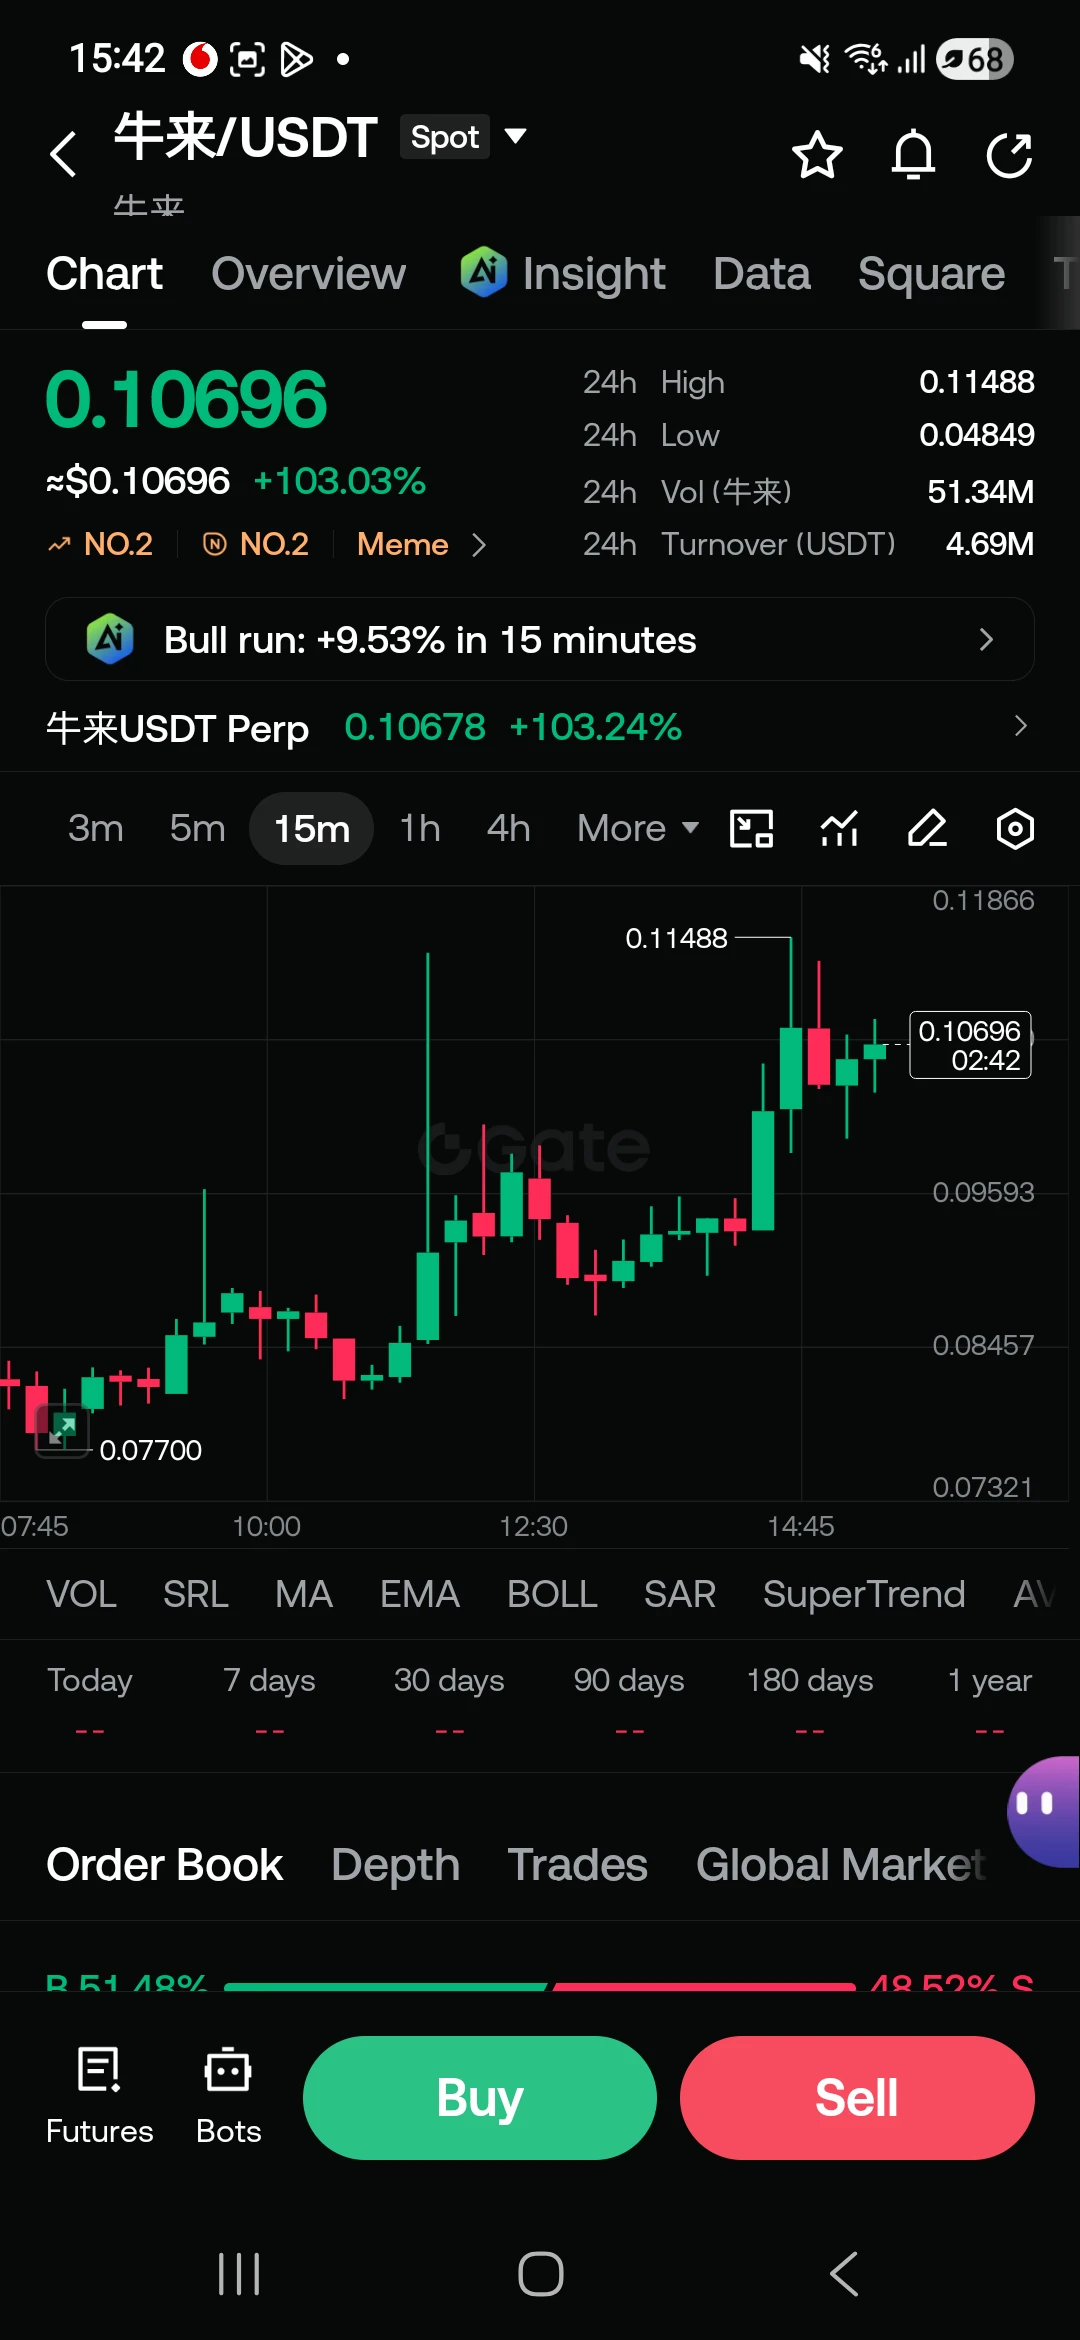
$牛来 NIULA/USDT 15m - Spot

CURRENT STATUS
- Price: $0.10696 +103.03% 24h
- 24H High: $0.11488
- 24H Low: $0.04849
- 24H Volume: 51.34M NIULA
- 24H Turnover: 4.69M USDT
- AI Insight: "Bull run: +9.53% in 15 minutes"
- Rank: #2 Meme on Gate

15m CHART ANALYSIS
1. Massive pump from $0.07700 low → +39% today
2. Pushed hard to $0.11488 24h high
3. Now consolidating around $0.10696
4. Next resistance: $0.11866
5. First support: $0.09593

Order Book: 51.49% BUYERS vs 48.51% SELLERS
Buyers slightly in control

WHAT HAPPENS NEXT?

SCENARIO 1: CONTINUES PUMPING - 60% chance
Break $0.11488 → $0.11866
post-image
牛来-1.82%
  • 7
$ZEC ZECUSDT 4H - ZCash Perp

CURRENT STATUS
- Price: $845.92 +4.59% 24h
- 24H High: $851.24 → $5 away from the top
- 24H Low: $805.44
- Volume: 68.57M USDT
- Order Book: 93.94% SELLERS → watch out! heavy selling pressure

4H CHART ANALYSIS
1. Bounced from $751.01 low → +12.6% up
2. Heading to $888.00 old high. Key resistances at $860.60 and $888.00 ahead
3. Price touching BOLL upper band. Profit taking possible
4. Order Book 94% SELLERS → Big players might be dumping at $850-$860

WHAT HAPPENS NEXT?

SCENARIO 1: BREAKOUT - 45% chance
Break $860.60 → $888.00 → $901.69
Condition: 4H close abov
ZEC+1.16%
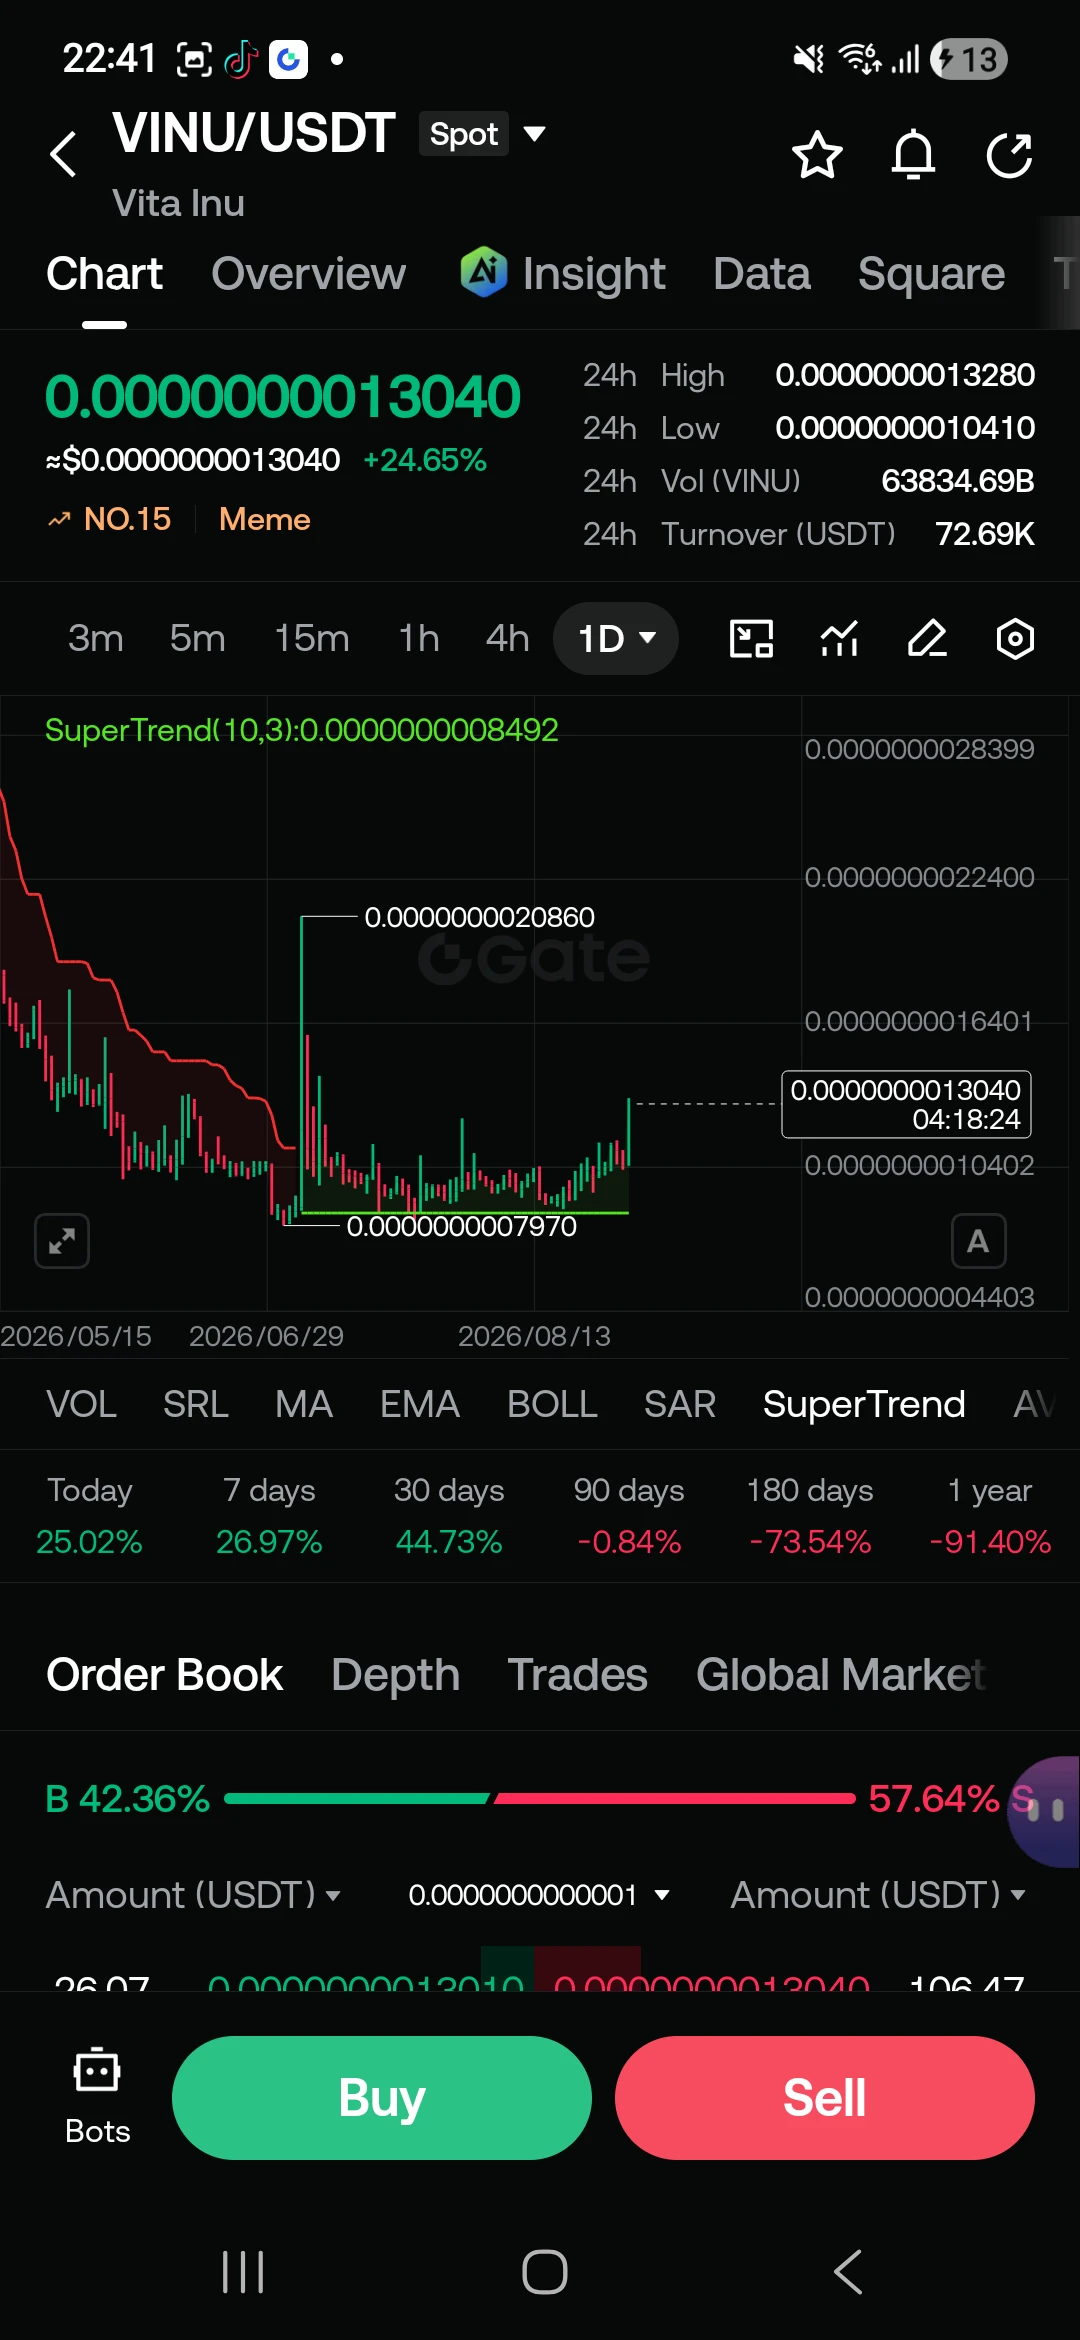
$VINU VINU/USDT +24.65% 🚀
Bounced from 0.0000000007970 to 0.0000013040 in 24h.
Volume: 72.69K USDT. Ranked #15 in Meme category.
30D: +44.73% | 1Y: -91.40%

Is the meme season coming back? 👀
Not financial advice.

#VINU #GateIO #MemeCoin #Crypto
post-image
VINU-2.60%
  • 1
$LVVA LVVA woke up lmao 😂
+30% in 1 day
Bottom 32 → Top 66
Casino table is open again
Volume 24K... whisper volume
LVVA-1.33%
  • 1
Load More