Square
Following
Hot
News
Profile
Share your thoughts
placeholder
Article
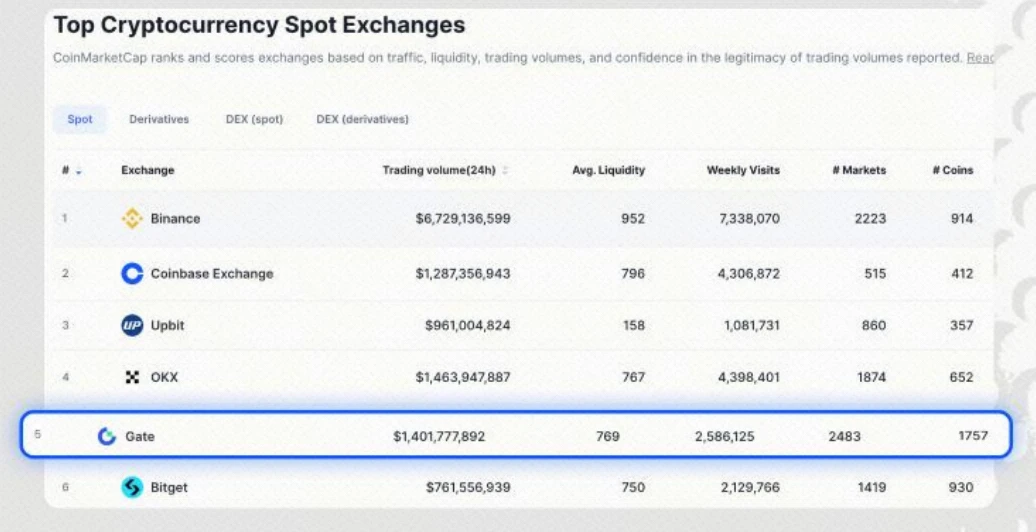
🏆 More than one Top 2: Gate ranks among the global leaders across multiple sectors
From Crypto trading to stock derivatives and prediction markets, competition among global exchanges is entering a more diversified phase.
Several data points in Gate’s latest global rankings report are worth noting:
💰 30-day net inflows exceeded $199 million, global Top 2
📈 Overall spot market strength, global Top 2
🎯 Notional trading volume in prediction markets, global Top 2
🔥 Stock derivatives exchange ranking, industry Top 3
From fund flows to multi-asset trading, Gate is expanding into a wider range of
GateSquare
🏆 More than one Top 2: Gate ranks among the global leaders across multiple sectors
From Crypto trading to stock derivatives and prediction markets, competition among global exchanges is entering a more diversified phase.
Several data points in Gate’s latest global rankings report are worth noting:
💰 30-day net inflows exceeded $199 million, global Top 2
📈 Overall spot market strength, global Top 2
🎯 Notional trading volume in prediction markets, global Top 2
🔥 Stock derivatives exchange ranking, industry Top 3
From fund flows to multi-asset trading, Gate is expanding into a wider range of trading scenarios.
But for traders, rankings are one thing; the actual experience is another.
💬 If you could choose just one metric to measure an exchange’s competitiveness, which would you value most: liquidity and execution efficiency, a diverse range of trading products, or fund security and transparency?
Bring #Gate多项排名全球Top2 to Gate Square to share your trading experience and market observations.
Rankings show the data, but users are the ones who ultimately test true competitiveness.
repost-content-media
🔥 WHICH #MEMECOIN HAS THE STRONGEST COMMUNITY? 👀
🐸 $PEPE
🐶 #BabyDoge
🐺 $FLOKI
If you had to pick ONE community to stand behind, which would it be? 👇
Drop your vote and tell us what makes that community special! 🚀
#Crypto #Memecoins
post-image
MEME-0.94%
PEPE+0.97%
BABYDOGE-1.56%
FLOKI-0.82%
Trenches
ZIG
Z
bade
b
ZIG
0x8c...1145
Market Cap
$
Change
.
24h Vol
$.
Holders
.
STONK
S
bade
b
STONK
6GmA...UNgx
Market Cap
$.
Change
.
24h Vol
$.
Holders
.
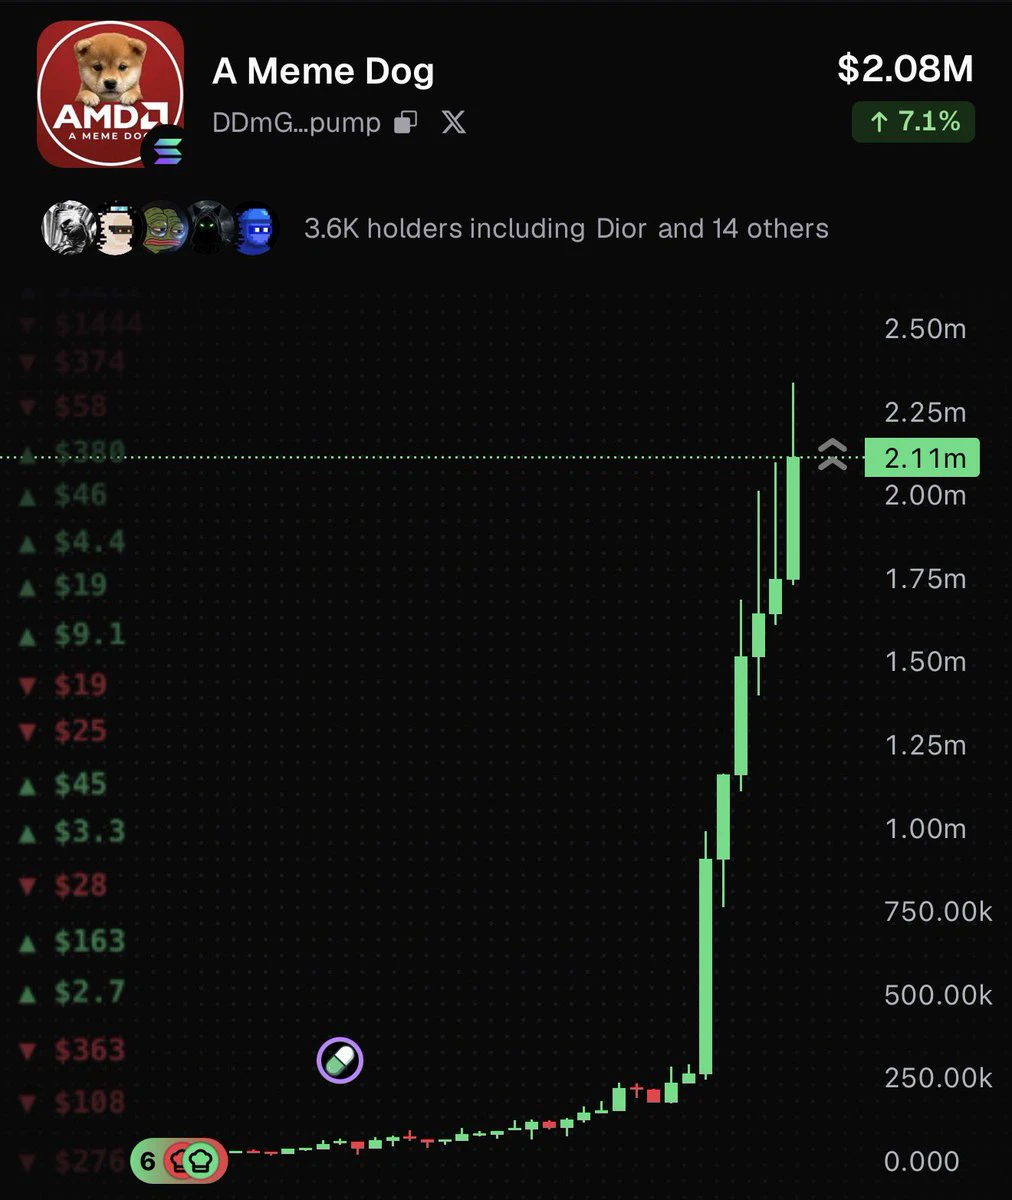
AMD
A
bade
b
AMD
DDmG...pump
Market Cap
$.
Change
.
24h Vol
$.
Holders
.
AGT
A
bade
b
AGT
0x5d...e274
Market Cap
$.
Change
.
24h Vol
$.
Holders
.
CHOO
C
bade
b
CHOO
EJAx...pump
Market Cap
$.
Change
.
24h Vol
$.
Holders
.
There has only ever been one truth about trading:
The 80/20 rule is eternal.

Most people struggle in a cycle of losses;
a few accumulate wealth on the path of compound growth.

A difficult market is never an excuse—
Rather than complain about the winds, sharpen your own blade.

When you are capable enough,
the market will give you the answer.
#巴西交易所遭4600万美元盗币
This is the first time I've seen a coin run past $1m in the last week.
post-image
Anthropic rakes in $33.2 billion in revenue in just nine months! Growth is astonishing, yet losses r
live-cover
LIVE37
#GateRanksTop2AcrossMultipleCategories
Market Update: Exchange Metrics and Platform Rankings
Recent global ranking data reveals current trends in cryptocurrency exchange performance. Gate has secured top positions across multiple categories, reflecting significant user activity and capital allocation.
Based on the latest figures:
Gate ranks second globally in 30-day net inflows, exceeding 199 million dollars.
The platform holds the second position in both spot trading and prediction markets.
It ranks third in stock derivatives.
Gate is now sixth globally by total assets, reaching 7.266 billio
post-image
  • 6
Usually, when fear spreads, people run toward gold.
This time it went the other way. On Friday gold fell to its lowest level in a year, around $3,870. A month ago it was $4,218.
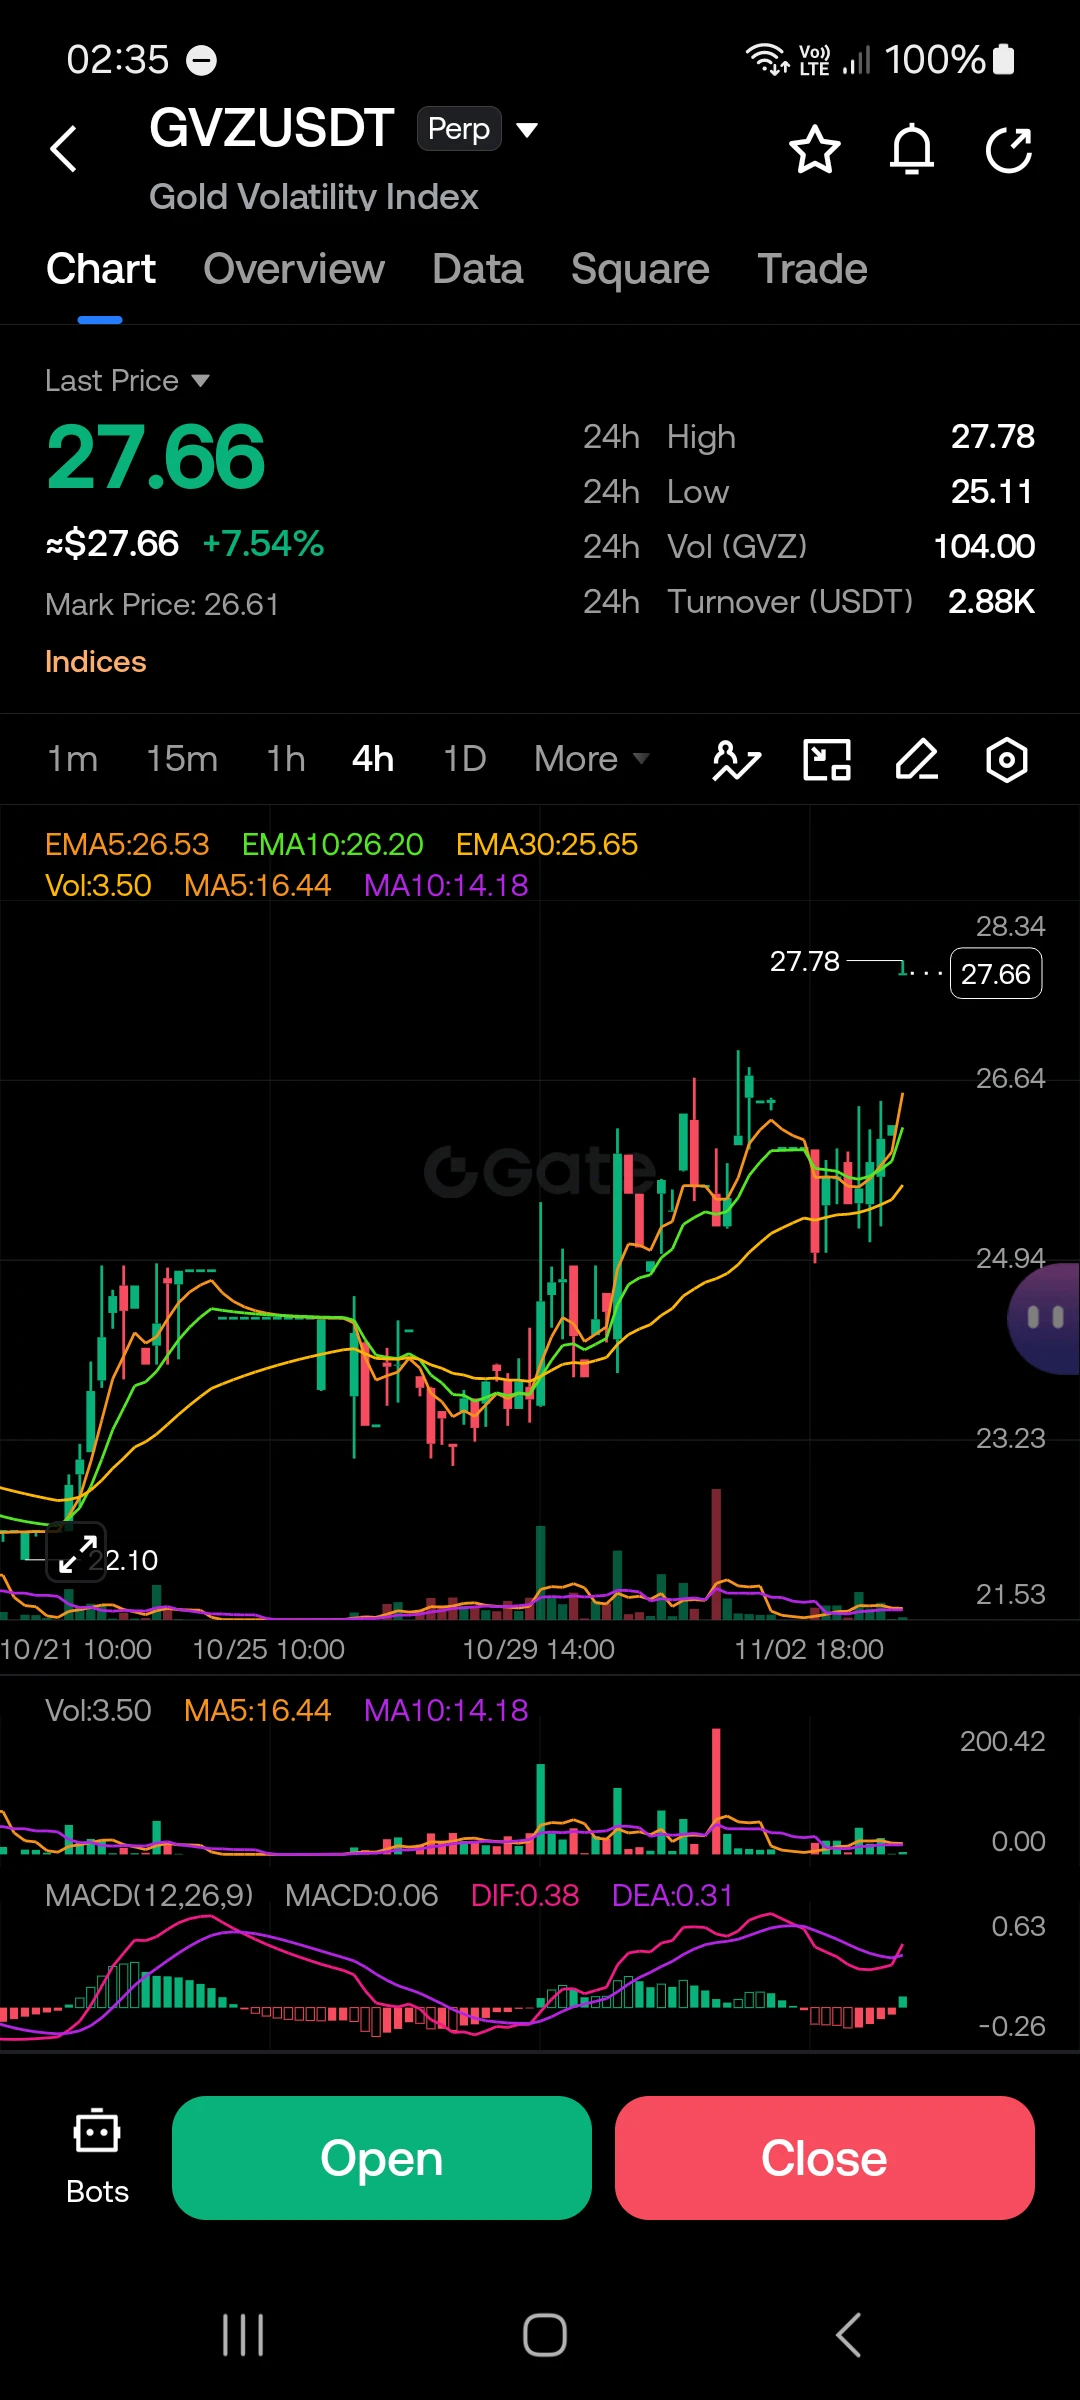
That same day, $GVZ , the market's fear gauge for gold, jumped 15% in a single day, from 22.73 to 26.15. This number doesn't say which way gold will go. It only says the expectation of big swings has risen.
My read is that this fear is not about missing out on gold. It's about losing it. If people expect interest rates to rise, gold, which pays no interest, becomes less attractive. Even on election day gold didn't rise
post-image
GVZ+2.87%
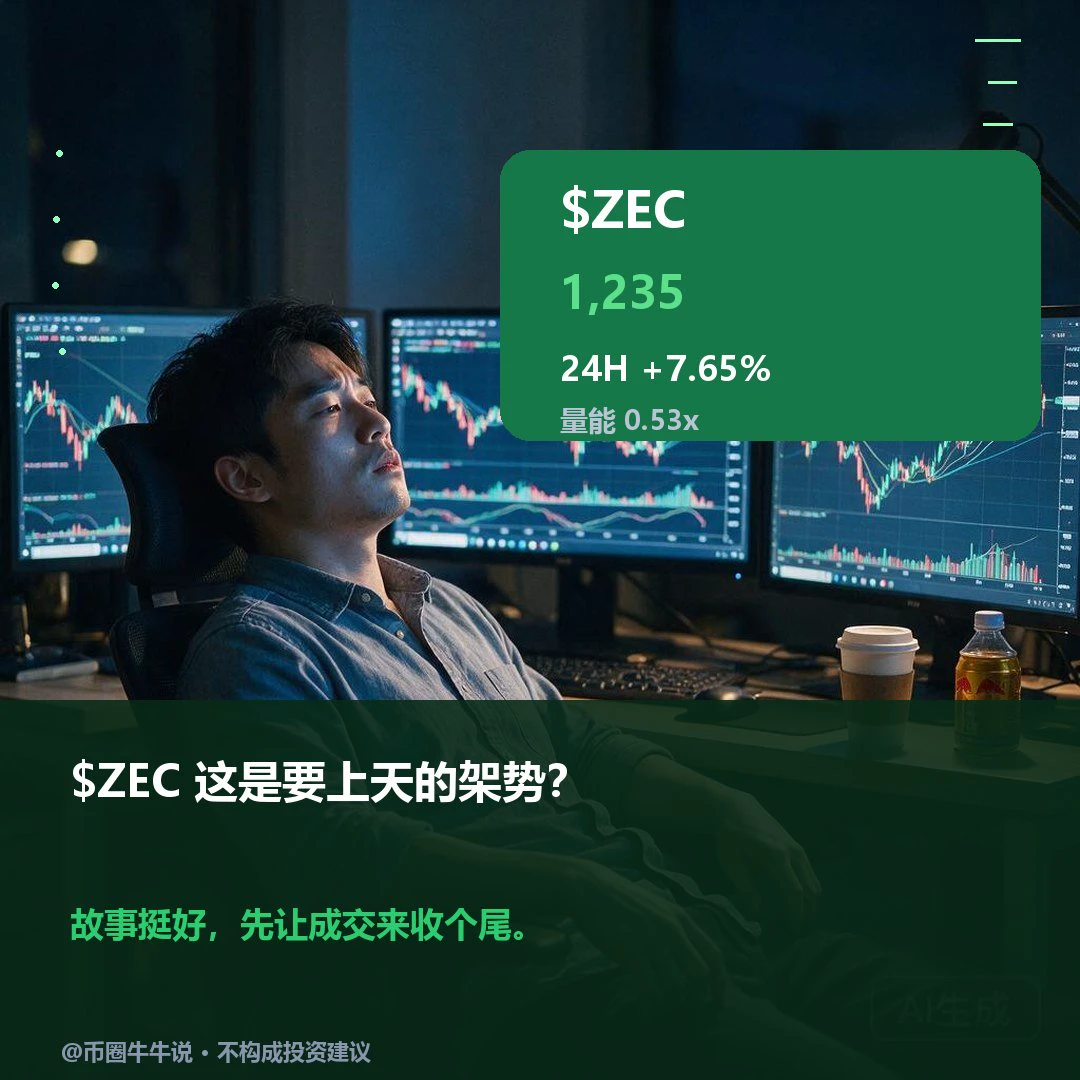
$ZEC Currently at 1235.09, up 7.65% over 24H (1121.6–1245.0). 1H is strong (RSI 77.4, volume 0.53x), while 4H is strong (RSI 49.5) with momentum converging. If it holds above the 1245.0 resistance, watch for continued upside; if it breaks below the 1121.6 support, it may weaken in the short term. The key point to check in the next review is whether it can hold above 1245.0. The outlook is invalidated if it breaks below 1121.6 and fails to recover. Market volatility is high; for observation only.
post-image
ZEC+1.16%
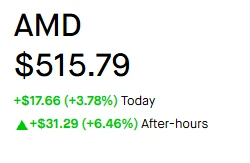
$AMD 😍
AMD Non-GAAP EPS of $2.09 beats by $0.15, revenue of $13.38B beats by $290M
Nov 03, 2026
Q3 Non-GAAP EPS of $2.09 beats by $0.15.
Revenue of $13.38B (+44.6% Y/Y) beats by $290M.
“We delivered a record quarter with revenue exceeding the high end of our guidance as Data Center segment sales nearly doubled year-over-year,” said Dr. Lisa Su, AMD chair and CEO. “Demand for our Instinct and EPYC products continued to strengthen, and we expect growth to accelerate further in the fourth quarter as we scale Helios and ‘Venice’ production. With our leadership product portfolio and deep customer
post-image
AMD+3.79%
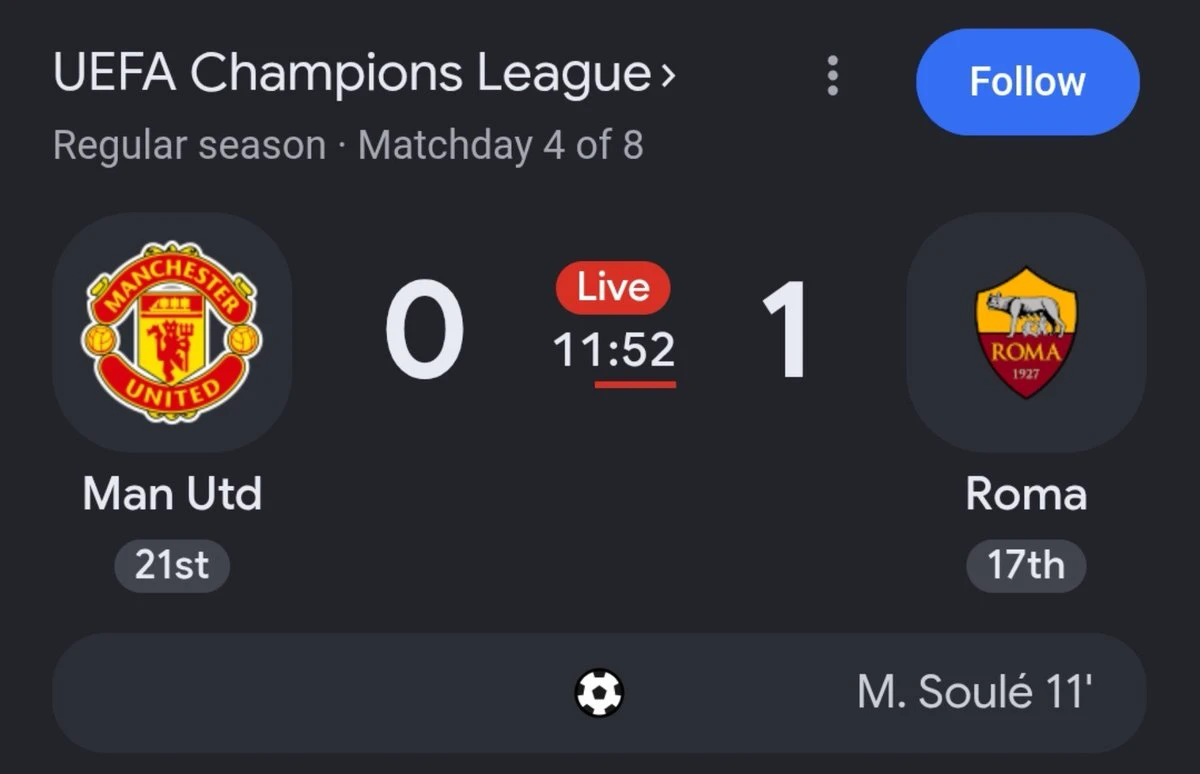
So sad hearing about the death of Jesús de Miguel, a Tenerife player who collided with the Andorra, Owono, goalkeeper yesterday.
Sending comfort to his family and love ones. This is so tragic to hear!
post-image
Crypto Market update
live-cover
LIVE60
Just see how God dey answer my prayers ☺️☺️☺️☺️☺️
post-image
It simply won't stop.
Jupiter Lend, Solana's largest lender with $931.3M in active loans, took in more than $4.72M in fees in October, its fourth straight record month.
That is more than $152,000 a day.
@JupiterExchange
JUP-1.73%
SOL-0.77%
🚀 THE SEARCH FOR THE NEXT 500X GEM IS ON! 💎🔥
Big opportunities are out there. The question is, which project has the potential to deliver life-changing gains?
Drop your top pick below! 👇
#Crypto #Altcoins #Altseason2026
post-image
ON+4.77%
LG CNS, the LG Group IT firm with 6.13 trillion won in 2025 sales, is joining Injective's Hacker House in Bangkok.
It recently ran a trade finance PoC on Injective with POSCO International, Korea's largest trading company.
@injective
LG CNS-5.00%
LG-3.66%
INJ-1.67%
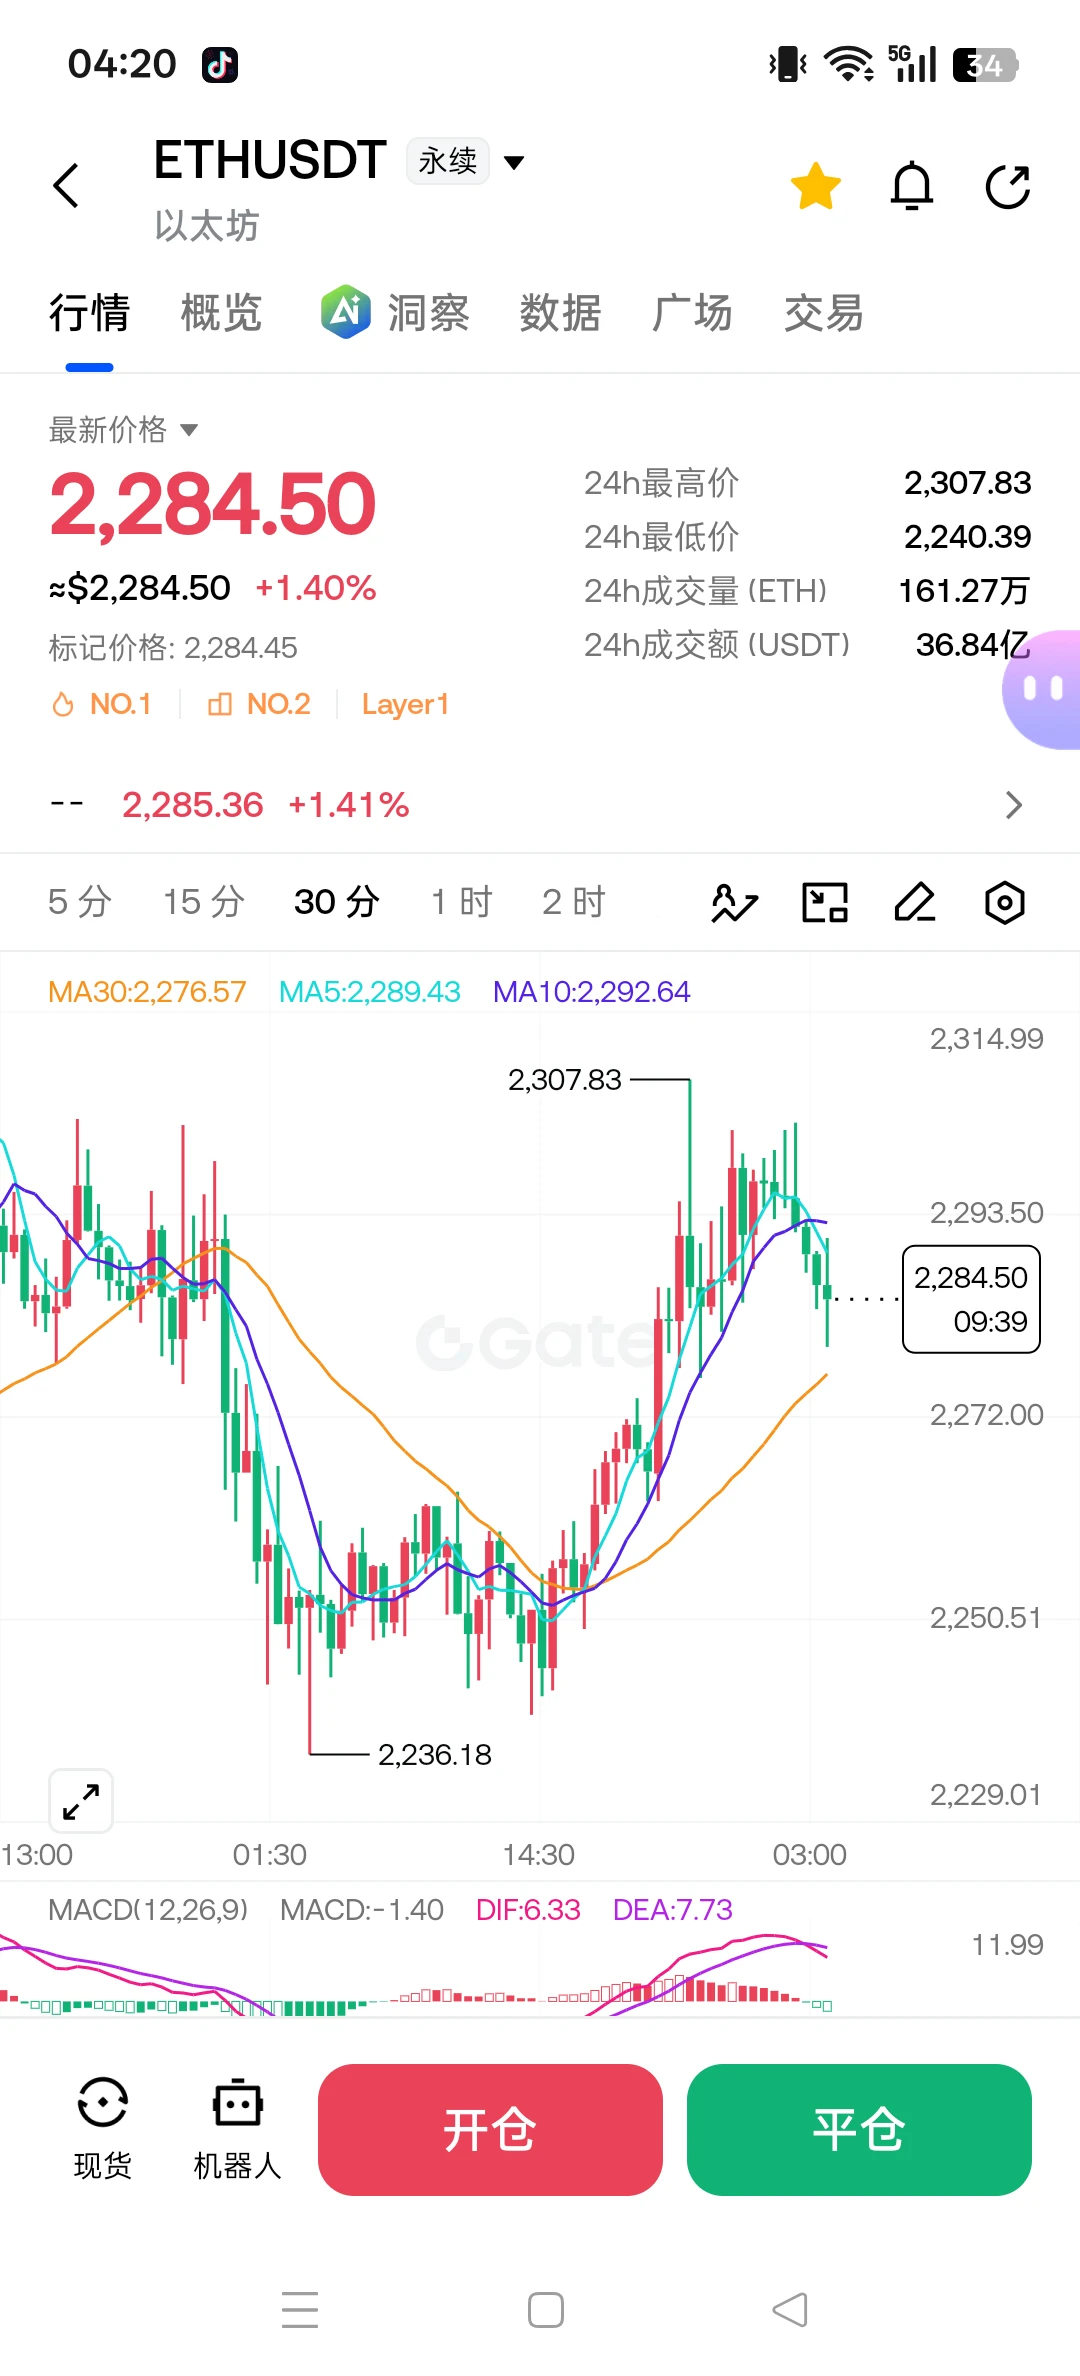
Looking back at this trade outside my system: it was a hedge I put on the day before yesterday. I brought the average entry down from 2296 to 2262. That night, the price had clearly broken down, so I took profit on the short. The long was also supposed to be closed in profit, with a take-profit order at 2266, but I ignored the chart and kept a core long position open before going to sleep. In the morning, I got another chance to exit, but didn’t take it. Then the price moved sideways all day. Since the higher timeframes were all bearish, I was worried it would break down further, so I opened a
post-image
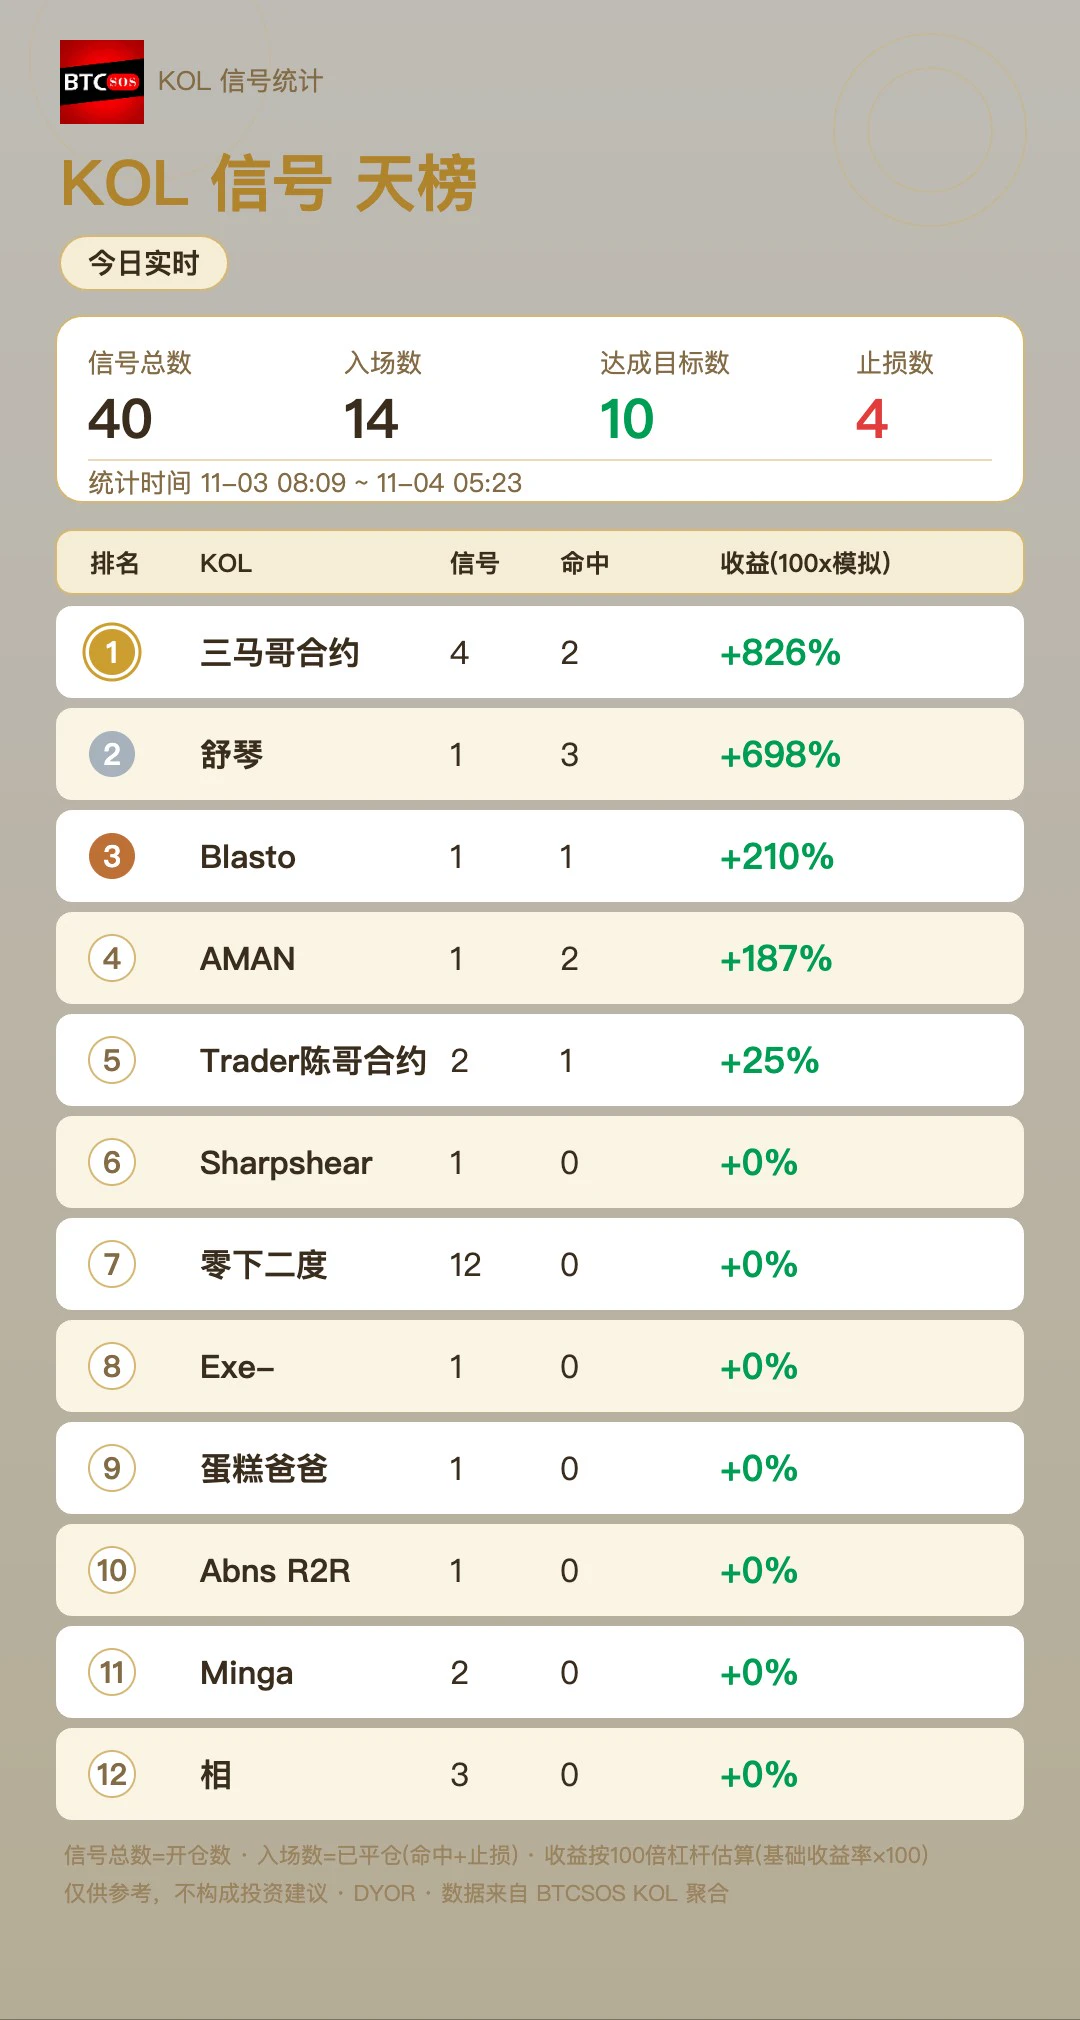
【Today's KOL Performance Leaderboard】btcsos Signal Flow had 40 signals in total, with 14 trades settled (10 hits / 4 stop-losses). The top-ranked San Ma Ge Futures settled 2 trades, hitting both, for simulated returns of +826%. See the image for the full leaderboard; data is updated in real time from the KOL Signal Flow. Incidentally, San Ma Ge Futures also topped the previous period (11-04) with +826%, making it back-to-back 👀#xrp
post-image
XRP-1.12%
$SPX nicely forming a bottom during the last few weeks 🤝🏻
Time to send it higher 🫴🏼
$SPX6900
SPX+0.33%
#WCTCS9 #BTC #ShareWeekly
BTC Market Analysis: Holding 76K and Waiting for Confirmation of a Breakout Above 78.4K
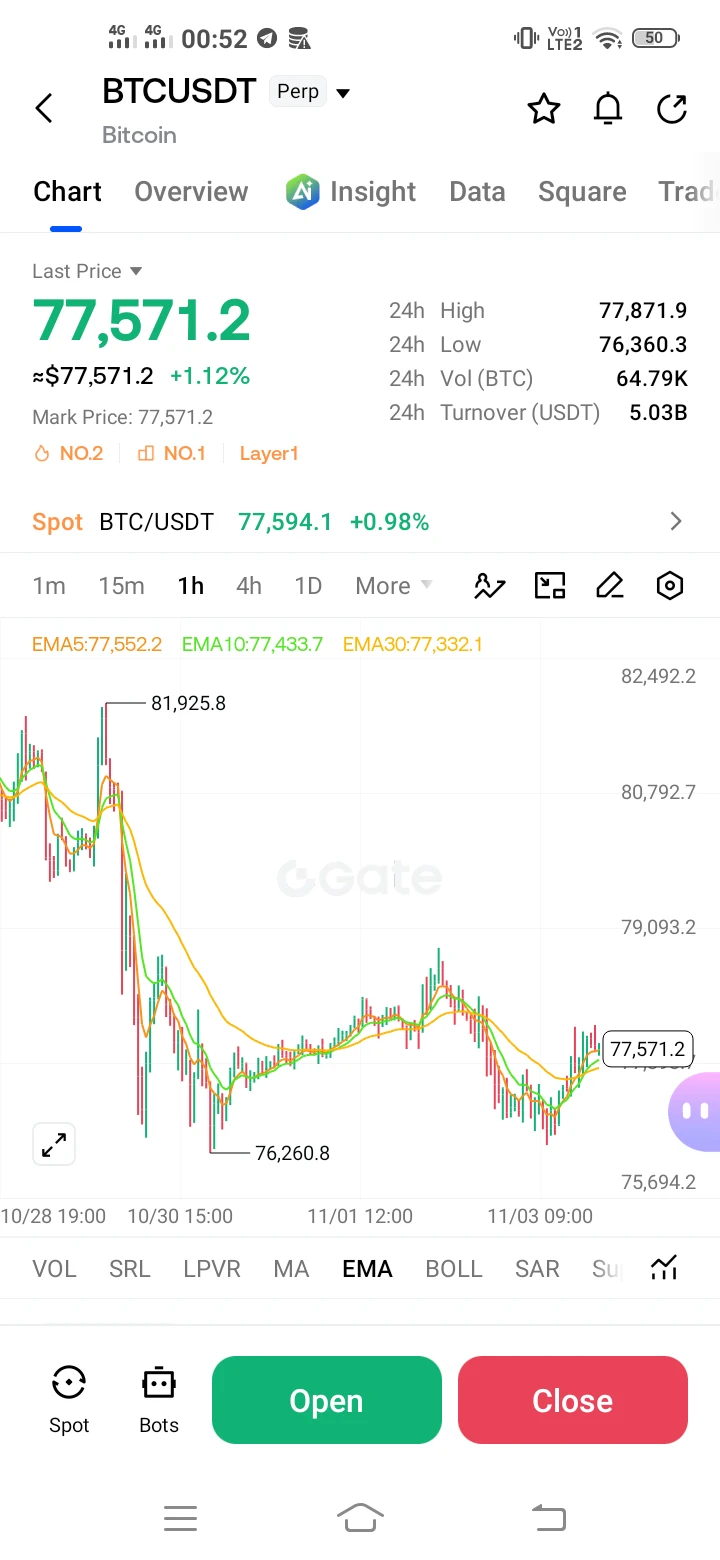
Bitcoin is trading at around 77,500 USDT on Gate’s spot market, up about 0.9% from the previous day’s close of 76,806.6, and ranging between 76,387 and 77,894 today. The broader picture remains cautious. Since early October, BTC has been making lower highs, moving from the 87,200 area on October 2 to 84,900 in late October, then 81,965 on October 29, and finally 78,860 on November 2. The price was rejected at each of these levels. The 76,000–76,400 range has held several times, in
HighAmbition
#WCTCS9 #BTC #ShareWeekly
BTC Market Analysis: Holding the 76K Floor, Waiting for Confirmation Above 78.4K
Bitcoin is trading around 77,500 USDT on Gate spot, up roughly 0.9% from the previous daily close of 76,806.6, with today's intraday range between 76,387 and 77,894. The bigger picture is still cautious. Since early October, BTC has been making lower highs, moving from the 87,200 area on October 2 to 84,900 in late October, then 81,965 on October 29, and finally 78,860 on November 2. Price has been rejected at each of those levels. The 76,000 to 76,400 zone has held several times, including the October 30 low at 76,283 and today's low near 76,387, so the market is building a base, but it has not yet shown a clear trend reversal.
The daily indicators reflect that mixed picture. RSI sits near 35, which is close to oversold but does not signal a bottom by itself. MACD remains negative, and the short-term moving averages are stacked against the price: the 7-day EMA is around 78,370 and the 30-day EMA around 80,600, both above current price. The 200-day moving average near 73,200 and the 120-day near 74,500 are well below, which means the long-term structure is still intact even though the short-term momentum is weak. ADX is around 19, which suggests the trend is not strong in either direction. Directional readings also favor sellers for now, with the minus directional indicator well above the plus indicator. Put simply, BTC is in a range-building or pullback phase, not yet a confirmed uptrend.
Key support levels to watch are 76,300 to 76,400 as the first line, where recent wicks have been bought; 75,000 to 75,650, the September 15 low and close area and a stronger demand zone; and 74,500 to 74,000, where the 120-day and 200-day averages sit. A daily close below 74,000 would weaken the bullish case considerably and open room toward the low 73,000s.
Key resistance levels are 78,000 to 78,400, which includes the 7-day EMA and the November 1 high, and this is the first real test for bulls; 78,860 to 79,000, the November 2 high, where sellers have been active; 80,600 to 80,800, which combines the 30-day EMA and the Bollinger middle band and is the key level for trend change; and 81,300 to 82,000, the late October breakdown zone. Above that, 84,900 is the October swing high.
On the 1-day chart, the pattern is a lower-high sequence inside a broader range between roughly 76,000 and 87,000. A breakout above 78,400 with a daily close, followed by a reclaim of 80,600, would be the first real sign that buyers are taking control. Until then, the chart favors range trading.
On the 3-day view, which is built from the same daily data, the structure is still a rebound inside a larger correction. For the trend to be called up on a 3-day basis, price needs to close above roughly 80,600 and hold above 78,000 on pullbacks. A failure to reclaim 80,600 keeps the range intact, and a loss of 76,000 would shift the 3-day structure back toward a deeper test.
Here is a possible trading framework, not a recommendation. For a conservative long, the entry zone is 76,400 to 76,900, only after the price holds the support rather than chasing a green candle. Stop loss 1 (SL1) is 75,900, just below the 76,000 floor. Stop loss 2 (SL2) is 75,000, below the September low zone. Stop loss 3 (SL3) is 74,300, below the 120-day average, which would signal the broader structure has failed. Take profit 1 (TP1) is 78,400, where the 7-day EMA and prior resistance meet. Take profit 2 (TP2) is 80,600, the main trend-change level. Take profit 3 (TP3) is 82,000, the area of the late October breakdown.
Position sizing matters more than the exact entry. Risking no more than 1 to 2 percent of trading capital per idea, and scaling out at TP1 to reduce exposure, keeps a single wrong call from doing lasting damage. Avoid buying into resistance near 78,000 to 78,400 without confirmation, and avoid adding to a losing long below 76,000.
On timing, a realistic timeframe for the bullish case to play out is a few weeks rather than days. If price holds 76,000 and reclaims 78,400 with volume in the next several sessions, the market could move toward 80,600 within one to three weeks. If that does not happen, the range can persist longer and the best trades remain short-term.
The bearish scenario is simple to define. A daily close below 76,000 with rising volume would invalidate the base and open the path toward 75,000 and then 74,000. In that case, waiting for a retest of lower resistance before taking any new long is the safer approach.
$BTC ‌
repost-content-media
BTC-0.67%
  • 3
Load More

Join 40 M users in our growing community

⚡️ Join 40 M users in the crypto craze discussion

💬 Engage with your favorite top creators

👍 See what interests you

Trending Topics

USMidtermsVoteToday

29.56k Views850 Discussing

The U.S. midterm elections are being held today, with all 435 House seats and 35 Senate seats on the ballot. The results will shape control of Congress and could influence future fiscal, economic and crypto regulatory policy. What are you watching most closely — control of Congress, fiscal policy or crypto regulation? Which market will price in the outcome first: U.S. stocks, gold or crypto?

GateRanksTop2AcrossMultipleCategories

18.1k Views3.07k Discussing

USEarningsSeason

468.12k Views3.37k Discussing

View More