The first 30 minutes after the U.S. stock market opens may reveal the direction of the final 30 minutes in advance.
A study covering 20 years of SPY data found that the price move from the previous day's close to 30 minutes after the open has predictive power for the direction of the final 30 minutes, with this relationship more pronounced on days with high volatility, high trading volume, and major macroeconomic data releases.
A set of clear trading rules can be designed around the price range formed during the first 30 minutes after the open. We refer to this opening-range breakout as ORB.
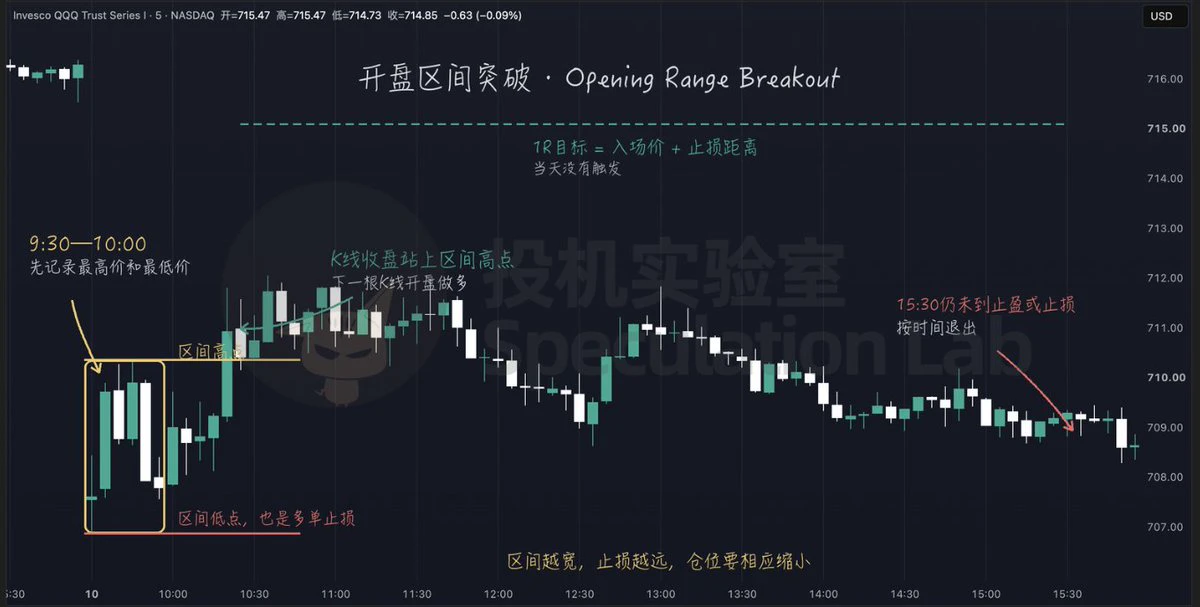
The approach is to first record the high and low between 9:30 and 10:00 a.m. Eastern Time each day as that day's opening range.
After 10:00, when using 5-minute candlesticks, go long at the next candle's open if a candle closes above the range high, and go short at the next candle's open if a candle closes below the range low.
A brief intraday move through a boundary that closes back inside the range does not count as a valid signal.
After going long, place the stop-loss at the range low. The take-profit can initially be tested at 1R or 2R. If neither the stop-loss nor take-profit has been triggered by 3:30 p.m., exit based on time and do not hold overnight.
For short trades, reverse the rules and place the stop-loss at the range high. However, a downside break may quickly encounter buying support, so long and short trades should be tested separately.
Company news, earnings reports, and overseas market volatility accumulated overnight are concentrated in the price after the open, while many large orders also begin executing during regular trading hours. The first 30 minutes capture the result of the initial clash between buyers and sellers.
If the price can still break out of the range after 10:00, it suggests that one side's orders may not yet be complete, leaving room for the move to continue.
The range width directly changes the risk of each trade. For a long trade, the distance from the entry price to the range low is the stop-loss distance; the wider the range, the greater the loss for the same position size.
When trading futures, first determine the maximum amount you are willing to lose per trade, then divide that amount by the stop-loss distance in points and the contract's value per point.
For example, if the maximum loss per trade is $500, the contract is worth $20 per point, and the stop-loss distance is 5 points, you can trade up to 5 contracts. Once the stop-loss expands to 25 points, you can trade only 1 contract.
High volatility and range-bound conditions are two obvious weaknesses of this method.
When volatility at the open is too high, the stop-loss distance is pushed farther away; on range-bound days, the price can easily retreat back into the range just after breaking out.
The statistical relationship between opening and closing-period returns does not mean that every breakout will succeed. ORB also adds entry, stop-loss, and take-profit rules.
Therefore, this set of rules still needs to be backtested separately, with commissions, slippage, and long and short results calculated independently.
A study covering 20 years of SPY data found that the price move from the previous day's close to 30 minutes after the open has predictive power for the direction of the final 30 minutes, with this relationship more pronounced on days with high volatility, high trading volume, and major macroeconomic data releases.
A set of clear trading rules can be designed around the price range formed during the first 30 minutes after the open. We refer to this opening-range breakout as ORB.
The approach is to first record the high and low between 9:30 and 10:00 a.m. Eastern Time each day as that day's opening range.
After 10:00, when using 5-minute candlesticks, go long at the next candle's open if a candle closes above the range high, and go short at the next candle's open if a candle closes below the range low.
A brief intraday move through a boundary that closes back inside the range does not count as a valid signal.
After going long, place the stop-loss at the range low. The take-profit can initially be tested at 1R or 2R. If neither the stop-loss nor take-profit has been triggered by 3:30 p.m., exit based on time and do not hold overnight.
For short trades, reverse the rules and place the stop-loss at the range high. However, a downside break may quickly encounter buying support, so long and short trades should be tested separately.
Company news, earnings reports, and overseas market volatility accumulated overnight are concentrated in the price after the open, while many large orders also begin executing during regular trading hours. The first 30 minutes capture the result of the initial clash between buyers and sellers.
If the price can still break out of the range after 10:00, it suggests that one side's orders may not yet be complete, leaving room for the move to continue.
The range width directly changes the risk of each trade. For a long trade, the distance from the entry price to the range low is the stop-loss distance; the wider the range, the greater the loss for the same position size.
When trading futures, first determine the maximum amount you are willing to lose per trade, then divide that amount by the stop-loss distance in points and the contract's value per point.
For example, if the maximum loss per trade is $500, the contract is worth $20 per point, and the stop-loss distance is 5 points, you can trade up to 5 contracts. Once the stop-loss expands to 25 points, you can trade only 1 contract.
High volatility and range-bound conditions are two obvious weaknesses of this method.
When volatility at the open is too high, the stop-loss distance is pushed farther away; on range-bound days, the price can easily retreat back into the range just after breaking out.
The statistical relationship between opening and closing-period returns does not mean that every breakout will succeed. ORB also adds entry, stop-loss, and take-profit rules.
Therefore, this set of rules still needs to be backtested separately, with commissions, slippage, and long and short results calculated independently.