




Share crypto content and earn up to 60% commissions through content mining.
placeholder
gatefun
No vision, even I'm stunned by these gains📉😎 A few days ago, the early morning $ENJ bounce looked exciting, but after watching for a while, I sensed something off: no volume on the rise, weak support, and it softened as soon as resistance came in. I immediately warned not to go long, don't be misled by the fake strength.
Entry reference at 0.04193. The price tried to creep up a few more times in between👀 but every time fell short—couldn't break higher or hold. This kind of rhythm is most dangerous if you panic first. My thinking was straightforward: if it fails to break resistance at the to
ENJ-1.58%
BTC1.32%
ETH-0.05%
View Original
post-image
  • Reward
  • Comment
  • Repost
  • Share
It was still grinding a few days ago, but today it just gives the answer! 🚨📉 During the session, when prices were grinding up near the highs, many were lured and fooled by the pump and got a bit too carried away. What I saw was a lack of strength in the rebound—there’s a layer of overhead pressure after another. The bearish sentiment here for ENA is already very strong. 👀$ENA I started entering from 0.09502. The logic isn’t complicated: if there’s no real follow-through after a push higher, and once the selling pressure is applied, the move is prone to weaken. 📌 Back then, the reminder wa
ENA2.49%
BTC1.32%
ETH-0.05%
View Original
post-image
  • Reward
  • Comment
  • Repost
  • Share
Talk to about crypto Market
gate liveLIVE
193
  • Reward
  • Comment
  • Repost
  • Share
Ethereum at a Crossroads: Will ETH Hold This Critical Monthly Support or Break Lower? 📊
Ethereum is entering one of its most important technical phases in years. On the monthly timeframe, ETH is trading around $1,736 after an extended correction from its previous highs. While the market remains under pressure, the chart suggests that a major move could be approaching as price compresses near a long-term support zone.
Long-Term Trend Overview
The monthly chart tells a story of two powerful bull cycles followed by a prolonged correction. After reaching nearly $5,000, Ethereum failed to maintain
ETH-0.05%
post-image
  • Reward
  • 3
  • Repost
  • Share
TidalShellReflection:
The 1600-1800 range is indeed critical. If it holds, it's a bottom formation; if it doesn't, it's over.
View More
This short position finally paid off. $LYN came down from the high, and the rhythm was even cleaner than I expected. I opened at 0.05161, and now the price has dropped to 0.03503, with floating profit of +787.3%. This is not luck — the high-level resistance was too obvious earlier.
At the time, I wasn't focused on how much it had dropped, but on the fact that every rebound failed to hold. As soon as buying pressure chased in, it got crushed. The structure had clearly changed. Many were still waiting for it to keep pumping, but the chart gave the answer first — to put it bluntly, the bull chain
LYN-2.03%
BTC1.32%
ETH-0.05%
View Original
post-image
  • Reward
  • Comment
  • Repost
  • Share
The recent dump scared many people out, but I actually think this is the most comfortable stretch for short positions to cash out.
$TAO had been grinding high for a long time, looking like it wanted to hold on the surface, but each upward push was rejected. What really caught my attention were those fake breakouts near 270.4 — they pushed up but no one followed, and the pullbacks got faster. The structure clearly changed here.
So I held the short position without running away, waiting for the acceleration after the breakdown. Now the current price has come to 213.7, and this trade shows a +10
TAO3.39%
BTC1.32%
ETH-0.05%
View Original
post-image
  • Reward
  • Comment
  • Repost
  • Share
What really caught my attention was the failed rebound here. $XAUT did try to move upward, but every time it approached the key resistance zone, the feedback was weak. For such a trend, I usually take a more cautious view.
Entry price at 4308.7. When the price fell all the way to 4107.8, the previously judged logic of high-level pressure began to materialize, and the rhythm went smoother than I expected.
Current yield shows +433%. In my review, this type of downtrend does not require over-emotion. Being able to see the continuity after capital withdrawal is more meaningful than staring at a si
XAUT0.89%
BTC1.32%
ETH-0.05%
View Original
post-image
  • Reward
  • Comment
  • Repost
  • Share
ONDO shorts have a 95% win rate—don't miss this move?
$ONDO /USDT - SHORT
Trading Plan:
Entry: 0.3151 – 0.3165
SL: 0.3224
TP1: 0.3109
TP2: 0.3076
TP3: 0.3026
Why this setup?
- 4H trend is clearly bearish, 1D bearish confirms the bigger direction.
- RSI 15m is only 40.28, weak bounce, bearish momentum continues.
- ONDO is currently around 0.3158, hugging EMA resistance—prime entry opportunity.
- Targets TP1 0.3109, TP2 0.3076, stop loss 0.3224, risk is manageable.
Discussion:
Do you bet it hits TP2 first, or fakes a bounce before dropping?
ONDO0.45%
View Original
post-image
post-image
  • Reward
  • Comment
  • Repost
  • Share
This wave of decline came decisively: $TRB moved from bearing pressure at the top and then accelerated into a pullback, and the short-side logic has already been fully realized.
What I was watching wasn’t just a single bearish candle, but the exhaustion around 17.31 after repeated attempts to break through failed. Each time the price rebounded, it was pushed back again, showing that the funds above weren’t willing to continue taking the baton. Many people are still imagining it could be lifted up for another leg, but the chart has already started to weaken early. At this level, I won’t gamble
TRB-4.27%
BTC1.32%
ETH-0.05%
View Original
post-image
  • Reward
  • Comment
  • Repost
  • Share
$MU /USDT short setup is in place— is the 1000 level a trap?
MU_USDT - SHORT
Trading Plan:
Entry: 996.64 – 1004.06
SL: 1035.95
TP1: 973.65
TP2: 955.85
TP3: 929.15
Why pay attention to this structure?
- Bearish on the 4-hour timeframe; RSI 15m at 48.45 is slightly weak/neutral, and 1-hour ATR at 14.8 indicates moderate volatility.
- The current price of 1000.35 is near the resistance zone; the 1D trend is ranging, making the short entry point reasonable.
- Short targets: TP1 973.65, TP2 955.85; SL 1035.95; the risk-reward ratio is above 1:2.
- Why now? The 1000 psychological level has been test
MU2.13%
View Original
post-image
post-image
  • Reward
  • Comment
  • Repost
  • Share
$ESPORTS /USDT Short Signal Activated, 95% Win Rate – Dare You Follow?
$ESPORTS /USDT - Short SHORT
Trading Plan:
Entry: 0.02136 – 0.02198
SL: 0.02462
TP1: 0.01946
TP2: 0.01798
TP3: 0.01577
Why focus on this structure?
- 1D trend clearly bearish, 4h level SHORT signal confirmed.
- Current price 0.02167, EMA resistance, RSI 15m 62.7 near overbought zone, pullback imminent.
- Why now? Waiting for invalidation level 0.02309 not broken, entry range 0.02136-0.02198 plug and play.
Discussion:
Will this wave reach TP1 0.01946 first, or directly spike to lure longs? Comment your view.
ESPORTS24.24%
View Original
post-image
post-image
  • Reward
  • Comment
  • Repost
  • Share
Market update
gate liveLIVE
1,916
  • Reward
  • Comment
  • Repost
  • Share
JUST IN: New Hampshire’s Executive Council rejected a $100M state-backed Bitcoin bond project, stalling what would've been the first state-endorsed BTC bond initiative. If revived, it could signal shifting state-level crypto policy dynamics. $BTC
BTC1.26%
post-image
  • Reward
  • Comment
  • Repost
  • Share
Woke up and straight up felt on point! A few days ago, before bed I was still grinding. This morning, when I opened the chart, it already started cashing out 📉🚀$VVV . What I’m watching this wave is high-position pressure: when it goes up, nobody catches it, and the support is clearly insufficient. Before the chart was fully activated, I already said the shorts’ rhythm was cleaner, and I placed my long entry around 17.372. I’m not afraid of it grinding—I’m afraid you’ll panic first.
Now it’s pulled from 17.372 to 11.515, +1623.65% in hand. Feels great ✅💰. This isn’t about forcing it with a h
VVV0.97%
BTC1.32%
ETH-0.05%
View Original
post-image
  • Reward
  • Comment
  • Repost
  • Share
A few days ago, I watched this $WLD short order closely. Not because I’m some genius, but because I’ve been burned before by this kind of range-bound price action at a high—once it fails to hold, the drop is often faster than expected.
I started going long around 0.4331. It didn’t feel comfortable at first—price kept whipsawing, and the account volatility was annoying. What kept me in was how every bounce got pushed back down. The buying looked active but had no real follow-through.
Now we’re around 0.3776, with the return showing +915.81%. This decline’s profit has been realized. To put it pl
WLD-2.10%
BTC1.32%
ETH-0.05%
View Original
post-image
  • Reward
  • Comment
  • Repost
  • Share
Exploded! After pretending to be strong at highs for a long time, it was finally pressed down by the bears 🔥📉 When I opened the market this morning, $APT directly reversed the fake rebound from a few days ago back to its original form.
When everyone was still waiting and watching a few days ago in the afternoon, I saw APT struggling to pull up, softening after a surge, with clearly insufficient support 👀 I won't chase the hype in such a market. Seeing that the overhead resistance wasn't taken out, I suggested following a long position approach, with entry reference at 0.9197.
Now it has gi
APT0.63%
BTC1.32%
ETH-0.05%
View Original
post-image
  • Reward
  • Comment
  • Repost
  • Share
I think full porting into $ANSEM at these levels could be the best play to make
post-image
  • Reward
  • Comment
  • Repost
  • Share
This trend is really wild! 📉🔥 A few days ago in the early morning, it kept trying to push up, looked firm on the surface, but each rally lacked strength—volume wasn’t there, buying pressure was weak. I said then: don’t chase here, going short 👀$LTC is more suitable. Entry for the short was at 52.32, based on clear resistance at the highs—the rally had no quality, no one stepped in on the way up. The longer it grinded, the more it felt like paving the way for shorts 📌. Now the chart gives the answer directly: price hit 43.92, return +1139.19% ✅💰. This move was very satisfying—the grinding
LTC-0.09%
BTC1.32%
ETH-0.05%
View Original
post-image
  • Reward
  • Comment
  • Repost
  • Share
$ansem wicked to $200 million mc
Better get out before it goes to $180 million mc
#crypto #altcoins $sol
SOL0.32%
post-image
  • Reward
  • Comment
  • Repost
  • Share
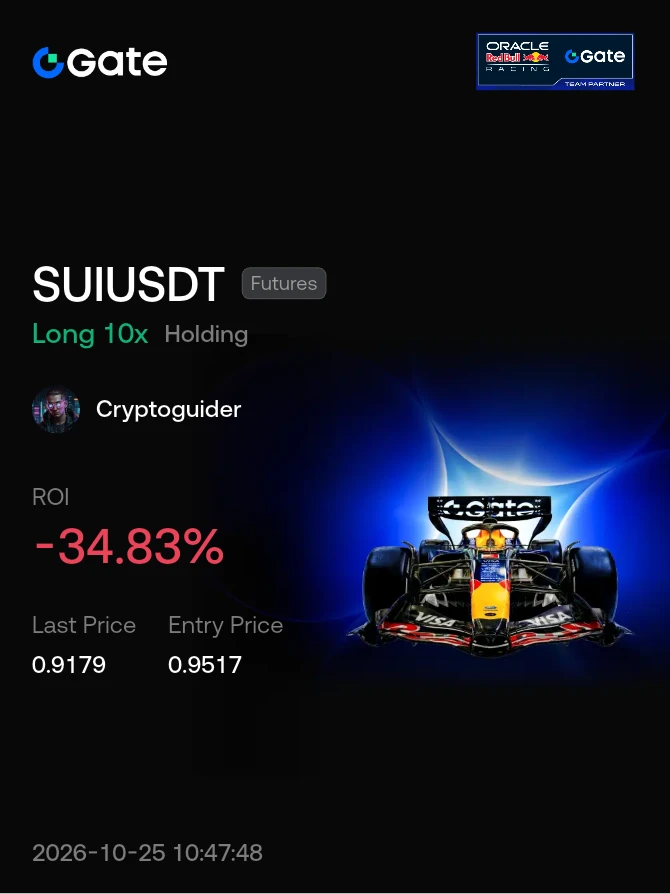
This trend is really a bit unbelievable! A few days ago it looked like it was still hardening through it, but today it just dropped straight down with a result📉🔥 A few days ago in the afternoon, when everyone was still watching and waiting, I was watching the rebound strength of $SUI —it was clearly a low-volume push higher. The resistance overhead gave way at the first touch. I said then: don’t rush to chase longs. Going long is the smoother direction—entry reference is 1.0045. If you understand it, execute it—don’t hesitate at the last second. Now the price has moved from 1.0045 to 0.7179,
SUI0.31%
BTC1.32%
ETH-0.05%
View Original
post-image
  • Reward
  • Comment
  • Repost
  • Share
Load More

Join 40 M users in our growing community

⚡️ Join 40 M users in the crypto craze discussion
💬 Engage with your favorite top creators
👍 See what interests you
  • Pinned