$GBPJPY $USDJPY $EURJPY
The Yen Awakens: How Japan's Quiet Tightening Is Rewriting the Rules of Global Finance
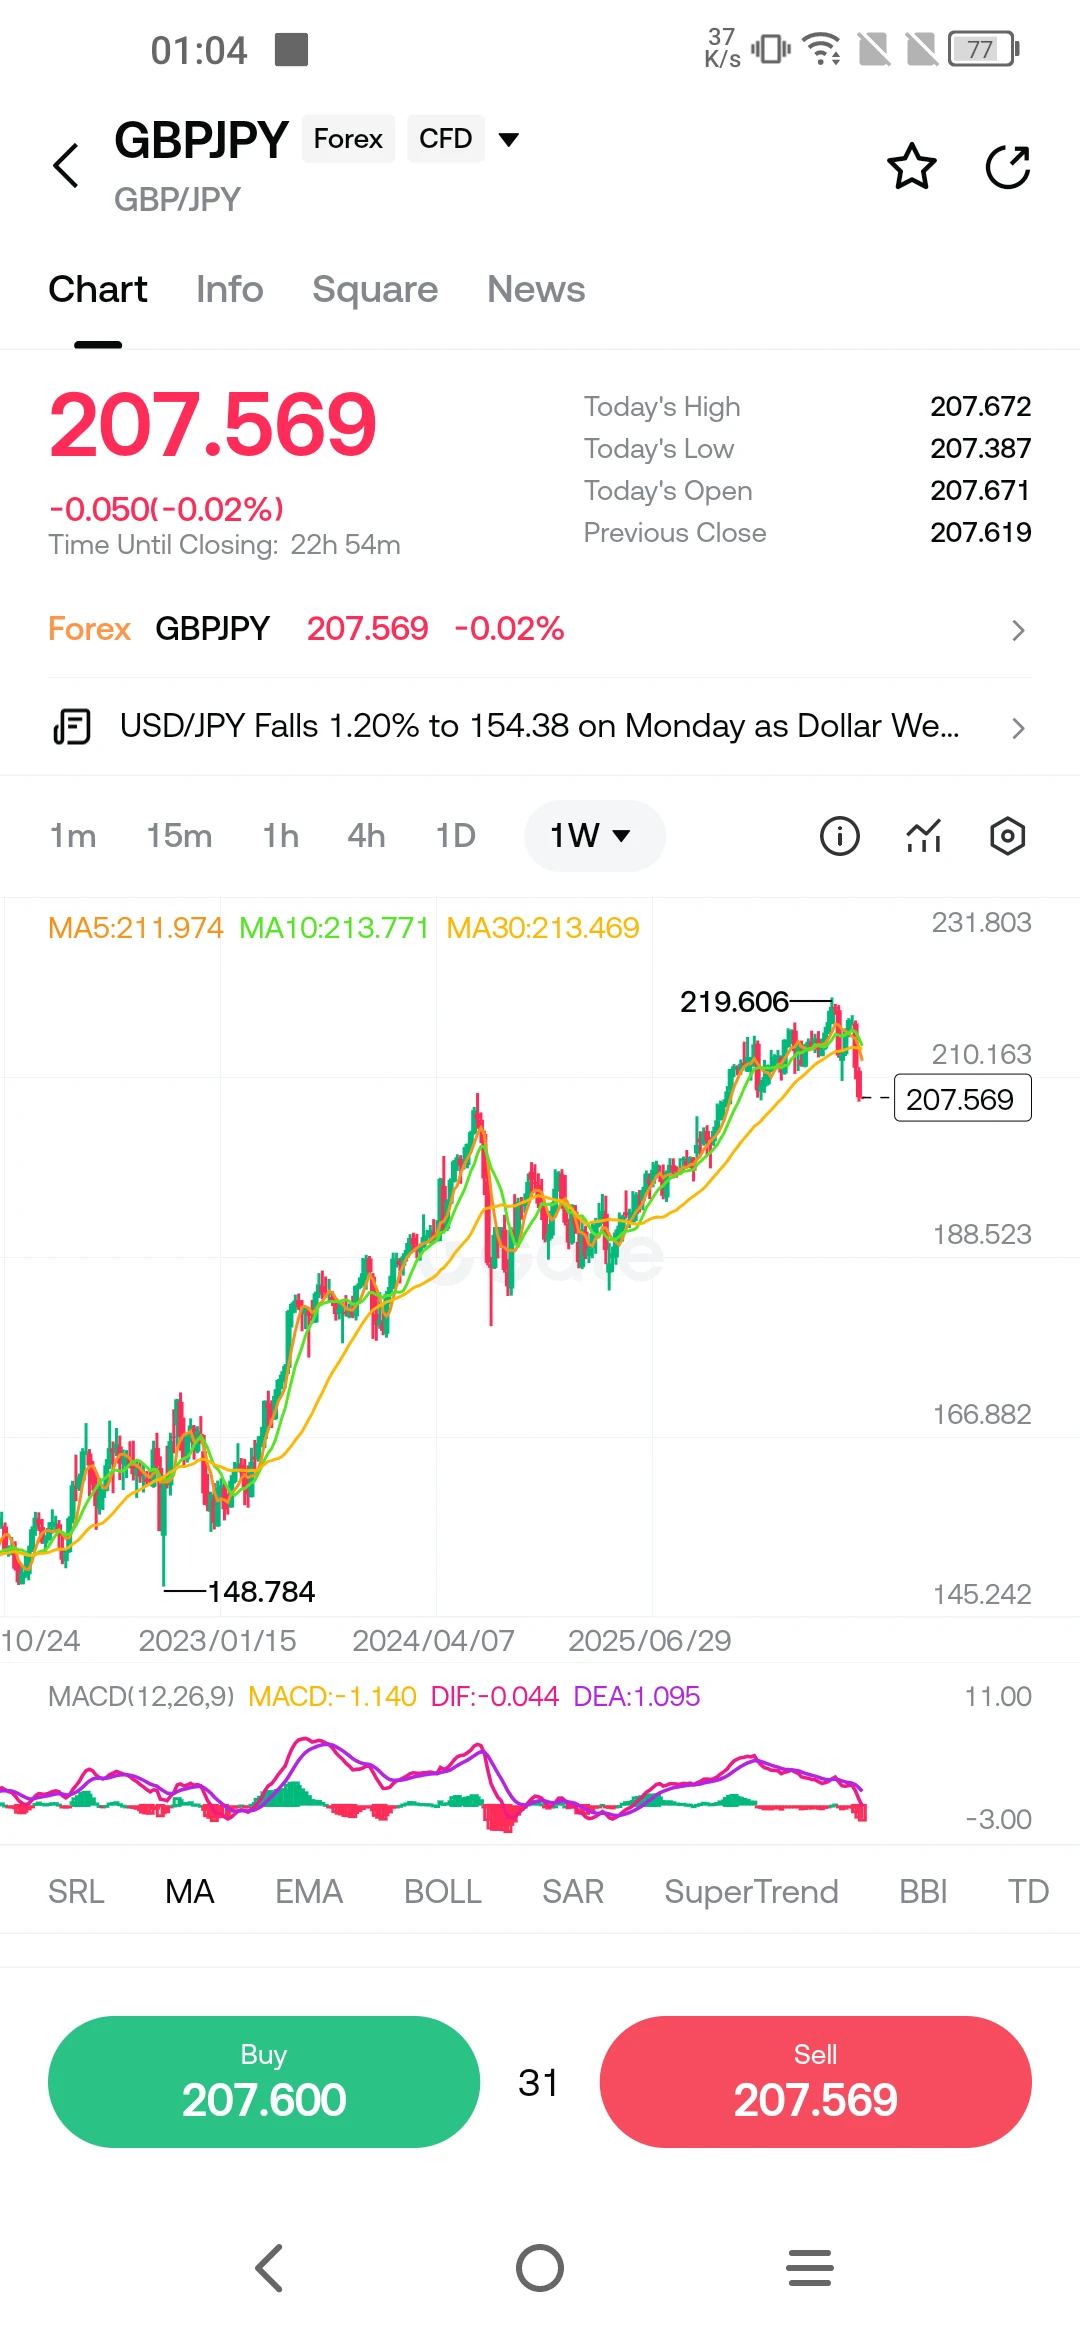
Good morning. If you are reading this from a trading floor in London, a hedge fund office in New York, or a treasury desk in Singapore, the chart that should be commanding your attention this week is not the S&P 500 or the price of Brent crude. It is the Japanese yen. After years of languishing at levels that made it the world's favourite funding currency, the yen has staged a rally that is forcing investors across every asset class to reconsider long-held assumptions. The currency strengthened to its highest level since February against the dollar this week, touching 152.89 per dollar before settling near 153.48, a move that has surprised even seasoned market participants. Behind this shift lies a simple but profound reality: the Bank of Japan is no longer the outlier it once was.
For much of the past decade, Japan occupied a unique position in the global financial architecture. It was the economy that refused to normalise. While the Federal Reserve, the European Central Bank, and the Bank of England raised rates to combat post-pandemic inflation, the BOJ held its policy rate at minus 0.1 percent, maintaining a commitment to ultra-loose monetary conditions that made the yen the cheapest major currency to borrow. This divergence created one of the most lucrative and persistent trades in modern finance: the yen carry trade. Investors would borrow yen at near-zero cost, convert the proceeds into higher-yielding currencies, and pocket the difference. Estimates suggest that cross-border yen borrowing, a proxy for the carry trade, reached a record 360 trillion yen, or roughly 2.35 trillion dollars, as of March, according to an analysis by Jefferies based on Bank for International Settlements data. This was the largest carry-trade build-up in three decades, and it became a foundational pillar of global risk appetite.
That pillar is now under strain. The BOJ has already raised its policy rate to 1.0 percent, and market expectations point overwhelmingly toward another quarter-point increase to 1.25 percent at the conclusion of its two-day meeting on September 18. According to Tokyo Tanshi data, the odds of this hike stand at 97 percent, up from just 52 percent a month ago. More significantly, a Bloomberg survey of 52 economists found that every single one expects a September move, and nearly half anticipate the BOJ will now raise rates once per quarter, a dramatic acceleration from the previous pace of one hike every six months. The terminal rate expectation has settled around 1.75 percent, implying three more increases beyond September. This is not a marginal adjustment. It is a fundamental shift in the cost of the world's most important funding currency.
The yen's rally is already triggering visible consequences. "The carry trade is vulnerable because this unwind is happening before the BOJ has even delivered its expected hike," said Charu Chanana, chief investment strategist at Saxo, as reported by Reuters. "Some yen shorts have already been cut, but positioning still looks sizeable, so further yen strength can turn a gradual reduction in leverage into a much faster, self-reinforcing unwind." The yen has marched nearly 5 percent higher so far in September against the usual carry-trade favourites, including the Mexican peso and the Turkish lira. A further unwind, according to State Street's Masahiko Loo, could push the dollar-yen pair toward the mid-140s given the substantial outstanding short position.
The implications for global markets are neither hypothetical nor distant. When investors borrow in yen to fund positions in higher-yielding assets, a rising yen makes those loans more expensive to repay. If the appreciation is sharp enough, it can force leveraged funds to sell those assets to cover losses, creating a feedback loop that amplifies volatility across equities, bonds, and currencies. This is precisely what happened in August 2024, when a BOJ rate hike sent shockwaves through global markets for days. The stakes this time are arguably higher. The carry trade has grown larger, the positioning more crowded, and the geopolitical backdrop more fragile. Oil prices above 100 dollars a barrel, an active conflict between the United States and Iran, and an uncertain American inflation trajectory all compound the risk.
Yet it would be a mistake to frame this solely as a story of impending crisis. The yen's appreciation reflects something more constructive: the gradual normalisation of an economy that has spent a generation in the wilderness of deflation and stagnation. Japan's consumer price inflation has remained above the BOJ's 2 percent target, running between 2.5 and 3 percent in recent government data. The central bank has acknowledged that its economy "has recovered moderately," though it also cautioned that exports will be affected by higher tariffs stemming from American trade policy. Real GDP grew at an annualised 1.1 percent in the April-June quarter, marking a third consecutive quarter of positive growth, though private consumption and capital investment both softened. The Nikkei 225 has hit record highs, buoyed by the Fed's recent rate cut and the broader reflation narrative.
The political dimension adds another layer of complexity. Prime Minister Shigeru Ishiba is stepping down, and the ruling Liberal Democratic Party is holding a leadership election, with five candidates expected to enter the race. The BOJ itself has cited domestic political uncertainty as a risk factor. The outcome of this leadership contest will shape fiscal policy in the months ahead and could influence the pace of monetary tightening. Meanwhile, the United States has shown a willingness to intervene in currency markets alongside Japan, as it did in July when the yen hit 40-year lows. U.S. Treasury Secretary Scott Bessent has referred to the potential for additional Japanese intervention, and ECB policymaker Joachim Nagel has indicated that coordinated action could be welcomed under certain circumstances. This cooperative stance suggests that the major economies are not indifferent to the yen's trajectory and are prepared to act if disorderly moves threaten financial stability.
What should a careful observer watch in the coming weeks? First, the BOJ's policy statement on September 18 and Governor Ueda's subsequent press conference. The language used will matter as much as the rate decision itself. If the BOJ signals that further hikes are contingent on data and proceed gradually, the yen may stabilise. If it hints at a faster pace, the carry-trade unwind could accelerate. Second, the reaction of global equity markets, particularly in the United States, where high-valuation technology stocks have benefited disproportionately from cheap yen funding. Third, the trajectory of oil prices. If Brent crude remains above 100 dollars, the inflationary pressure on Japan, a major energy importer, will intensify, reinforcing the case for tighter policy.
The deeper truth is that the era of free money from Japan is ending. For years, the yen carry trade served as a quiet subsidy for global risk assets, allowing investors to borrow cheaply and chase returns elsewhere. That subsidy is now being withdrawn, not abruptly, but steadily and deliberately. The world is adjusting to a Japan that is no longer the exception to the rules of monetary orthodoxy. How smoothly that adjustment proceeds will depend on the wisdom of policymakers, the resilience of markets, and the willingness of investors to recognise that the landscape has changed. The yen's awakening is not a crisis. It is a correction. And corrections, however uncomfortable, are how markets rediscover equilibrium.
NFA ✔️ DYOR 🔎
#AugustCoreCPIBeatsExpectations #ShareWeekly
The Yen Awakens: How Japan's Quiet Tightening Is Rewriting the Rules of Global Finance
Good morning. If you are reading this from a trading floor in London, a hedge fund office in New York, or a treasury desk in Singapore, the chart that should be commanding your attention this week is not the S&P 500 or the price of Brent crude. It is the Japanese yen. After years of languishing at levels that made it the world's favourite funding currency, the yen has staged a rally that is forcing investors across every asset class to reconsider long-held assumptions. The currency strengthened to its highest level since February against the dollar this week, touching 152.89 per dollar before settling near 153.48, a move that has surprised even seasoned market participants. Behind this shift lies a simple but profound reality: the Bank of Japan is no longer the outlier it once was.
For much of the past decade, Japan occupied a unique position in the global financial architecture. It was the economy that refused to normalise. While the Federal Reserve, the European Central Bank, and the Bank of England raised rates to combat post-pandemic inflation, the BOJ held its policy rate at minus 0.1 percent, maintaining a commitment to ultra-loose monetary conditions that made the yen the cheapest major currency to borrow. This divergence created one of the most lucrative and persistent trades in modern finance: the yen carry trade. Investors would borrow yen at near-zero cost, convert the proceeds into higher-yielding currencies, and pocket the difference. Estimates suggest that cross-border yen borrowing, a proxy for the carry trade, reached a record 360 trillion yen, or roughly 2.35 trillion dollars, as of March, according to an analysis by Jefferies based on Bank for International Settlements data. This was the largest carry-trade build-up in three decades, and it became a foundational pillar of global risk appetite.
That pillar is now under strain. The BOJ has already raised its policy rate to 1.0 percent, and market expectations point overwhelmingly toward another quarter-point increase to 1.25 percent at the conclusion of its two-day meeting on September 18. According to Tokyo Tanshi data, the odds of this hike stand at 97 percent, up from just 52 percent a month ago. More significantly, a Bloomberg survey of 52 economists found that every single one expects a September move, and nearly half anticipate the BOJ will now raise rates once per quarter, a dramatic acceleration from the previous pace of one hike every six months. The terminal rate expectation has settled around 1.75 percent, implying three more increases beyond September. This is not a marginal adjustment. It is a fundamental shift in the cost of the world's most important funding currency.
The yen's rally is already triggering visible consequences. "The carry trade is vulnerable because this unwind is happening before the BOJ has even delivered its expected hike," said Charu Chanana, chief investment strategist at Saxo, as reported by Reuters. "Some yen shorts have already been cut, but positioning still looks sizeable, so further yen strength can turn a gradual reduction in leverage into a much faster, self-reinforcing unwind." The yen has marched nearly 5 percent higher so far in September against the usual carry-trade favourites, including the Mexican peso and the Turkish lira. A further unwind, according to State Street's Masahiko Loo, could push the dollar-yen pair toward the mid-140s given the substantial outstanding short position.
The implications for global markets are neither hypothetical nor distant. When investors borrow in yen to fund positions in higher-yielding assets, a rising yen makes those loans more expensive to repay. If the appreciation is sharp enough, it can force leveraged funds to sell those assets to cover losses, creating a feedback loop that amplifies volatility across equities, bonds, and currencies. This is precisely what happened in August 2024, when a BOJ rate hike sent shockwaves through global markets for days. The stakes this time are arguably higher. The carry trade has grown larger, the positioning more crowded, and the geopolitical backdrop more fragile. Oil prices above 100 dollars a barrel, an active conflict between the United States and Iran, and an uncertain American inflation trajectory all compound the risk.
Yet it would be a mistake to frame this solely as a story of impending crisis. The yen's appreciation reflects something more constructive: the gradual normalisation of an economy that has spent a generation in the wilderness of deflation and stagnation. Japan's consumer price inflation has remained above the BOJ's 2 percent target, running between 2.5 and 3 percent in recent government data. The central bank has acknowledged that its economy "has recovered moderately," though it also cautioned that exports will be affected by higher tariffs stemming from American trade policy. Real GDP grew at an annualised 1.1 percent in the April-June quarter, marking a third consecutive quarter of positive growth, though private consumption and capital investment both softened. The Nikkei 225 has hit record highs, buoyed by the Fed's recent rate cut and the broader reflation narrative.
The political dimension adds another layer of complexity. Prime Minister Shigeru Ishiba is stepping down, and the ruling Liberal Democratic Party is holding a leadership election, with five candidates expected to enter the race. The BOJ itself has cited domestic political uncertainty as a risk factor. The outcome of this leadership contest will shape fiscal policy in the months ahead and could influence the pace of monetary tightening. Meanwhile, the United States has shown a willingness to intervene in currency markets alongside Japan, as it did in July when the yen hit 40-year lows. U.S. Treasury Secretary Scott Bessent has referred to the potential for additional Japanese intervention, and ECB policymaker Joachim Nagel has indicated that coordinated action could be welcomed under certain circumstances. This cooperative stance suggests that the major economies are not indifferent to the yen's trajectory and are prepared to act if disorderly moves threaten financial stability.
What should a careful observer watch in the coming weeks? First, the BOJ's policy statement on September 18 and Governor Ueda's subsequent press conference. The language used will matter as much as the rate decision itself. If the BOJ signals that further hikes are contingent on data and proceed gradually, the yen may stabilise. If it hints at a faster pace, the carry-trade unwind could accelerate. Second, the reaction of global equity markets, particularly in the United States, where high-valuation technology stocks have benefited disproportionately from cheap yen funding. Third, the trajectory of oil prices. If Brent crude remains above 100 dollars, the inflationary pressure on Japan, a major energy importer, will intensify, reinforcing the case for tighter policy.
The deeper truth is that the era of free money from Japan is ending. For years, the yen carry trade served as a quiet subsidy for global risk assets, allowing investors to borrow cheaply and chase returns elsewhere. That subsidy is now being withdrawn, not abruptly, but steadily and deliberately. The world is adjusting to a Japan that is no longer the exception to the rules of monetary orthodoxy. How smoothly that adjustment proceeds will depend on the wisdom of policymakers, the resilience of markets, and the willingness of investors to recognise that the landscape has changed. The yen's awakening is not a crisis. It is a correction. And corrections, however uncomfortable, are how markets rediscover equilibrium.
NFA ✔️ DYOR 🔎
#AugustCoreCPIBeatsExpectations #ShareWeekly