Square
Following
Hot
News
Profile
Share your thoughts
placeholder
Article
Today's gains are all the result of daily accumulation. Only by becoming more capable and gaining more experience can you go further and stand on firmer ground🤠
$BTC #美股财报季
post-image
BTC-0.65%
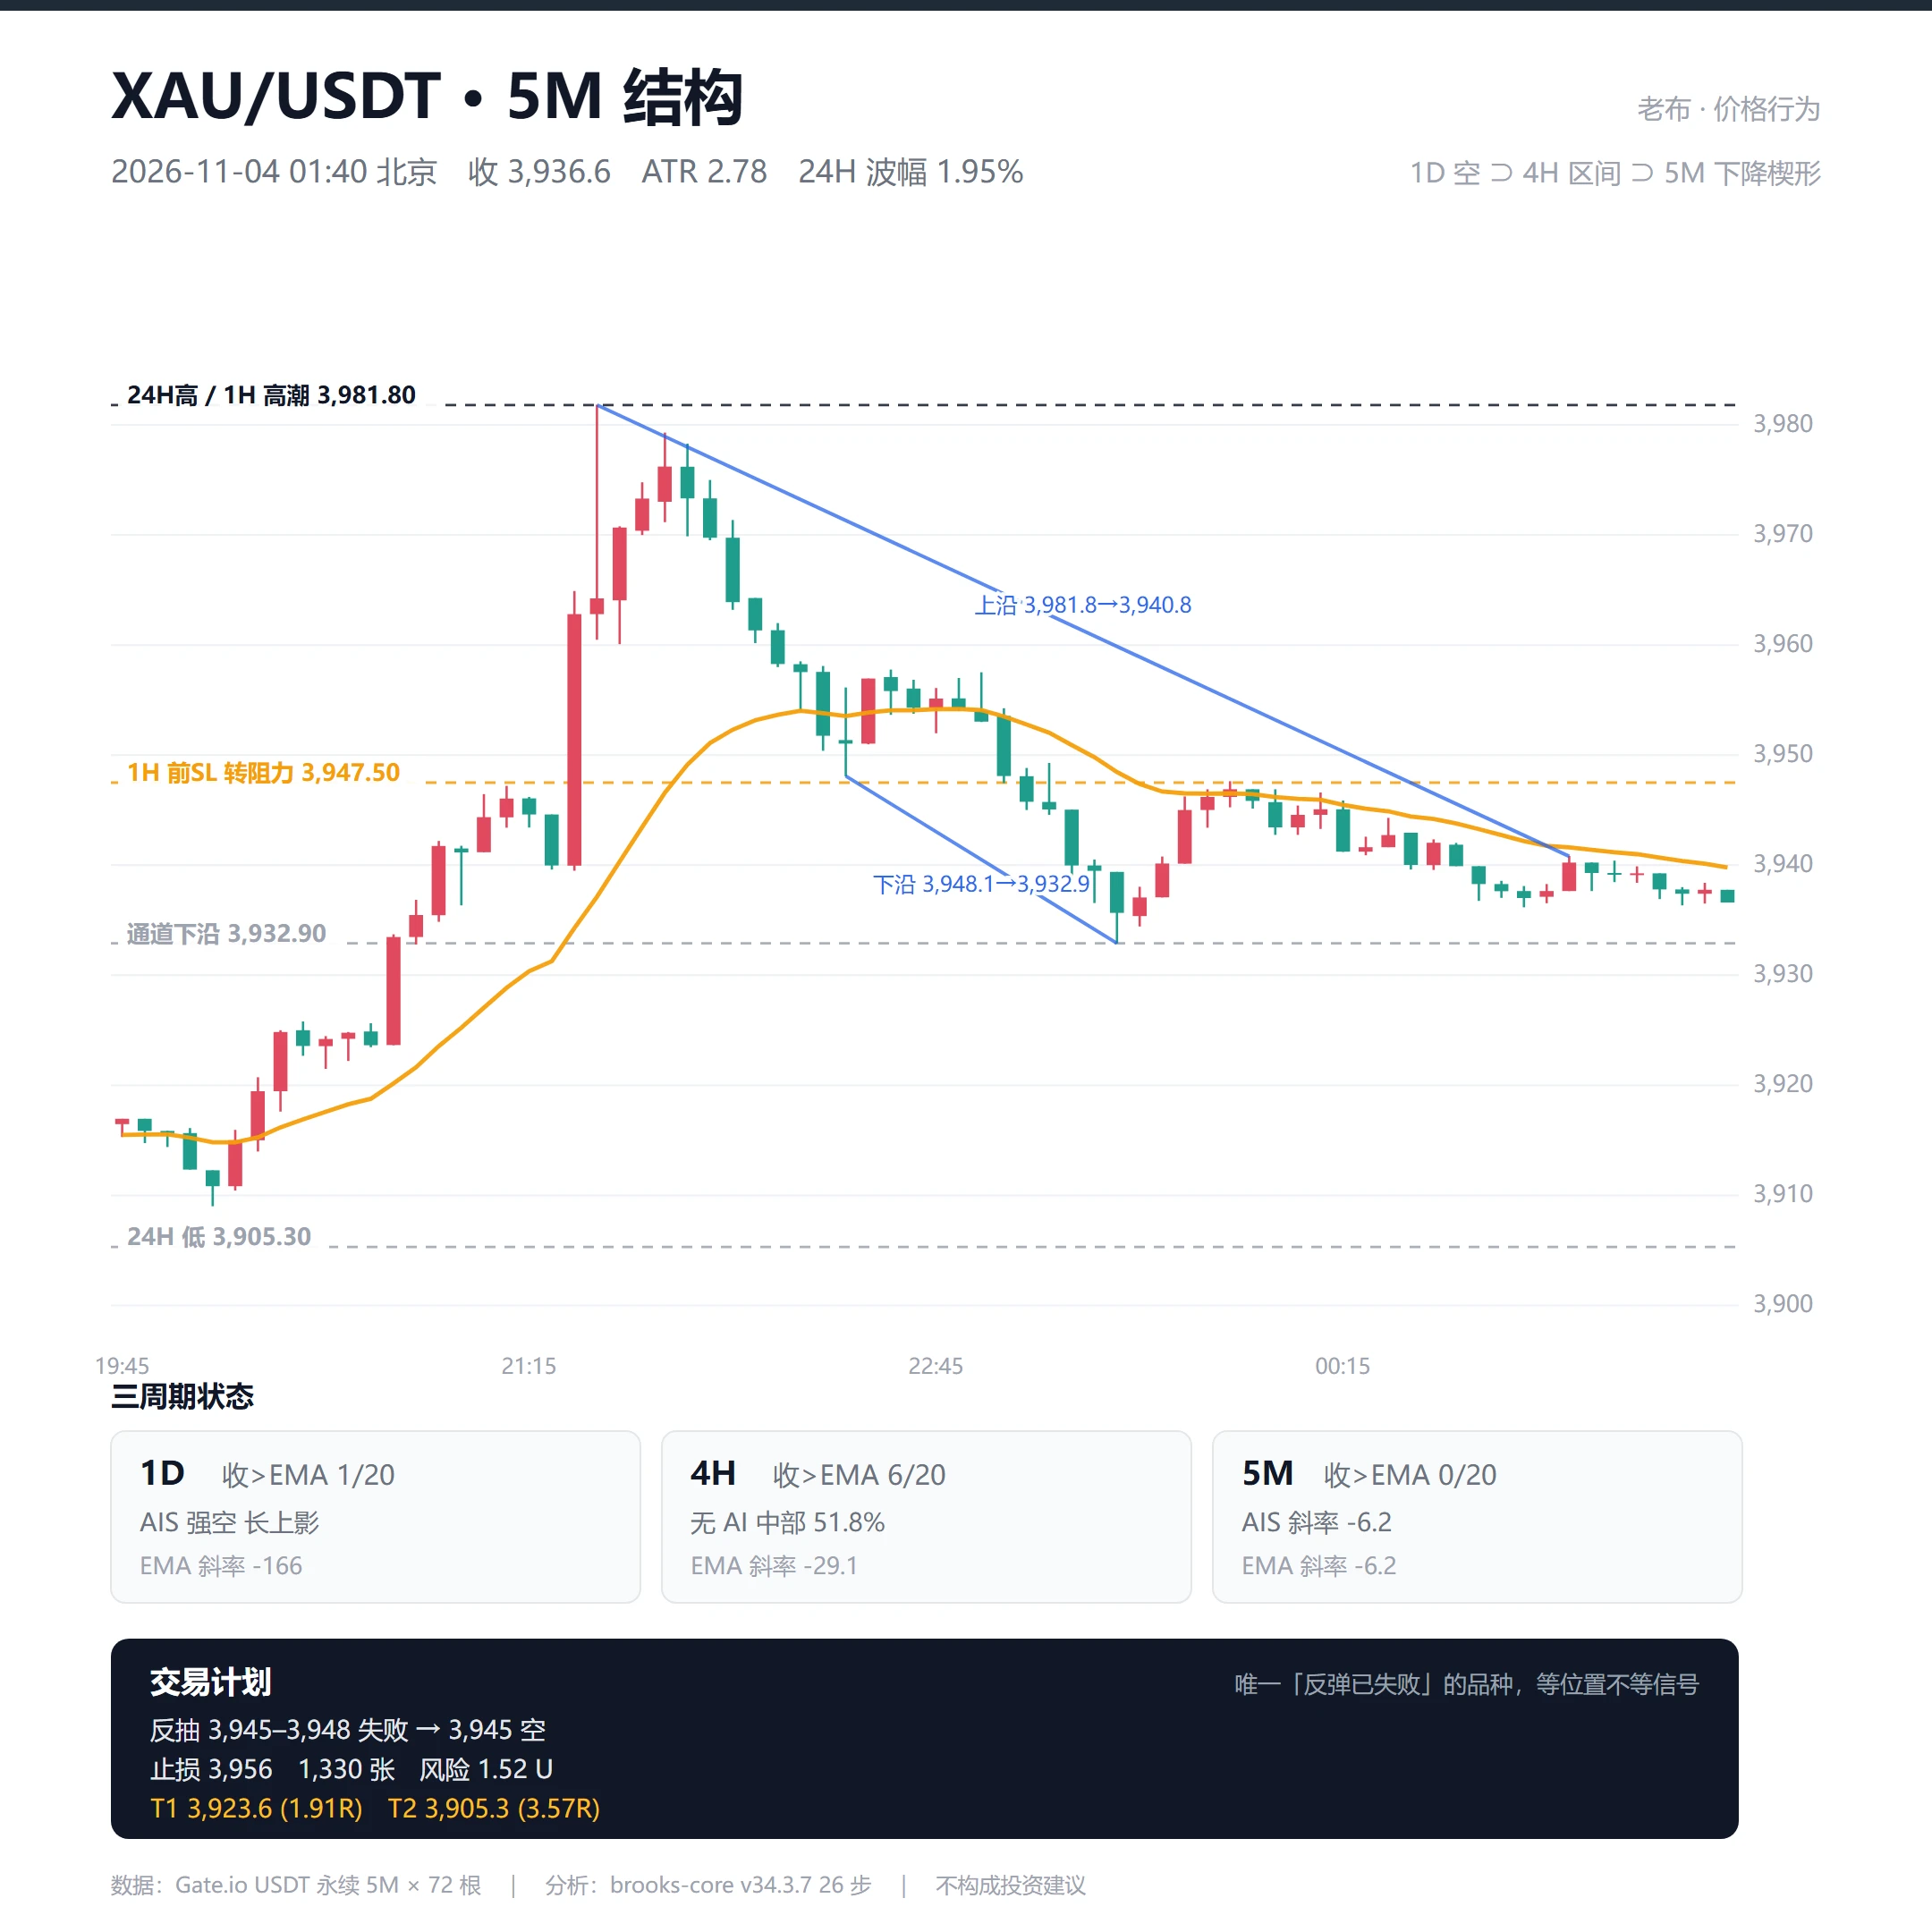
XAU 5M: The only instrument where the rebound has failed. The 11-03 daily candle had a 1.34 ATR long upper wick, hitting 3,981.8 before closing at 3,936.6, in the middle 40.9% of the range; the same 4H candle was 85% bearish body (BTC 3%, ETH 22%, SOL 42%); 5M was 0/20, with an EMA slope of -6.2.
Taker ratio 0.286, account ratio 3.676, OI -5.6%—all three are the most extreme among the four instruments. The retail account long/short ratio is 5.5 times that of large traders.
Direction is easiest, entry location hardest: the current price is in the middle of the descending channel, and the stop m
post-image
XAU+0.38%
BTC-0.67%
ETH-1.26%
SOL-0.77%
Trenches
ZIG
Z
bade
b
ZIG
0x8c...1145
Market Cap
$.
Change
.
24h Vol
$.
Holders
.
STONK
S
bade
b
STONK
6GmA...UNgx
Market Cap
$.
Change
.
24h Vol
$
Holders
.
AGT
A
bade
b
AGT
0x5d...e274
Market Cap
$.
Change
.
24h Vol
$.
Holders
.
CAPY
C
bade
b
CAPY
5DnW...vg2g
Market Cap
$.
Change
.
24h Vol
$.
Holders
.
MAMESUKE
M
bade
b
MAMESUKE
SCGB...STNK
Market Cap
$.
Change
.
24h Vol
$.
Holders
.
2026.11.4
Daily chart entry point: 2298
Resistance levels above: 2300-2310-2320-2330-2350
2370-2381-2390-2400
Support levels below: 2290-2283-2276-2265-2250
2240-2200-2175
At all support and resistance levels, stop out on the first break; if the level holds, look to catch a rebound. If it breaks again, follow the trend. Above 2300, favor going long on dips. Below 2379, favor shorting rallies; once price holds above 2379, chase longs. In the middle, watch 2276-2265-2250: if the levels hold, favor going long on dips; otherwise, favor shorting rallies. If 2240-2175 breaks, chase shorts; otherwise
ETH-1.23%
$SOL Contract Strategy: Short Positioning
• Entry timing: Look to go short after the price rebounds into the 92.50–93.00 range and meets resistance• Risk limit: Exit unconditionally if the price breaks above 94.00• Targets: First watch 90.79 (near the previous low), then 90.00
⚠️ Reminder: The overall structure is currently trending downward in a choppy manner, with rebound highs continuing to move lower; although MACD has formed a golden cross below the zero line, momentum is clearly insufficient. Do not chase shorts; patiently wait for a rebound to test resistance before entering, use a smal
post-image
SOL-0.74%
$KMNO ‌ is putting up a solid recovery after finding buyers near the $0.029 area.
The daily candle is showing renewed strength, with price climbing nearly 15% and approaching the $0.035 resistance zone. The bounce is encouraging, but the broader trend still needs confirmation while KMNO trades below its Supertrend at $0.04116.
Key levels to watch:
Support: $0.032, then $0.029
Resistance: $0.0354, then $0.0412
A clean break above $0.0354 could give bulls room to extend the recovery toward $0.041. Losing $0.029 would put the setup under pressure again.
Good response from buyers so far. The rea
KMNO+3.65%
NVDA+2.56%
  • 3
  • 1
2026.11.4
Daily entry point: 2298
Resistance levels above: 2300-2310-2320-2330-2350
2370-2381-2390-2400
Support levels below: 2290-2283-2276-2265-2250
2240-2200-2175
At all support and resistance levels, stop on the first break or buy the rebound if the level holds; if it breaks again, follow the trend. Above 2300, favor buying dips once it holds. Below 2379, favor selling rallies; if it holds above, go long. In the middle, watch 2276-2265-2250: favor buying dips if these levels hold, otherwise favor selling rallies. Below 2240-2175, go short on a break; otherwise, favor buying dips. Personal
GT-2.24%
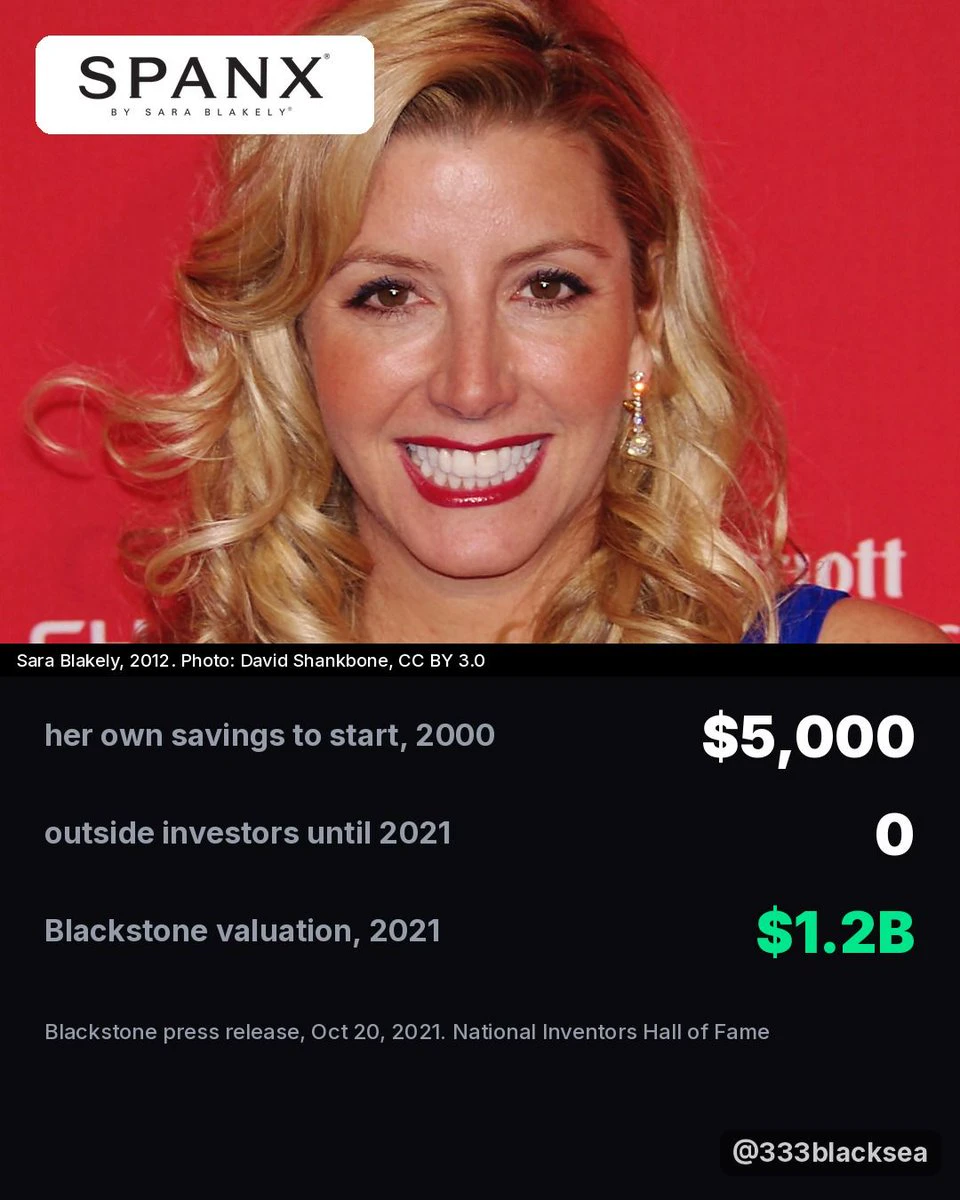
Sara Blakely started Spanx in 2000 with $5,000 of her own savings.
No outside investors for 21 years.
No paid ads until 2016.
Then Blackstone bought in at a $1.2 billion valuation.
What would you start with $5,000?
post-image
Its great to see $KLEOS and $BOXA moving the same way! There is room for more than one success story.
No PvP, just comfortably holding both 💎
post-image
Crypto live trade
live-cover
LIVE167
HYPEUSDT Short-Term Bias Is Strong: Key Levels to Watch Amid Low-Volume Trading
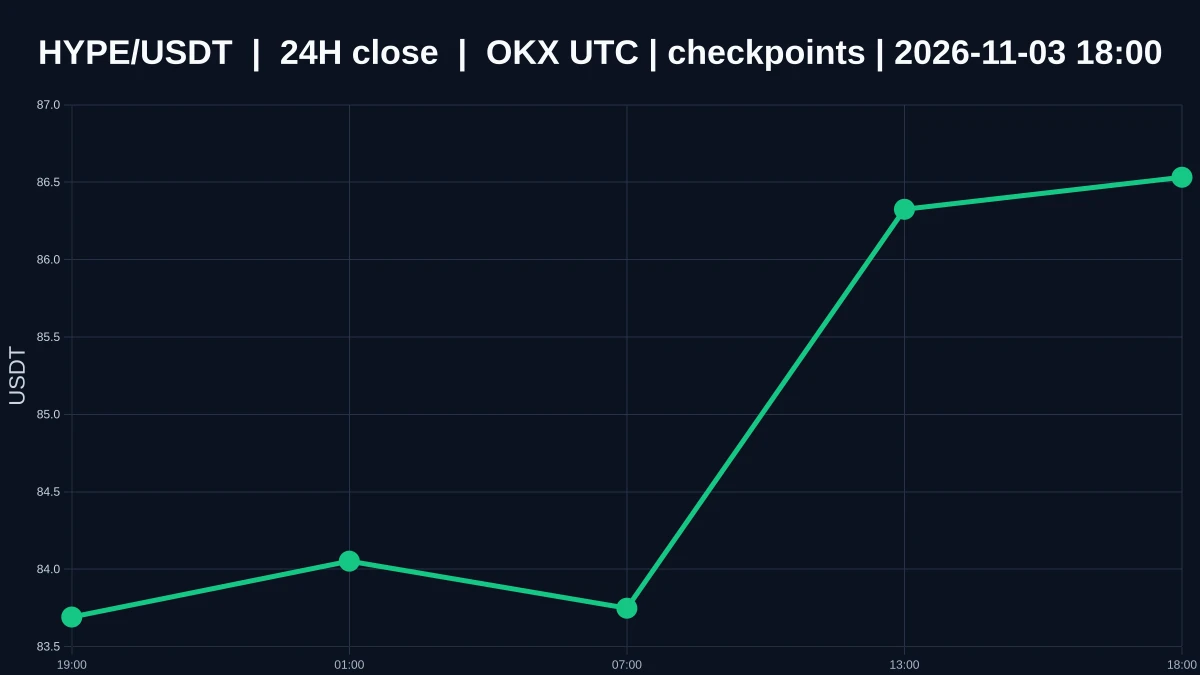
$HYPE The current price is 86.482, with a 24-hour change of 2.3334516625251434%. The intraday high is 87.94, and the low is 82.612. Over shorter time frames, the 1-hour trend is strong, and the 4-hour trend is also strong. The two time frames are aligned, with no clear divergence between bulls and bears. However, a uniformly strong bias does not mean the trend is confirmed; actual trading activity still needs to validate it. In a multi-time-frame analysis framework, the short- and medium-term directions have not ye
post-image
HYPE+0.24%
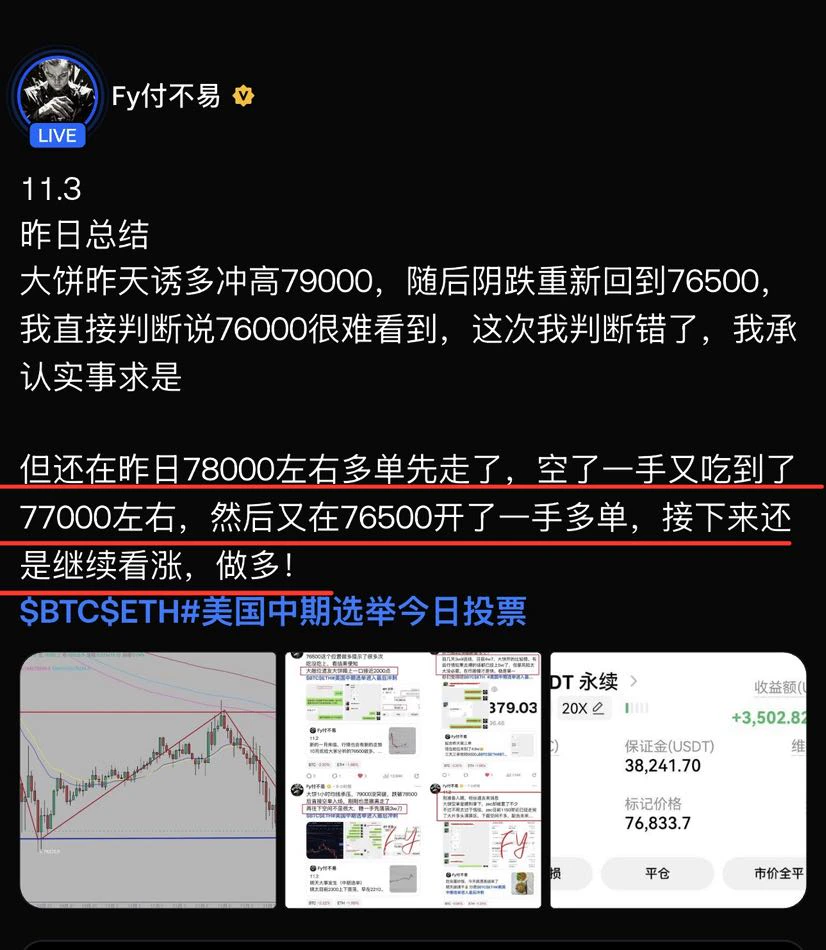
11.3
I took a short-term long position in semiconductors today
And didn’t expect it to pay off
If there are gains to share, let’s share them. Keep your position management aligned with what you know and do
That’s how we can keep moving forward $SOXL #美国中期选举今日投票
FyPaymentMadeEasy
11.3
Long BTC at 76500
The setup shared earlier today has already netted 1,000 points😋
Don’t say you missed it; opportunities only come to those who are prepared
$BTC #美国中期选举今日投票
repost-content-media
SOXL-1.16%
$BR ‌ is showing fresh buying interest, but the real test is still ahead.
Price is back near $0.49 after defending the $0.2917 low. The recent recovery looks encouraging, and buyers are trying to build a base around current levels.
Levels worth watching:
Support: $0.46–$0.47, then $0.4127
Resistance: $0.50, followed by $0.68–$0.69
A clean break above $0.50 could give bulls room to push higher. However, the daily Supertrend remains bearish at $0.6861, so a proper trend reversal still needs confirmation.
BR has made a decent recovery. Now the focus is on whether buyers can sustain it rather tha
BR+6.00%
MU+2.09%
  • 3
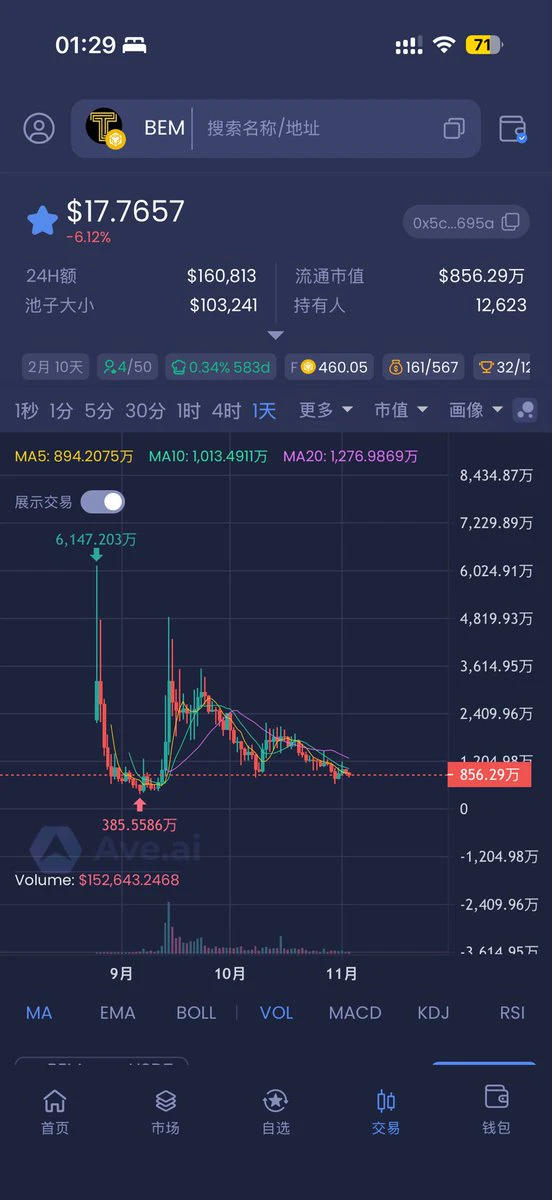
If you don't know, ask: what coin is this?
Why are so many people building it, yet the price keeps falling?
Wasn't this the one that would surpass ETH, punch Vitalik, and kick Satoshi Nakamoto—
the B God???
Come back and take a look in a month $bem
post-image
ETH-1.26%
Guam turning red matters more as a signal than for the seats themselves. If even a place considered a Democratic stronghold can flip, it shows the winds really are shifting for the midterms. Republicans won the governor’s race and a Senate majority, and Trump immediately posted that it was a good omen. That’s a pretty big morale boost. As for whether this can be extrapolated nationwide, we’ll have to wait and see what happens in the next few swing states. I hope I’m wrong this time—if I am, it means the rally still has legs.
post-image
  • 8
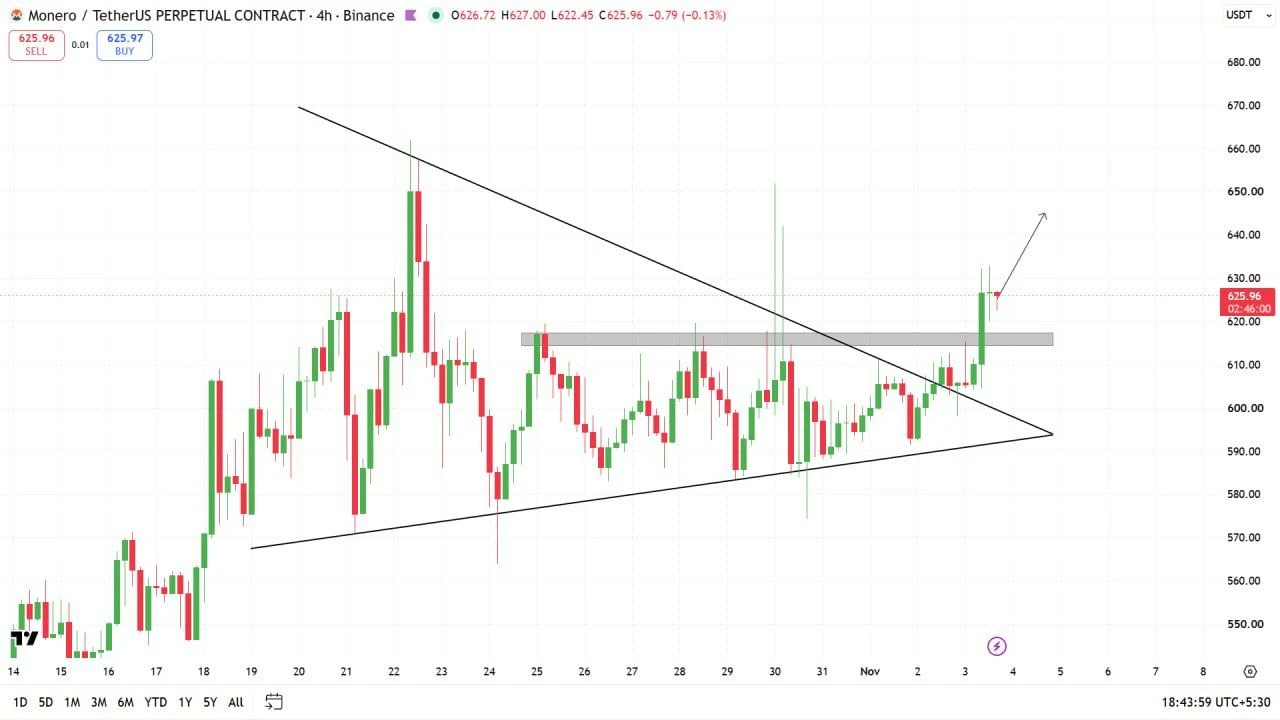
$XMR is making a powerful move, and the bulls are stepping up!
After spending several days trapped inside a tightening triangle, Monero has finally pushed through the upper boundary with strong buying pressure.
The breakout above $615 has changed the short-term market structure, with price now pushing toward $630.
What makes this setup interesting is the breakout from both trendline resistance and a major horizontal supply zone.
As long as buyers defend the $615–$620 region, the bullish momentum could extend toward $640–$650.
A strong 4H close above $630 would add further confirmation, while
post-image
XMR+0.00%
#USMidtermsVoteToday
‍#USMidtermsEnterFinalStretch #ShareWeekly $BTC $ETH $SPX $XAUUSD
The election is today, but markets are already trading amid uncertainty
U.S. midterm elections don't just determine which party gains seats. For investors, the more important question is what the next Congress will be able to pass, block, investigate, or delay.
All 435 seats in the House of Representatives and 35 seats in the Senate are up for election today. But I would be cautious about treating election night as an immediate policy shift. Even after the polls close, it may take days to call some races,
Crypto_Buzz_with_Alex
#USMidtermsVoteToday
‍#USMidtermsEnterFinalStretch #ShareWeekly $BTC $ETH $SPX $XAUUSD
The Election Is Today, But Markets Are Already Trading the Uncertainty
The U.S. midterm elections are not just about which party gains seats. For investors, the bigger question is what the next Congress will be able to approve, block, investigate or delay.
All 435 House seats and 35 Senate seats are being contested today. But I would be careful about treating election night as an instant policy change. Even after voting closes, some races may take days to call, and the political consequences will depend on the final balance in both chambers.
Here is how I am looking at the market impact.
1. Congress Control Is the Starting Point, Not the Whole Story
A change in control of the House, Senate or both could alter the legislative agenda for the remainder of the presidential term.
A divided Congress could make major spending, tax and regulatory legislation harder to pass. It could also bring more oversight, tougher budget negotiations and greater uncertainty around government funding.
A unified Congress could make certain legislative priorities easier to advance, but that still does not guarantee smooth implementation.
The important distinction is between political headlines and actual policy execution. Markets may react to expectations today, but the economic consequences can take months to become visible.
2. Fiscal Policy and Tariffs Could Reach Markets Before Crypto Legislation
I am watching three policy channels.
Government spending and taxes: Changes in fiscal priorities can influence borrowing requirements, Treasury issuance, deficit expectations and bond yields. That matters because yields affect financing costs across the economy.
Trade and tariffs: Tariff uncertainty can affect import costs, corporate margins, supply chains and inflation expectations. Some trade decisions can also come through executive authority, so congressional control is not the only factor.
Crypto regulation: Committee leadership, hearings and legislative priorities can influence the path of digital-asset legislation. A more detailed framework could reduce uncertainty for some businesses, but clearer rules may also bring additional reporting, compliance and operational costs.
For crypto, I would watch actual legislative progress rather than assume an election result immediately changes the regulatory environment.
3. Which Market Could React First?
My focus is on the transmission mechanism, not on predicting a political winner.
U.S. stocks can respond quickly through index futures and sector rotation as investors reassess taxes, trade exposure and corporate earnings.
Gold can react through changes in the dollar, real yields and demand for protection against uncertainty. However, a risk-off move does not guarantee that gold rises every time; higher yields or a stronger dollar can work in the opposite direction.
Crypto may react through broader risk appetite, dollar liquidity and positioning. BTC often becomes the first major reference point, while ETH and other digital assets can show different levels of sensitivity.
I would watch Treasury yields and the dollar alongside all three markets. They can help explain whether a move is being driven by political uncertainty or by changing monetary and liquidity expectations.
4. What My Charts Are Saying
The latest daily chart snapshots show a cautious technical picture:
BTC around $76,770: Resistance near $81,913 and $84,530. Support around $77,020, $76,138 and $75,500. RSI near 34.85, with negative MACD momentum. The market needs to recover resistance before I would call this a convincing reversal.
ETH around $2,497: Nearby resistance around $2,506, with support references at $2,356 and $2,253. RSI near 33.21 and negative MACD suggest buyers still need to prove themselves.
SPXUSDT around $0.3924: Resistance near $0.4047–$0.4170, with support around $0.3896 and then $0.3466. This is the SPXUSDT chart instrument, not the S&P 500 index quoted in index points.
Gold around $3,917.63: The chart shows support near $3,842.85 and a major overhead reference around $4,227.06. RSI near 33.89 and negative MACD indicate weak momentum in this snapshot.
These levels are decision points, not guaranteed targets.
5. My Take: Don't Confuse a Headline Reaction With a Trend
I would not build a trading plan around guessing which party controls Congress. I would build it around what happens after the result becomes clearer.
If stocks stabilize, yields ease, gold finds support and BTC reclaims its resistance zone, that would be a different market message from a situation where yields rise, the dollar strengthens and crypto loses support.
The election may create volatility, but the follow-through in prices, liquidity and policy expectations will matter much more than the first headline.
Not financial advice.
Which signal will you trust most after the election: Congress control, Treasury yields, gold's reaction or BTC reclaiming $82K?
@Gate_Square
repost-content-media
BTC-0.67%
ETH-1.26%
SPX+0.33%
SPX500+0.19%
  • 3
🚀 SUI/USDT Technical Breakdown: Momentum Building Near Key Resistance!
SUI is currently trading at $0.8962, registering a solid +3.09% gain over the past 24 hours. As a prominent Layer 1 blockchain asset, market participants are closely monitoring its price action as it tests critical intraday levels.
📊 24-Hour Market Metrics
Last / Mark Price: $0.8962
24h High: $0.9008
24h Low: $0.8590
24h Volume: 11.35M SUI
24h Turnover: 10.17M USDT
🔍 Technical & Price Action Analysis
Support & Rebound Zones: SUI recently defended a strong local low at $0.8263 and has bounced back nicely
SUI-1.05%
  • 3
  • 2
$SPCX I just came across a set of London Metal Exchange closing data: base metals were almost all weaker, with copper plunging $309 in a single day to $14,036 per ton; aluminum fell $50 to $3,044 per ton; zinc slid $102 to $3,790 per ton; lead edged down $22 to $1,884 per ton; nickel fell $209 to $15,347 per ton; tin posted the steepest decline, shedding $2,224 to close at $47,435 per ton; and cobalt was unchanged at $33,525 per ton. Copper fell 2.47%, while $SPCX bucked the trend and rose 1.22%—a clear divergence. Broad weakness in base metals often reflects cooling demand expectations, a mo
post-image
SPCX+0.78%
XCU+0.20%
XAL-0.51%
XPB-0.23%
XNI+0.01%
7.523M, 370,000 above expectations—JOLTS throws cold water on rate-cut expectations again. The market had broadly expected a figure near 7.15 million, so 370,000 represents a deviation of about 5% from expectations, which is significant for a single month’s data. JOLTS measures more than just “how many jobs are posted”; it also tracks hiring, separations, and the composition of vacancies, so it’s often used to gauge whether labor demand is actually cooling. An increase in vacancies suggests, at the very least, that businesses are still hiring and the labor market hasn’t softened enough for the
post-image
  • 9
Load More

Join 40 M users in our growing community

⚡️ Join 40 M users in the crypto craze discussion

💬 Engage with your favorite top creators

👍 See what interests you

Trending Topics

USMidtermsVoteToday

27.1k Views839 Discussing

The U.S. midterm elections are being held today, with all 435 House seats and 35 Senate seats on the ballot. The results will shape control of Congress and could influence future fiscal, economic and crypto regulatory policy. What are you watching most closely — control of Congress, fiscal policy or crypto regulation? Which market will price in the outcome first: U.S. stocks, gold or crypto?

GateRanksTop2AcrossMultipleCategories

14.85k Views3.06k Discussing

USEarningsSeason

464.05k Views3.36k Discussing

View More