






#PHPCriticalVulnerabilityHitsGovernmentWebsites
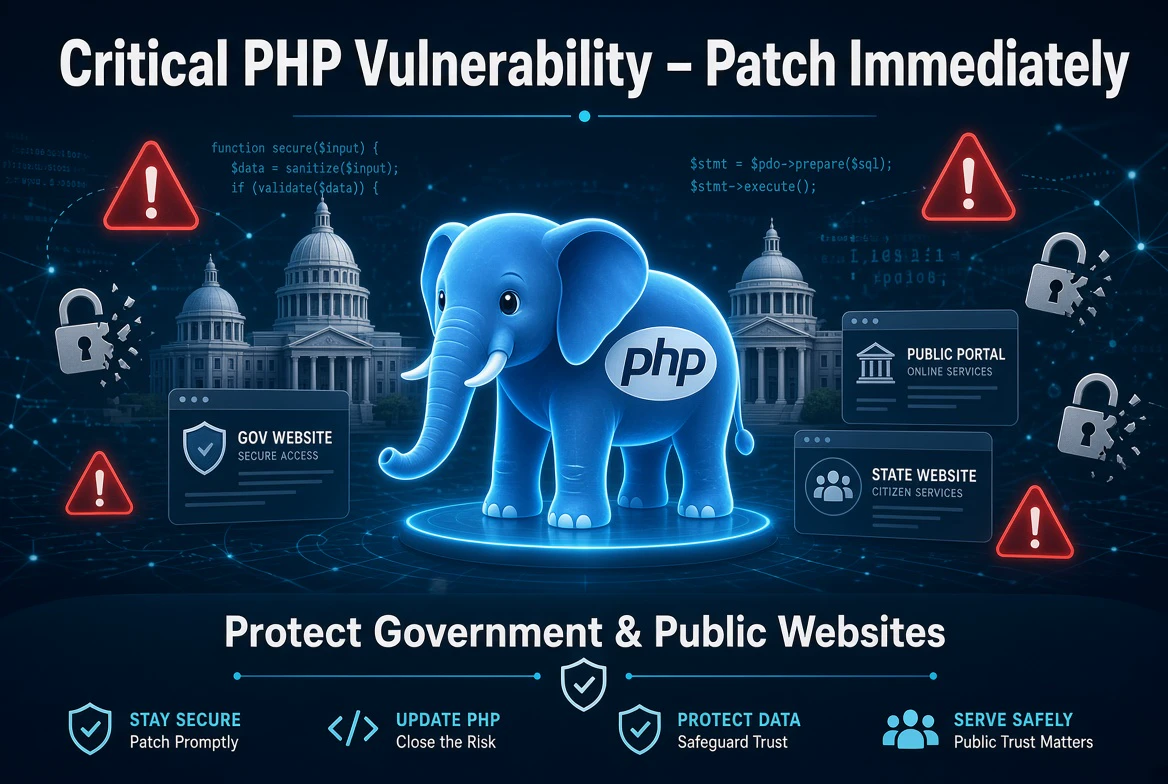
🔐 Critical PHP Vulnerabilities Expose Websites to Serious Cybersecurity Risks
The global cybersecurity community is responding to two critical vulnerabilities discovered in PHP, a technology that powers millions of websites and web applications.
Identified as CVE-2026-109618 and CVE-2026-109619, both vulnerabilities have received a critical severity rating of 9.2 out of 10.
According to the PHP security advisory and cybersecurity agencies, these flaws could allow attackers to execute malicious code on vulnerable servers without authentication. This creates a serious risk for government portals, businesses, educational platforms, and other online services that depend on PHP.
Here is what happened, why it matters, and what organizations should do now.
1. What Is PHP and Why Is It Important?
PHP is an open-source, server-side programming language used to build dynamic websites and web applications. It processes requests, manages sessions, interacts with databases, and helps deliver personalized content.
Popular platforms and applications, including WordPress, Drupal, Joomla, Magento, and Laravel, rely on PHP.
Because PHP is widely deployed, a vulnerability in its core runtime can affect many different applications simultaneously. The problem is not necessarily a weakness in a particular website's design; it can originate in the underlying software that processes its requests.
2. What Are the Two Critical Vulnerabilities?
Both vulnerabilities affect how PHP manages memory and internal request-processing operations.
🔴 CVE-2026-109618 — Out-of-Memory Handling
Under certain conditions, PHP may encounter an out-of-memory error while internal request data is only partially initialized. Improper cleanup can cause the runtime to process inconsistent data, potentially enabling remote code execution.
🔴 CVE-2026-109619 — Stale Internal State
In certain circumstances, PHP may retain internal state that points to memory that has already been released. A subsequent request may interact with this stale state, potentially allowing an attacker to execute unintended code.
Both issues are rated CVSS 9.2, indicating critical severity.
What does unauthenticated remote code execution mean?
It means an attacker may be able to send a specially crafted request over a network and cause a vulnerable server to execute malicious code without first logging in. Depending on the server's permissions and configuration, this could result in unauthorized access, data exposure, website manipulation, or service disruption.
3. Why Are Government Websites at Risk?
Government websites often support essential public services, including citizen portals, document applications, public records, information systems, and administrative services.
If these services use vulnerable PHP installations, attackers may have an opportunity to target the underlying server.
The potential consequences include:
• Unauthorized access to sensitive information.
• Manipulation of website content or official information.
• Disruption of public-facing services.
• Attempts to gain access to connected systems.
• Financial, operational, and reputational damage.
Cybersecurity agencies have issued urgent guidance, while some organizations have considered or implemented temporary isolation of exposed services as a precaution.
Taking a website offline can inconvenience the public, but temporary disruption may be preferable to leaving a highly vulnerable system accessible while remediation is underway.
4. Does This Affect Only Government Websites?
No. This is a broader cybersecurity issue.
Any organization running an affected PHP installation could be at risk, depending on its software version, configuration, and exposure.
Potentially affected environments include:
• Government and public-sector websites.
• WordPress and other content-management systems.
• E-commerce platforms and online payment-related applications.
• Educational and healthcare portals.
• Corporate websites and customer dashboards.
• Hosting servers, containers, and third-party applications that bundle PHP.
The critical lesson is that a website can use a reputable framework and still be vulnerable if the underlying PHP runtime has not been secured.
5. What Are the Risks to Sensitive Data?
The biggest concern is that successful exploitation may give an attacker control over processes running on a vulnerable server.
Depending on the permissions available, an attacker could potentially:
🔹 Access sensitive information available to the compromised process.
🔹 Modify files, website content, or application behaviour.
🔹 Install malicious components or establish unauthorized access.
🔹 Disrupt services or attempt to move into connected systems.
🔹 Expose information held in process memory.
These outcomes are potential consequences, not proof that every vulnerable website has been compromised. Actual impact depends on the environment and the attacker's level of access.
Nevertheless, organizations should treat affected internet-facing systems as a priority because the consequences can extend beyond a single webpage.
6. Which PHP Versions Need Attention?
The PHP project has released security updates for affected supported branches.
Administrators should verify that they are running an appropriate patched release, including:
• PHP 8.2.35
• PHP 8.3.36
• PHP 8.4.27
• PHP 8.5.12
These are the announced fixed releases for the corresponding branches. Later security updates may supersede them, so administrators should install the latest appropriate version available from their official distribution or vendor.
Important: PHP 8.1 and older versions are no longer maintained by the PHP project. Organizations using these versions should check whether their vendor provides a backported security fix and prioritize migration to a supported release.
Updating PHP alone may not be sufficient if an application uses an outdated bundled runtime, container image, or hosting package.
7. What Should Organizations Do Immediately?
Security teams and website operators should follow a clear response plan:
Step 1 — Identify vulnerable systems
Inventory all PHP installations, including production servers, staging environments, containers, hosting control panels, and third-party applications.
Step 2 — Apply official security updates
Upgrade affected systems to the appropriate patched release.
Prioritize public-facing servers and services that process untrusted requests.
Step 3 — Reduce exposure
If immediate patching is impossible, follow official vendor and cybersecurity agency guidance.
Where appropriate, temporarily isolate affected internet-facing services until remediation is complete.
Step 4 — Check for signs of compromise
Review web-server, PHP, authentication, and endpoint logs.
Investigate unexpected processes, unfamiliar files, suspicious outbound connections, and unusual server behaviour.
Step 5 — Verify the fix
Confirm the running PHP version, restart or redeploy services where required, and ensure that the vulnerable runtime is no longer being used.
Step 6 — Prepare for recovery
Maintain tested backups, incident-response procedures, and recovery plans. If compromise is suspected, investigate before assuming that applying a patch alone has resolved the incident.
8. What Should Website Owners and Ordinary Users Know?
If you operate a website, contact your hosting provider or system administrator to confirm whether the PHP runtime has been updated. Managed hosting does not automatically guarantee that every installation or custom application has received the required fix.
If you are an ordinary internet user, you do not need to install PHP security patches on your personal phone or computer simply because you visit a website. The main responsibility rests with the organizations operating affected servers.
Continue to use strong, unique passwords, enable multifactor authentication where available, and remain cautious about suspicious links and unexpected messages.
These practices are valuable, although they do not replace server-side patching.
9. The Bigger Cybersecurity Lesson
This incident demonstrates how a weakness in foundational software can create risks across an entire digital ecosystem.
Modern websites depend on multiple layers of technology:
programming languages, operating systems, databases, web servers, frameworks, and third-party components. A serious flaw in one layer can undermine the security of the overall application.
Rapid patching, responsible disclosure, continuous monitoring, and well-maintained infrastructure are therefore essential—not optional.
Organizations should also avoid assuming that a lack of visible symptoms means their systems are safe. Security requires verification, monitoring, and proactive maintenance.
Final Thoughts: Security Must Come Before Convenience
The PHP vulnerabilities identified as CVE-2026-109618 and CVE-2026-109619 are a serious reminder that even widely trusted technologies require continuous security maintenance.
For government agencies, businesses, developers, and hosting providers, the immediate priorities are clear: identify affected systems, install the appropriate security updates, investigate suspicious activity, and verify that remediation is complete.
For the public, awareness matters—but panic and unverified claims do not help. Follow official advisories, rely on reputable cybersecurity sources, and understand that a vulnerability creates risk without automatically proving that a website has been attacked.
A secure digital ecosystem depends on timely action, responsible reporting, and cooperation between software developers, security researchers, organizations, and users.
Cybersecurity is not a one-time task. It is a continuous responsibility.
🔐 Critical PHP Vulnerabilities Expose Websites to Serious Cybersecurity Risks
The global cybersecurity community is responding to two critical vulnerabilities discovered in PHP, a technology that powers millions of websites and web applications.
Identified as CVE-2026-109618 and CVE-2026-109619, both vulnerabilities have received a critical severity rating of 9.2 out of 10.
According to the PHP security advisory and cybersecurity agencies, these flaws could allow attackers to execute malicious code on vulnerable servers without authentication. This creates a serious risk for government portals, businesses, educational platforms, and other online services that depend on PHP.
Here is what happened, why it matters, and what organizations should do now.
1. What Is PHP and Why Is It Important?
PHP is an open-source, server-side programming language used to build dynamic websites and web applications. It processes requests, manages sessions, interacts with databases, and helps deliver personalized content.
Popular platforms and applications, including WordPress, Drupal, Joomla, Magento, and Laravel, rely on PHP.
Because PHP is widely deployed, a vulnerability in its core runtime can affect many different applications simultaneously. The problem is not necessarily a weakness in a particular website's design; it can originate in the underlying software that processes its requests.
2. What Are the Two Critical Vulnerabilities?
Both vulnerabilities affect how PHP manages memory and internal request-processing operations.
🔴 CVE-2026-109618 — Out-of-Memory Handling
Under certain conditions, PHP may encounter an out-of-memory error while internal request data is only partially initialized. Improper cleanup can cause the runtime to process inconsistent data, potentially enabling remote code execution.
🔴 CVE-2026-109619 — Stale Internal State
In certain circumstances, PHP may retain internal state that points to memory that has already been released. A subsequent request may interact with this stale state, potentially allowing an attacker to execute unintended code.
Both issues are rated CVSS 9.2, indicating critical severity.
What does unauthenticated remote code execution mean?
It means an attacker may be able to send a specially crafted request over a network and cause a vulnerable server to execute malicious code without first logging in. Depending on the server's permissions and configuration, this could result in unauthorized access, data exposure, website manipulation, or service disruption.
3. Why Are Government Websites at Risk?
Government websites often support essential public services, including citizen portals, document applications, public records, information systems, and administrative services.
If these services use vulnerable PHP installations, attackers may have an opportunity to target the underlying server.
The potential consequences include:
• Unauthorized access to sensitive information.
• Manipulation of website content or official information.
• Disruption of public-facing services.
• Attempts to gain access to connected systems.
• Financial, operational, and reputational damage.
Cybersecurity agencies have issued urgent guidance, while some organizations have considered or implemented temporary isolation of exposed services as a precaution.
Taking a website offline can inconvenience the public, but temporary disruption may be preferable to leaving a highly vulnerable system accessible while remediation is underway.
4. Does This Affect Only Government Websites?
No. This is a broader cybersecurity issue.
Any organization running an affected PHP installation could be at risk, depending on its software version, configuration, and exposure.
Potentially affected environments include:
• Government and public-sector websites.
• WordPress and other content-management systems.
• E-commerce platforms and online payment-related applications.
• Educational and healthcare portals.
• Corporate websites and customer dashboards.
• Hosting servers, containers, and third-party applications that bundle PHP.
The critical lesson is that a website can use a reputable framework and still be vulnerable if the underlying PHP runtime has not been secured.
5. What Are the Risks to Sensitive Data?
The biggest concern is that successful exploitation may give an attacker control over processes running on a vulnerable server.
Depending on the permissions available, an attacker could potentially:
🔹 Access sensitive information available to the compromised process.
🔹 Modify files, website content, or application behaviour.
🔹 Install malicious components or establish unauthorized access.
🔹 Disrupt services or attempt to move into connected systems.
🔹 Expose information held in process memory.
These outcomes are potential consequences, not proof that every vulnerable website has been compromised. Actual impact depends on the environment and the attacker's level of access.
Nevertheless, organizations should treat affected internet-facing systems as a priority because the consequences can extend beyond a single webpage.
6. Which PHP Versions Need Attention?
The PHP project has released security updates for affected supported branches.
Administrators should verify that they are running an appropriate patched release, including:
• PHP 8.2.35
• PHP 8.3.36
• PHP 8.4.27
• PHP 8.5.12
These are the announced fixed releases for the corresponding branches. Later security updates may supersede them, so administrators should install the latest appropriate version available from their official distribution or vendor.
Important: PHP 8.1 and older versions are no longer maintained by the PHP project. Organizations using these versions should check whether their vendor provides a backported security fix and prioritize migration to a supported release.
Updating PHP alone may not be sufficient if an application uses an outdated bundled runtime, container image, or hosting package.
7. What Should Organizations Do Immediately?
Security teams and website operators should follow a clear response plan:
Step 1 — Identify vulnerable systems
Inventory all PHP installations, including production servers, staging environments, containers, hosting control panels, and third-party applications.
Step 2 — Apply official security updates
Upgrade affected systems to the appropriate patched release.
Prioritize public-facing servers and services that process untrusted requests.
Step 3 — Reduce exposure
If immediate patching is impossible, follow official vendor and cybersecurity agency guidance.
Where appropriate, temporarily isolate affected internet-facing services until remediation is complete.
Step 4 — Check for signs of compromise
Review web-server, PHP, authentication, and endpoint logs.
Investigate unexpected processes, unfamiliar files, suspicious outbound connections, and unusual server behaviour.
Step 5 — Verify the fix
Confirm the running PHP version, restart or redeploy services where required, and ensure that the vulnerable runtime is no longer being used.
Step 6 — Prepare for recovery
Maintain tested backups, incident-response procedures, and recovery plans. If compromise is suspected, investigate before assuming that applying a patch alone has resolved the incident.
8. What Should Website Owners and Ordinary Users Know?
If you operate a website, contact your hosting provider or system administrator to confirm whether the PHP runtime has been updated. Managed hosting does not automatically guarantee that every installation or custom application has received the required fix.
If you are an ordinary internet user, you do not need to install PHP security patches on your personal phone or computer simply because you visit a website. The main responsibility rests with the organizations operating affected servers.
Continue to use strong, unique passwords, enable multifactor authentication where available, and remain cautious about suspicious links and unexpected messages.
These practices are valuable, although they do not replace server-side patching.
9. The Bigger Cybersecurity Lesson
This incident demonstrates how a weakness in foundational software can create risks across an entire digital ecosystem.
Modern websites depend on multiple layers of technology:
programming languages, operating systems, databases, web servers, frameworks, and third-party components. A serious flaw in one layer can undermine the security of the overall application.
Rapid patching, responsible disclosure, continuous monitoring, and well-maintained infrastructure are therefore essential—not optional.
Organizations should also avoid assuming that a lack of visible symptoms means their systems are safe. Security requires verification, monitoring, and proactive maintenance.
Final Thoughts: Security Must Come Before Convenience
The PHP vulnerabilities identified as CVE-2026-109618 and CVE-2026-109619 are a serious reminder that even widely trusted technologies require continuous security maintenance.
For government agencies, businesses, developers, and hosting providers, the immediate priorities are clear: identify affected systems, install the appropriate security updates, investigate suspicious activity, and verify that remediation is complete.
For the public, awareness matters—but panic and unverified claims do not help. Follow official advisories, rely on reputable cybersecurity sources, and understand that a vulnerability creates risk without automatically proving that a website has been attacked.
A secure digital ecosystem depends on timely action, responsible reporting, and cooperation between software developers, security researchers, organizations, and users.
Cybersecurity is not a one-time task. It is a continuous responsibility.