Share your thoughts
placeholder
Article
After $CL broke above the previous high, it did not accelerate immediately but instead quickly pulled back. I treated the breakout level as a key reference level and entered a long position when the pullback held above it. This is a standard breakout-pullback confirmation; as long as this level holds, the logic remains unchanged.

After entry, the price did not continue pulling back and instead rose directly. During the first surge, I took profits on 70% as planned, while gradually moving the stop-loss higher on the remaining 30% to let the profits run.

The biggest taboo during this process
post-image
CL+0.87%
ZEC+1.89%
SOL-0.57%
#Gate60MillionUsers
I’m sharing with you what I experienced myself. I remember my first trade on Gate very well. I sat in front of my phone, watched the chart, and pretended I was completely calm. Even though one thought kept spinning around inside: “Anya, are you really doing this right now?” — “Well, what’s there to be afraid of? I checked everything.” 😂 To be honest, I kept my finger over the button for several minutes before finally working up the courage. It’s funny to remember now, but back then that first trade seemed almost like the most important decision of the century.
Before ente
TSLA+3.99%
  • 2
Insiders are calling SYMBOL a trap right as the setup locks in.

$SOL /USDT - SHORT

Trade Plan:
Entry: 102.74 – 103.18
SL: 105.08
TP1: 101.37
TP2: 100.30
TP3: 98.71

Why this setup?
Why now? The daily trend is range-bound, which often precedes a sharp directional break, and the 1h ATR of 0.88533 tells us volatility is expanding enough to fuel a move. The 15m RSI at 42.91 shows momentum tilting bearish without being oversold, suggesting room for further downside. Entry is defined by the 1h price holding the 102.96 reference, with the zone between 102.74 and 103.18 acting as the trigger. TP1
SOL-0.57%
Everyone is still calling SYMBOL bearish, but the 1h setup just flipped.

$ESPORTS /USDT - LONG

Trade Plan:
Entry: 0.01345 – 0.01353
SL: 0.01299
TP1: 0.01386
TP2: 0.01411
TP3: 0.01448

Why this setup?
Why now? The daily trend remains bearish, yet the 1h price is holding at 0.01349 inside a tight entry zone between 0.01345 and 0.01353. The 15m RSI sits at 30.62, signaling oversold exhaustion while the 1h ATR of 0.000159 confirms the move has real volatility behind it. The long invalidation level is 0.01449, which acts as the hard line in the sand for this trade. If price pushes past 0.01449
ESPORTS-5.06%
I was just about to head to the forum and rage-post, but then I looked at my position and thought, forget it—the market is always right.
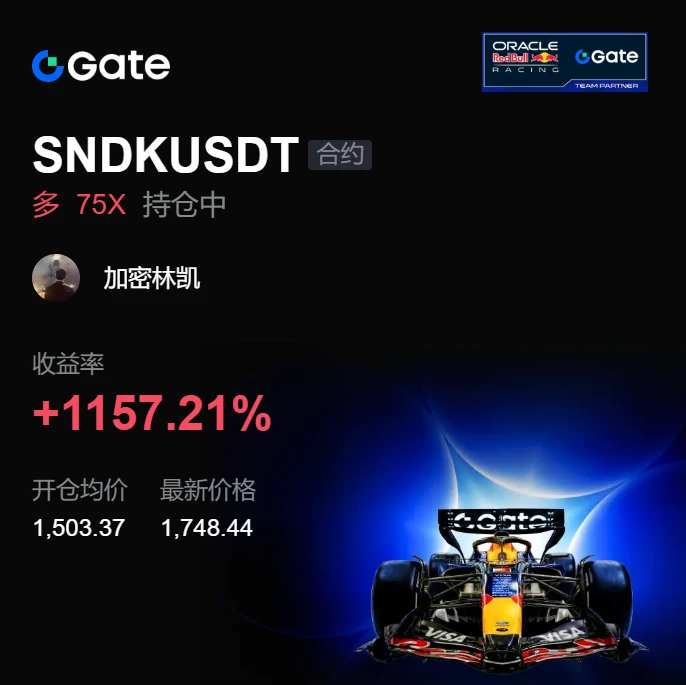
The intraday plunge was indeed pretty scary, but watching the volume on $SNDK , I noticed that the further it fell, the more volume contracted, while the bids below kept getting thicker. It was clearly someone accumulating amid the panic. Once I had a read on it, I went straight in and entered a one-lot long position at 1503.37.
The market didn’t disappoint. The current price climbed all the way to 1748.15, taking the position’s profit directly to +1158.48%. T
post-image
SNDK-2.21%
ZEC+1.89%
SOL-0.57%
#GateEventContractTradeSharingChallenge
🔥 DON’T PREDICT THE MARKET. PREPARE FOR BOTH SIDES.
Crypto markets can change direction in minutes. One headline can move Bitcoin thousands of dollars, while one technical breakout can completely change market sentiment.
That is exactly why I find the Gate Event Contract Trade-Sharing Challenge interesting.
Instead of making random predictions, I want to build a structured market thesis based on price levels, momentum, macro conditions, sentiment and confirmation.
The current campaign runs from August 31 to September 10, 2026, giving traders an opportu
Insiders are quietly pressing short on SYMBOL while the daily trend refuses to break its range.

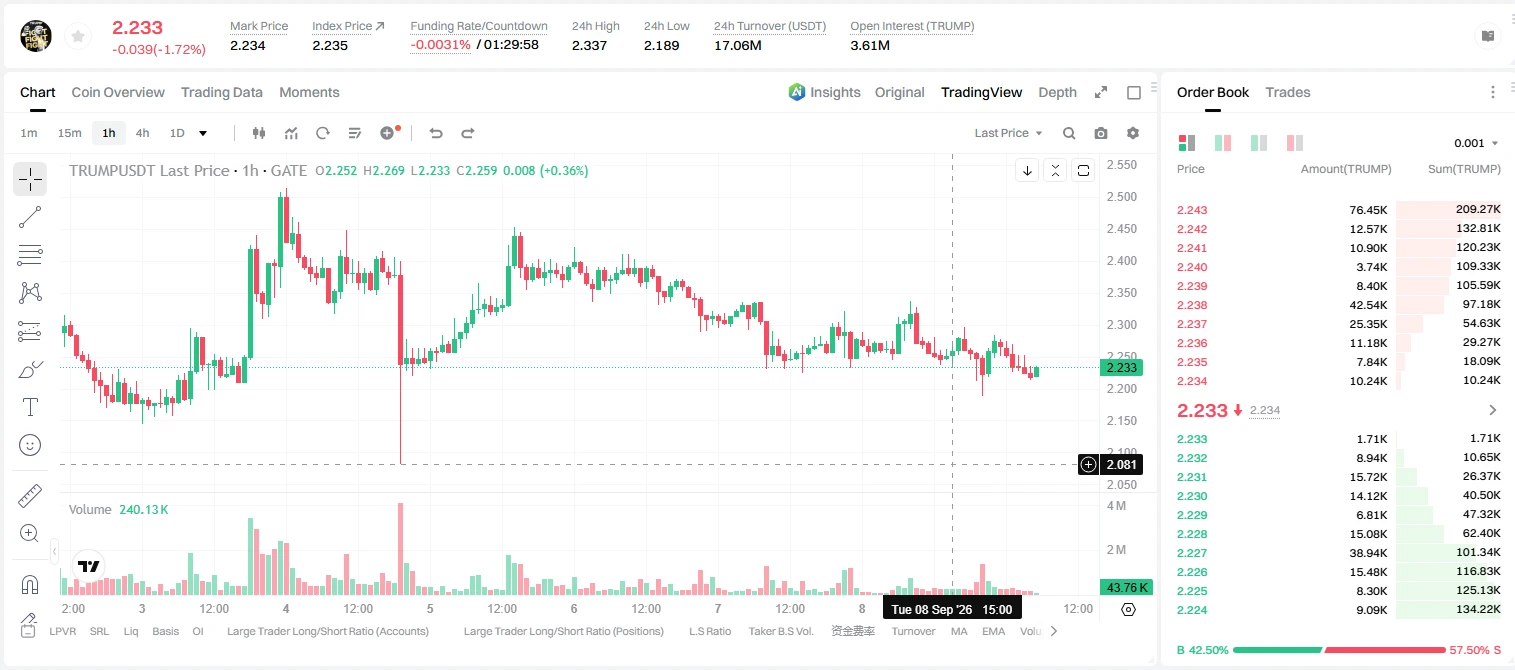
$TRUMP /USDT - SHORT

Trade Plan:
Entry: 2.226 – 2.242
SL: 2.312
TP1: 2.176
TP2: 2.137
TP3: 2.078

Why this setup?
Why now? The 1h price is pinned at 2.234 inside a tight entry zone of 2.226 to 2.242, and the 1h ATR of 0.032403 signals compressed volatility that often precedes a sharp move. The 15m RSI sitting at 43.53 shows bearish momentum without being overextended, giving the short room to breathe. The 1d trend holding range means the upper boundary is acting as resistance, and the invalidat
post-image
TRUMP-1.63%
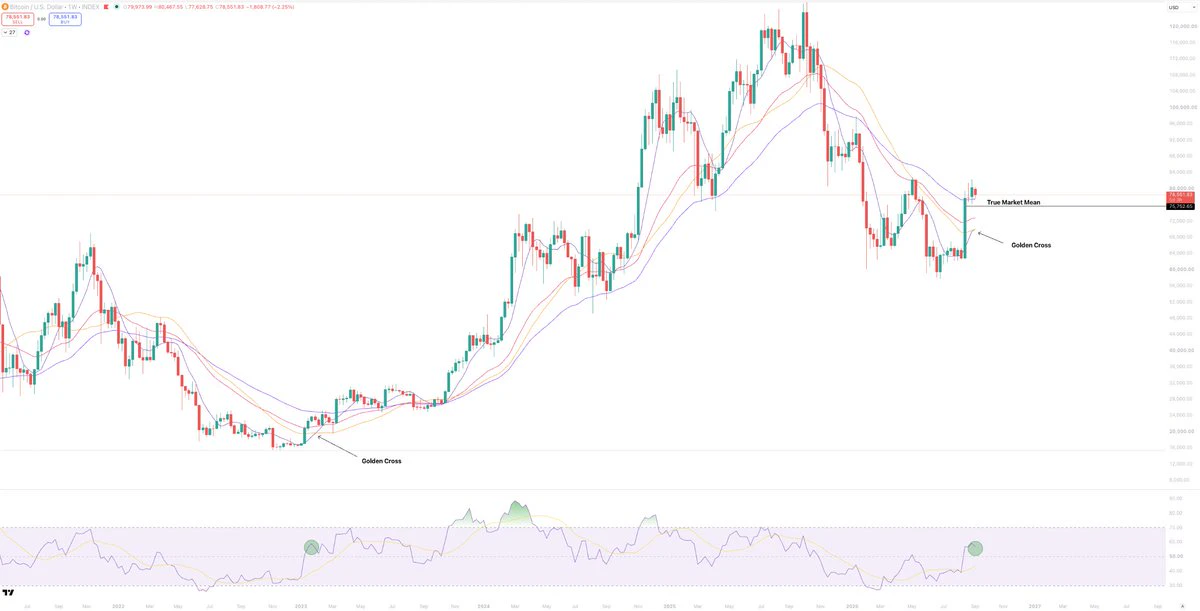
The bottom is now fully confirmed.
The bulls have now reclaimed:
- 1D 200 SMA + EMA
- 1W 50EMA
- True market mean
- 1W Supertrend
- 1W RSI above 55
- Golden cross
- 1M higher high close
Some of these levels could be taken at lost again, but not all of them together.
Even just the 1D 200 SMA + EMA being reclaimed has been enough to confirm the bottom, in every cycle.
But we now have much higher up levels also.
Historically, when all of these bullish reclaims have happened together, the bottom has always been firmly confirmed, every single time.
We haven't taken the 1W 50SMA yet, but this
post-image
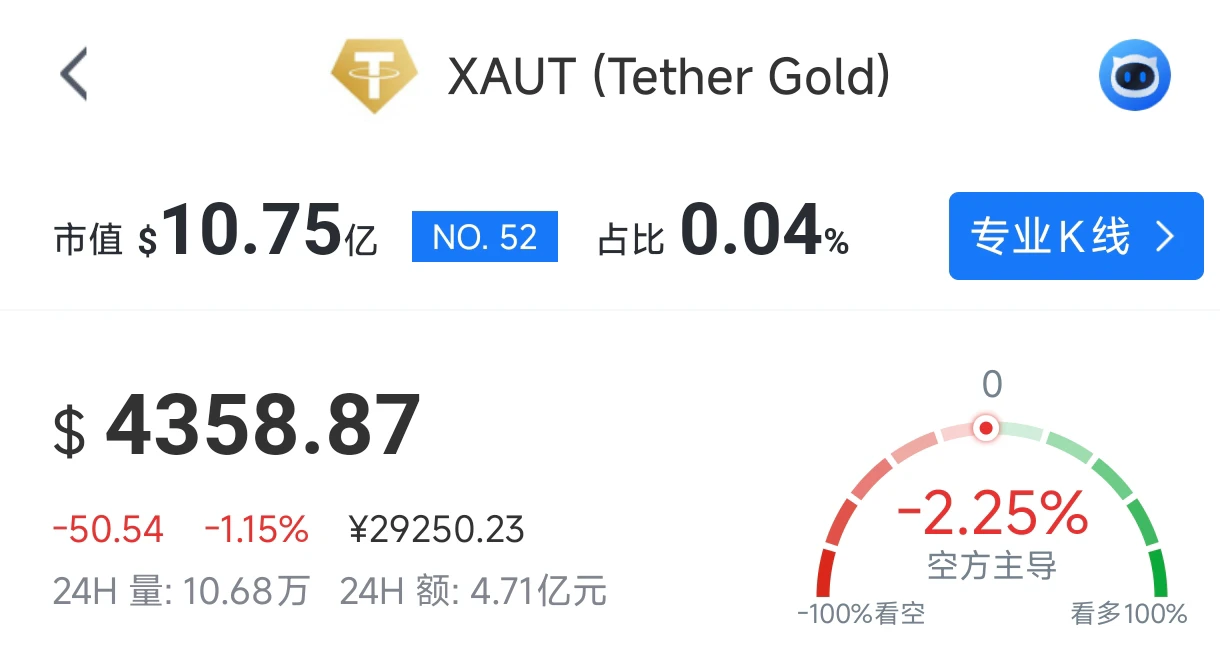
XAUT Strategy and Trading Recommendations

Current price: 4359. After rising intraday and encountering resistance, the price has pulled back, with bearish momentum gradually being released and the market entering a short-term pressured state.

On the four-hour timeframe, upside momentum has clearly weakened after consecutive rallies, and the price is trading under pressure below the short-term moving averages. MACD bullish volume continues to contract, while RSI has turned downward from high levels. The broader medium- to long-term trend has not completely reversed, but short-term pullback a
post-image
XAUT-1.23%
Nobody is talking about the SYMBOL setup hiding inside this bullish trend, and the numbers are too clean to ignore.

$ETH /USDT - LONG

Trade Plan:
Entry: 2475 – 2483
SL: 2438
TP1: 2510
TP2: 2531
TP3: 2562

Why this setup?
Why now? The daily trend is firmly bullish, giving us macro direction while the 1h price sits at 2479 with a 15m RSI of 46.98 showing room to run before overbought. The 1h ATR of 17.240717 means this move has real momentum without being overextended, placing entry between 2475 and 2483 as a defined zone where buyers are stepping in. We target TP1 at 2510 first, then exten
ETH-0.18%
The early bird catches the worm.
live-cover
LIVE82
market overview
live-cover
LIVE77
I wasn't even expecting to break even, but it went straight into profit for me. This service is seriously on point.

While everyone was still watching from the sidelines, $BTC got dumped again. Bearish news was flooding the screens, and the chart looked pretty bad, but I watched the key level hold firm. Instead, funds kept buying as the price fell. This was the kind of setup where you had to be brave, so I went long.

Looking back, I entered at 77595.4, and the current price is 78473.06. This was a textbook retest wick followed by an engulfing reversal. +193.94% safely in the bag—the wait wa
post-image
BTC-0.78%
DOGE-0.60%
ETH-0.18%
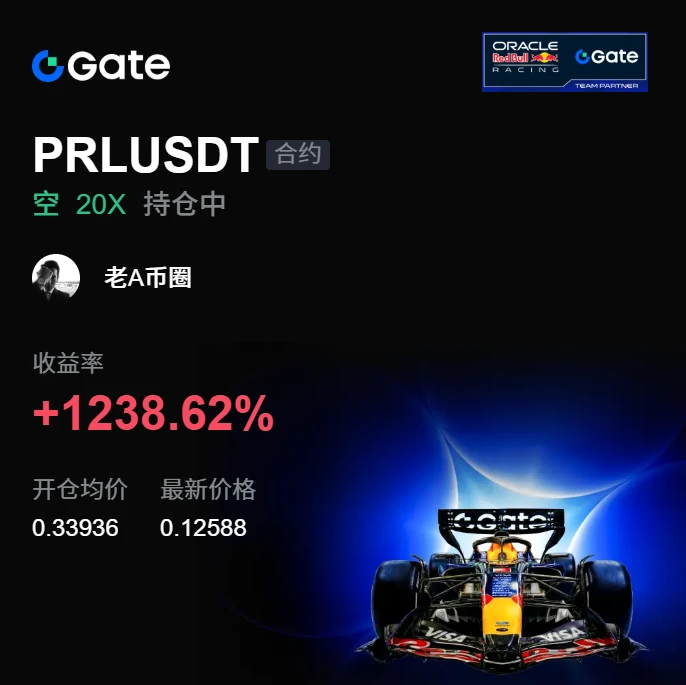
Originally, I was going to close the position and call it a day, but it turned around on its own and handed the profits back. During the intraday plunge, the rebound was weak, and every push higher fell just short. Looking at the chart, I had only one thought: the bull trap was obvious—don't take the bait. The high-level short I flagged a few afternoons ago was opened at 0.33936 and is now at 0.12588, with +1238.62% unrealized profit sitting there. It was truly sluggish at first, but the move that followed was truly satisfying. In terms of execution, take 80% off the table first, protect the r
post-image
BNB+1.88%
ADA+0.14%
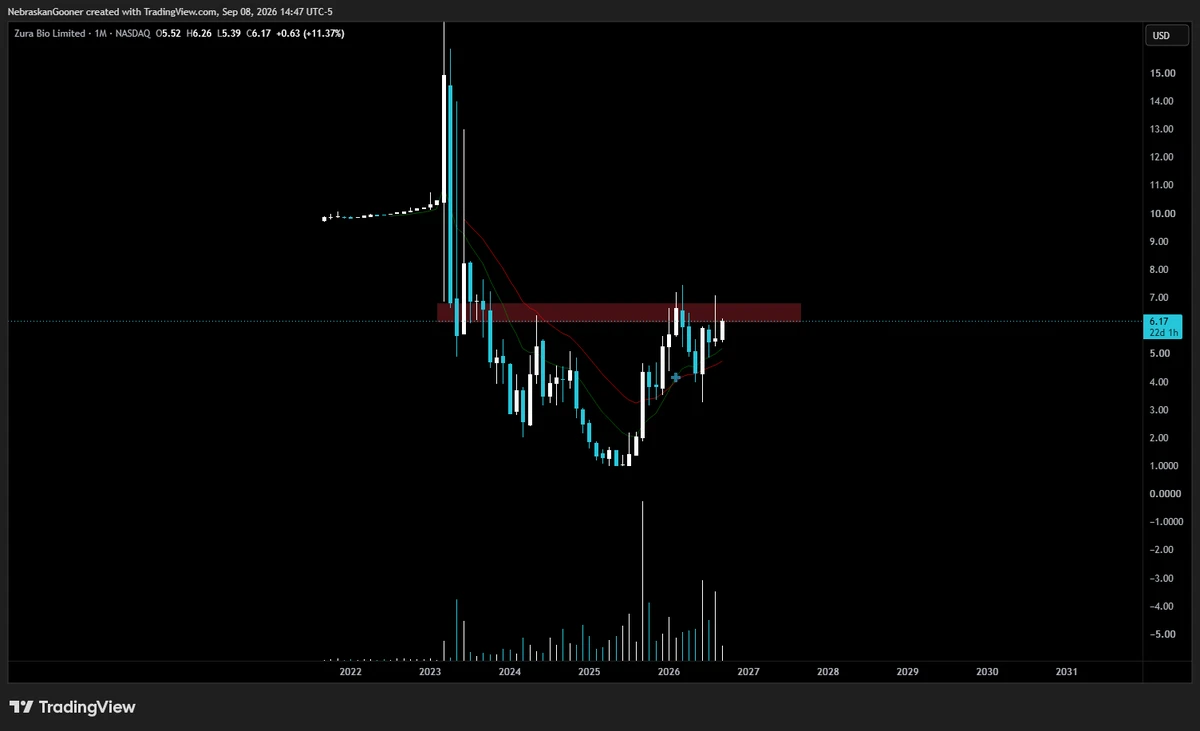
$ZURA (per request)
Assumably a low cap.. but if it gets above $6.50 it might have a nice run.
post-image
Gold trading strategy: follow it and you’d be making a killing. I woke up, opened my eyes, and saw that gold had crashed badly. Are they really going to raise interest rates??? What do you think??? Discussion welcome. Correct answers will be rewarded with 100U!!!
GLDX-1.29%
PAXG-1.17%
XAU-1.27%
I’m joining the Mooniez from the dark side of the moon. @MooniezHQ
$FORM Breakout imminent! Technical indicators have all formed golden crosses—are you on board? Where’s the next target?#Gate.io 🔥🚀
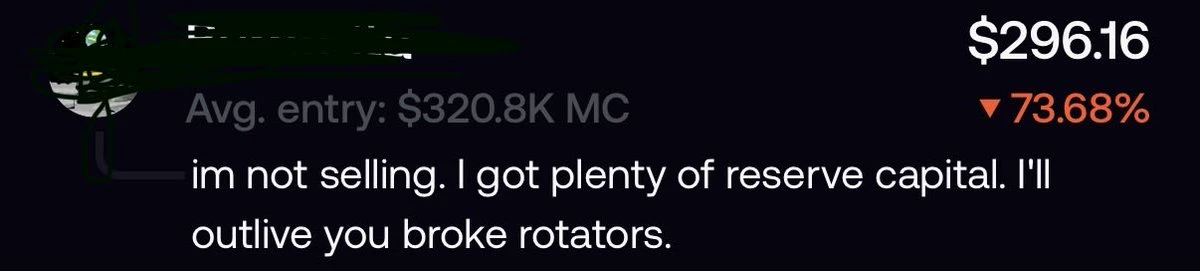
he’s bluffing btw, he has no stables left
post-image
I didn’t chase the short when the large bearish candle broke below the previous low, as this area is most likely to see a rebound that sweeps traders out. I waited for a rebound toward the key moving-average level before shorting $CHIP . Entering below the key level kept the stop-loss small if wrong, making the risk-reward favorable.

The first test of resistance was followed by a rapid pullback, so I used 20% of my position to test a short. The market then surged again, and the false breakout stopped out the initial position. I didn’t reverse into a long after being stopped out, as the moving
post-image
CHIP-2.34%
BNB+1.88%
ETH-0.18%
Load More

Join 40 M users in our growing community

⚡️ Join 40 M users in the crypto craze discussion

💬 Engage with your favorite top creators

👍 See what interests you