Dragon_fly3

vip
Active for: 0.5y
Peak Tier 0
No content yet
#AugustCoreCPIBeatsExpectations #每周来晒 #8月CPI数据出炉
August CPI did not deliver a simple bullish or bearish answer for the market. That is exactly why traders should pay attention.
U.S. CPI increased 0.4% month over month in August, while annual inflation remained at 3.4%, unchanged from the previous reading. Both headline figures were broadly in line with expectations.
At first glance, an in-line CPI report may look like a non-event.
I disagree.
The real question is not whether CPI beat or missed expectations.
The real question is what this inflation picture does to Federal Reserve expectations,
Great job good information
Dubai_Prince
[Ended] US IRAN TALKS
08-11 16:01718 views
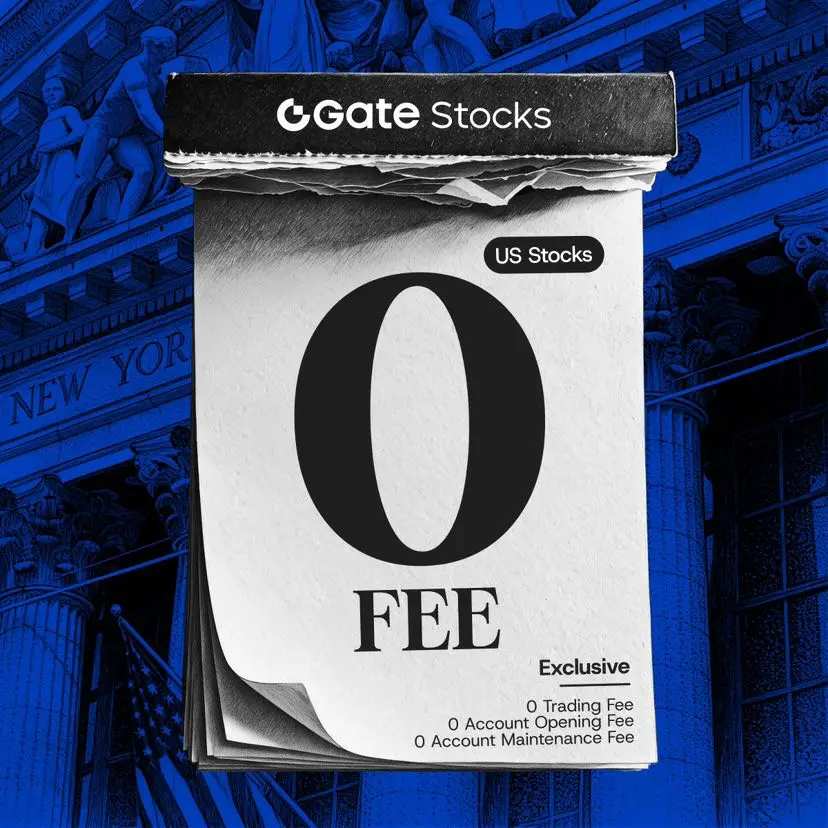
Global exclusive|Gate stock trading with order execution, follow-trading transactions at 0 fees
Whether you trade on your own, use stock order execution, or follow an outstanding order leader, you can enjoy 0 fees on Gate US stock trading:
✅ Buy commission fee 0
✅ Sell commission fee 0
✅ Account opening fee $0
✅ No minimum trading commission fee threshold
Lower costs to participate in US stock and popular ETF trading, making each strategy execution more efficient.
**Warm reminder:** Settlement fees, regulatory fees (such as SEC charges, TAF) and third-party fees such as ADR custody fees will b
HighAmbition
Global exclusive|Gate stock trading with order execution, follow-trading transactions at 0 fees
Whether you trade on your own, use stock order execution, or follow an outstanding order leader, you can enjoy 0 fees on Gate US stock trading:
✅ Buy commission fee 0
✅ Sell commission fee 0
✅ Account opening fee $0
✅ No minimum trading commission fee threshold
Lower costs to participate in US stock and popular ETF trading, making each strategy execution more efficient.
**Warm reminder:** Settlement fees, regulatory fees (such as SEC charges, TAF) and third-party fees such as ADR custody fees will be collected on behalf of users by the platform based on the actual executed trades; the specific amount will be determined by the order details and the bill.
Fee details: https://www.gate.com/fee
Full announcement: https://www.gate.com/announcements/article/100928
#GateStocksZeroFees
repost-content-media
#BTC
Bitcoin is trading around $63,600 to $64,000 as of late July 2026, roughly in line with the price you mentioned. This is a market that has spent a long time consolidating between $60,000 and $66,000, and that range behavior is telling. Since the sharp June selloff that printed a fresh 21-month low near $58,000 on about June 30, Bitcoin has recovered roughly a 10% to 11% bounce off that floor to reclaim the mid-63,000 zone. The July 22 peak reached around $66,601, and from that high the price pulled back toward $64,000, meaning it has given back roughly 3.9% to 4% from that peak. The mont
HighAmbition
#BTC
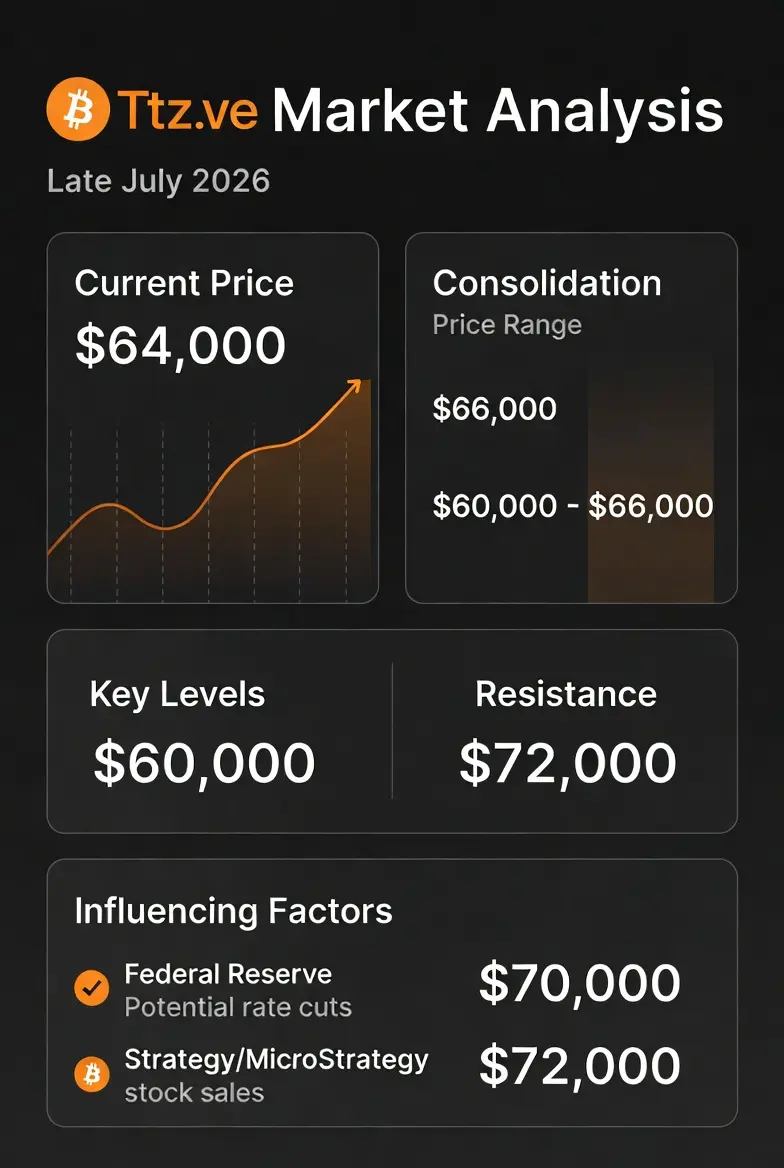
Bitcoin is trading around $63,600 to $64,000 as of late July 2026, roughly in line with the price you mentioned. This is a market that has spent a long time consolidating between $60,000 and $66,000, and that range behavior is telling. Since the sharp June selloff that printed a fresh 21-month low near $58,000 on about June 30, Bitcoin has recovered roughly a 10% to 11% bounce off that floor to reclaim the mid-63,000 zone. The July 22 peak reached around $66,601, and from that high the price pulled back toward $64,000, meaning it has given back roughly 3.9% to 4% from that peak. The monthly open was near $59,394, and price is still about 7% to 8% above that opening level, which preserves the broader short-term uptrend despite the cooling momentum. What you are observing is a textbook post-rally consolidation: the market recovered strongly off the lows but has lacked the conviction, volume, and institutional flows to break the upper wall of the range.
Can Bitcoin Touch 70K, and When?
The honest answer is that $70,000 is not imminent, and a sustained breakout requires specific catalysts. Technically, resistance is stacked tightly: starting near $65,100, then $66,500 to $66,700, then $68,000, and only beyond that do we approach the $70,000 to $70,721 zone. The nearest resistance at $65,104 is only about 2% above current price, and $66,500 to $67,000 is roughly 4% to 5% higher. So before 70K, Bitcoin has to clear three technical walls, which is why the range is confining. Analyst Michael van de Poppe has suggested that if buyers regain control and hold above $60,876 support, a move to $65,500 to $66,000 becomes likely, with a possible push toward $70,000 within one to two weeks, contingent on momentum. However, this is the optimistic case. The bearish technicals are also heavy: Bitcoin currently sits below both the 50-day and 200-day exponential moving averages, the moving average convergence divergence has a confirmed bearish crossover with a negative histogram, on-balance volume is falling which signals distribution rather than accumulation, and a double-top pattern is in play that targets lower levels if it confirms. The measured move analysis suggests that if the double top resolves downward and $60,000 support breaks, the next structural floor is near $57,964, and a loss of $58,000 could expose the $53,000 region, which would represent about a 17% decline from current levels and roughly 27% below the October 2025 all-time high of $126,400.
Fed Decision Impact
The Federal Reserve held interest rates unchanged at 3.50% to 3.75% at its July 29 meeting, which was fully expected by markets, with prediction markets pricing roughly an 82% to 93% probability of a hold beforehand. Bitcoin's reaction was muted: it rose only about 1% to roughly $64,402 after the announcement. The bigger story is the hawkish tone. Fed Chair Kevin Warsh emphasized rigorous review and low tolerance for persistent inflation, signaling that rate cuts are effectively off the table for the near term. Most importantly, three of the twelve FOMC members actually preferred a quarter-point rate hike at this meeting, which is notable dissent and shows internal pressure for tighter policy. When the Fed holds rates as expected, it removes one major near-term risk, which is mildly positive for stability. But the problem for crypto is that a hold with hawkish language keeps real yields elevated and keeps liquidity conditions tight. Historically, rate cuts are favorable for Bitcoin because they inject liquidity and drive risk appetite, while high rates and high bond yields draw capital away from risk assets. With cuts pushed out, that liquidity tailwind is absent, and that is one of the central reasons Bitcoin has struggled to break $66,000 even after recovering off its lows. The market is effectively waiting on inflation readings, jobs data, and the September meeting, since that September gathering will include fresh economic projections and a revised dot plot. Until the Fed gives a clearer signal, macro headwinds will keep capping rallies and make the 60K to 66K range sticky.
The Strategy 8.2 Billion Loss and Its Real Impact
Strategy, formerly MicroStrategy, reported an $8.22 billion net loss for Q2 2026, driven by an $8.32 billion unrealized loss on its Bitcoin holdings. This is the single biggest overhang the market is talking about, and it is worth understanding precisely. As of June 30, Strategy held 846,000 Bitcoin with a carrying value of $49.67 billion against a total acquisition cost of $63.94 billion, implying an average purchase price of roughly $75,578 per coin. Since Bitcoin closed the quarter near $58,800, well below that cost basis, the company is sitting on roughly $10.7 billion in paper losses below its breakeven. Crucially, this $8.32 billion is almost entirely an accounting entry under FASB rules, not real cash leaving the company; no Bitcoin was sold to generate that figure, and the bulk is unrealized. But the real market impact comes from the behavioral shift. Strategy has pivoted from its long-held buy-and-hold philosophy to active treasury management. In early July it sold 3,588 Bitcoin for about $216 million, its largest disposal ever, to fund preferred stock dividend obligations. It introduced a Bitcoin Monetization Program authorizing up to $1.25 billion in additional sales, and it paused buying for about five weeks while raising capital through stock offerings instead. So far this has been modest in scale, about 0.42% of its treasury for one quarter of preferred dividends, which is why many analysts like Dave Weisberger argue the sale is a bigger deal for the MSTR stock than for the Bitcoin price itself. The absorption was smooth and liquidity proved deep. But the psychological and supply-side angle matters: the single largest corporate holder in the world is no longer purely accumulating, it is now a potential seller when it needs cash, and the authorized $1.25 billion plus $2 billion buyback framework gives it room to sell more. That overhang, combined with the fact that the company still holds roughly 4% of Bitcoin's total supply cap, injects a persistent source of selling pressure into a market that lacks a clear macro catalyst. It is not a collapse trigger at current small sale sizes, but it is a meaningful psychological headwind and it removes one of the strongest institutional HODL narratives.
My Own Assessment and What to Watch
Pulling it all together, I would frame this as a market caught between a well-defined floor near $60,000 to $62,000 and a resistance ceiling in the $66,500 to $68,000 zone. The most likely near-term path is continued range-bound trading, meaning around 5% to 7% of upside to the top of the range and roughly 5% to 6% downside to the floor from current levels. For a real 70K breakout, I would want to see three things converge: sustained positive spot ETF inflows rather than the current flat to negative flows, a break and confirmed close above $66,600, and either Fed communication turning more dovish or a hotter market narrative. Without those, expecting 70K within the next couple of weeks is optimistic. A confirmed close above $66,500 to $66,700 opens the path toward $68,000, then $70,000, roughly 10% above current price, and a dovish shock plus strong inflows could push toward $72,000. Conversely, losing $60,000 to $62,000 support would be a genuine bearish trigger pointing back toward $58,000 and potentially the $53,000 area. The key sentiment indicator to watch is ETF flow data and the Fear and Greed reading, alongside liquidation data. In terms of my own view, the range is likely to persist for the short term, with upside bias only if institutional flows return and support holds. I would not treat 70K as a near-term certainty, but rather as a target that becomes reachable only after the range top falls. If the September Fed meeting and inflation data turn favorable, that is the more realistic window for a sustained push toward and above 70K rather than the coming days. This is not financial advice, and crypto remains highly volatile, but those are the objective levels, catalysts, and risks shaping the picture.
#StrategyReports8.2BQuarterlyLoss @Gate_Square
#FedHoldsRatesSteady
repost-content-media
Gate Square Certified Creator Program Upgrade: Share $100,000+ in Monthly Rewards!
📌 How to Join
• Existing creators: Get the Certified Creator Badge to join automatically.
• New creators: Apply here 👉️ https://www.gate.com/questionnaire/7698
🎁 Creator Rewards
1️⃣ First Post Bonus: New & returning creators can earn $50 for their first post.
2️⃣ Weekly Rewards: Complete posting tasks and share $10,000 in rewards.
3️⃣ Monthly Rewards: Complete monthly tasks and share $100,000+.
4️⃣ Exclusive Perks: Access creator-only campaigns, tasks, and special gifts.
Create, grow, and get rewarded on Gate
HighAmbition
Gate Square Certified Creator Program Upgrade: Share $100,000+ in Monthly Rewards!
📌 How to Join
• Existing creators: Get the Certified Creator Badge to join automatically.
• New creators: Apply here 👉️ https://www.gate.com/questionnaire/7698
🎁 Creator Rewards
1️⃣ First Post Bonus: New & returning creators can earn $50 for their first post.
2️⃣ Weekly Rewards: Complete posting tasks and share $10,000 in rewards.
3️⃣ Monthly Rewards: Complete monthly tasks and share $100,000+.
4️⃣ Exclusive Perks: Access creator-only campaigns, tasks, and special gifts.
Create, grow, and get rewarded on Gate Square!
Details: https://www.gate.com/announcements/article/100944
repost-content-media
#SNDK
At the time of writing, SNDK/USDT is trading near 1,341.8, holding slightly above the previous session after an exceptionally volatile month. The perpetual contract has experienced one of the most dramatic price swings across the AI infrastructure and semiconductor sector in 2026. Despite remaining far below its late-June peak, recent price action indicates that buyers have begun defending key technical levels, allowing the market to stabilize following weeks of aggressive liquidation. Although short-term momentum has improved, overall volatility remains elevated, making disciplined ris
HighAmbition
#SNDK
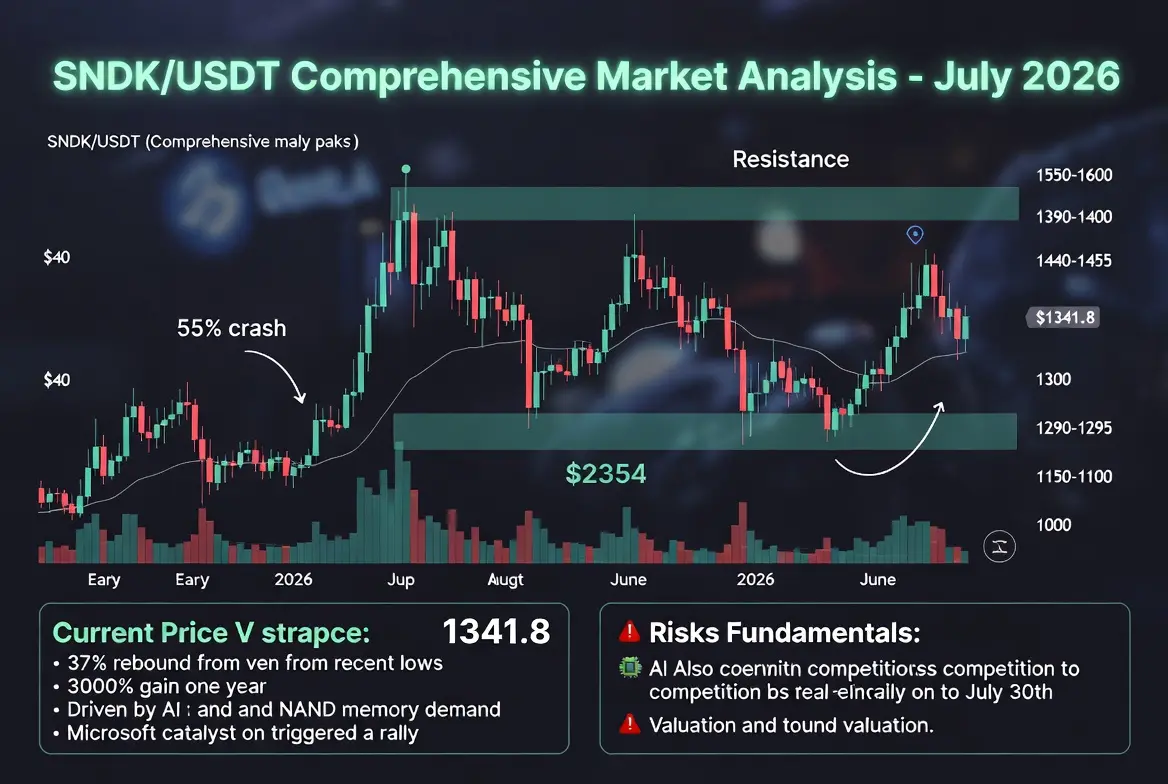
At the time of writing, SNDK/USDT is trading near 1,341.8, holding slightly above the previous session after an exceptionally volatile month. The perpetual contract has experienced one of the most dramatic price swings across the AI infrastructure and semiconductor sector in 2026. Despite remaining far below its late-June peak, recent price action indicates that buyers have begun defending key technical levels, allowing the market to stabilize following weeks of aggressive liquidation. Although short-term momentum has improved, overall volatility remains elevated, making disciplined risk management essential for every position.
The broader trend over the past year has been extraordinary. The underlying SanDisk stock has delivered one of the strongest performances in the technology sector, climbing roughly 3,000% over twelve months and becoming one of the best-performing companies in the S&P 500 during the first half of 2026. From its 52-week low near $40.10, the stock accelerated toward a record high around $2,354.39 in late June, representing an astonishing appreciation of more than 5,700% from the lows. Such explosive gains were fueled by unprecedented investor enthusiasm surrounding artificial intelligence infrastructure, enterprise storage expansion, and tightening global NAND memory supply.
However, markets rarely move in one direction forever. After reaching its all-time high, profit-taking accelerated rapidly as investors reduced exposure to high-valuation semiconductor names. The decline became increasingly aggressive as institutional funds rotated into defensive sectors while traders locked in profits from one of the year's biggest winners. From the June peak to the recent panic low around $972–$1,011, the stock surrendered approximately 55–58% of its value within only a few weeks. The Gate perpetual contract mirrored this move almost perfectly, collapsing from the upper 1,800 region toward the 1,000 area before buyers finally stepped in.
The recent recovery has been equally impressive. After printing a capitulation low between 972 and 996, SNDK staged a powerful V-shaped rebound that lifted prices more than 37% within a very short period. On the four-hour timeframe, the contract has recovered approximately 35–38% from its swing low and is now consolidating inside the important 1,300–1,400 trading range. This consolidation is significant because it suggests that both buyers and sellers are actively defending positions, creating the foundation for the market's next major directional move.
Several major catalysts have contributed to this recovery. The strongest upside session occurred on July 30, when SanDisk shares rallied roughly 26% during regular trading before extending gains beyond 33% in after-hours trading. The primary trigger came from Microsoft's exceptionally strong quarterly earnings, which reinforced investor confidence that AI-related capital spending remains robust. Strong cloud growth, expanding enterprise AI adoption, and renewed optimism toward semiconductor infrastructure encouraged investors to return to high-growth technology names. At the same time, reports suggested that large hedge funds were aggressively unwinding bearish positions, further accelerating the rebound. The perpetual contract responded immediately, climbing from nearly 1,016 toward the 1,350 region, representing a gain of approximately 25–33% in only a single trading cycle.
Before this recovery began, the market had endured a relentless sequence of declines. Around July 29, SNDK fell roughly 7% following SK Hynix's earnings report, which, despite setting records, failed to satisfy elevated investor expectations. The weakness continued with losses of roughly 14% on July 28, approximately 11% on July 27, and another decline near 11% on July 24. This succession of heavy selling erased more than half of the company's market value from its June highs and demonstrated how quickly sentiment can reverse in highly valued semiconductor companies.
From a fundamental perspective, the investment thesis remains centered on the ongoing global NAND memory shortage. Industry analysts continue to argue that supply constraints cannot be resolved quickly because expanding advanced semiconductor manufacturing requires enormous capital investment and significant production lead times. Several investment banks have maintained bullish outlooks despite recent volatility. Morgan Stanley recently reaffirmed its Outperform rating while raising its price target from $1,100 to $1,750, citing expectations that NAND memory prices could increase approximately 25% quarter-over-quarter during the third quarter of 2026 as hyperscale data-center demand continues exceeding available supply.
Market optimism has also been strengthened by reports that SanDisk has secured multi-billion-dollar long-term supply agreements with major cloud providers, including Meta, while enterprise AI infrastructure spending continues to expand globally. Investors believe these contracts provide greater revenue visibility and stronger pricing power during the current memory cycle. Valuation also remains a point of debate. Bulls highlight a forward P/E near 8x, suggesting attractive long-term value if earnings continue expanding, while several analysts maintain price targets ranging between approximately $1,620 and more than $3,000, implying substantial upside if current industry conditions remain favorable.
Nevertheless, meaningful risks remain. Competition from Chinese memory manufacturers continues to intensify, particularly after ChangXin Memory Technologies (CXMT) achieved an extraordinary public market debut and reports emerged that Apple has been evaluating CXMT memory products. Increased Chinese production could eventually reduce global pricing power and place downward pressure on both NAND and DRAM markets. Additional uncertainty comes from Samsung labor disputes, insider selling, changing institutional positioning, and the possibility that investors rotate away from AI-related equities after their exceptional multi-year rally. If memory pricing peaks sooner than expected, valuation multiples could compress rapidly.
The next major catalysts will be SanDisk's fiscal fourth-quarter earnings on August 5, 2026, followed by its Investor Day on August 13, 2026.
Investors will closely monitor management's guidance regarding NAND pricing, future supply agreements, AI-related demand, production capacity, and long-term profitability. Because expectations remain elevated, even a strong report could trigger significant volatility if forward guidance fails to exceed market forecasts.
From a technical standpoint, the 1,300 area has become the most important short-term support, while 1,290–1,295 represents the immediate four-hour defensive zone. Below this region, stronger support is located between 1,150 and 1,100, followed by the panic low near 1,000. On the upside, initial resistance remains around 1,390–1,400, followed by the important 1,440–1,455 area where previous rallies encountered heavy selling pressure. A decisive breakout above 1,440 supported by rising trading volume could open the door toward 1,550–1,600, while a successful recovery above 1,700 would indicate that buyers have regained medium-term control. Conversely, failure to hold 1,300 could trigger another decline toward the 1,150–1,225 support region before stronger buying interest returns.
Overall, SNDK remains one of the highest-beta opportunities within the AI semiconductor sector. The recent rebound has improved market sentiment, but the contract is still trading well below its historical highs, meaning volatility is likely to remain elevated. Traders should avoid chasing impulsive moves inside the current consolidation range and instead wait for a confirmed breakout above 1,400 or a confirmed rebound from major support before initiating larger positions. Tight risk controls, disciplined position sizing, and clearly defined stop-loss levels remain essential, especially with the August earnings announcement capable of producing 15–25% price swings in either direction within a single trading session.@Gate_Square
repost-content-media
#SummerCreationCamp
The Hardest Lesson in Crypto: Winning Traders Don't Predict Better—They Lose Better
Every bull market creates thousands of "experts."
Every bear market exposes who was only lucky.
Most traders believe success comes from finding the perfect indicator, predicting the next breakout, or discovering a hidden strategy before everyone else. That belief is exactly why so many accounts disappear after a few months.
The market doesn't reward intelligence alone.
It rewards discipline.
The uncomfortable truth is that professional traders are wrong far more often than beginners imagine
Dubai_Prince
#SummerCreationCamp
The Hardest Lesson in Crypto: Winning Traders Don't Predict Better—They Lose Better
Every bull market creates thousands of "experts."
Every bear market exposes who was only lucky.
Most traders believe success comes from finding the perfect indicator, predicting the next breakout, or discovering a hidden strategy before everyone else. That belief is exactly why so many accounts disappear after a few months.
The market doesn't reward intelligence alone.
It rewards discipline.
The uncomfortable truth is that professional traders are wrong far more often than beginners imagine. The difference is simple: when they're wrong, they lose small. When they're right, they let the market pay them.
That is the real edge.
Stop Treating Every Trade Like a Life-Changing Opportunity
One of the fastest ways to destroy an account is believing every setup deserves maximum capital.
The market offers thousands of opportunities every year.
Your job isn't to trade all of them.
Your job is to survive long enough to participate in the best ones.
Capital preservation is not fear.
It is professional risk management.
If one losing trade significantly damages your portfolio, your position size was too large before the trade even started.
Strong Coins Attract Money—Weak Coins Attract Hope
Many beginners fall in love with falling assets because they appear "cheap."
Cheap is not a trading strategy.
Markets can always become cheaper.
Professional traders look for strength, expanding volume, improving momentum, and confirmation that institutional money is participating.
A coin making new highs with increasing volume deserves far more attention than a coin making new lows while retail investors keep calling it "undervalued."
Follow capital.
Don't argue with it.
Your Stop-Loss Is Not Your Enemy
Nothing damages traders more than refusing to admit a mistake.
Hope has destroyed more portfolios than volatility ever will.
A stop-loss is not an admission of failure.
It is the cost of staying in business.
Small losses are business expenses.
Large losses are career-ending events.
The objective isn't avoiding losses.
The objective is making sure no single trade has the power to eliminate months of disciplined work.
Wait for Confirmation Instead of Chasing Excitement
Most emotional trades happen after large green candles.
By then, the easy money is often already gone.
Patience feels boring.
FOMO feels exciting.
Unfortunately, excitement usually transfers wealth from impatient traders to disciplined ones.
Let breakouts prove themselves.
Let volume confirm the move.
Let price tell the story before risking capital.
Trading is not a race.
Technical Indicators Should Support Decisions, Not Replace Thinking
MACD, RSI, Moving Averages, Bollinger Bands, and other indicators are valuable tools.
None of them predict the future.
Indicators analyze what has already happened.
Price action, liquidity, trading volume, and market structure always deserve greater respect than blindly following one technical signal.
The best traders combine multiple pieces of evidence instead of searching for one magical indicator.
Understand the Psychology Behind Every Candle
Every candlestick represents a battle.
Behind every breakout are buyers willing to pay higher prices.
Behind every rejection are sellers taking profits or defending positions.
Charts become much easier to understand when you stop looking at candles as colors and start viewing them as decisions made by thousands of market participants.
The market is psychology displayed through price.
Risk Management Is the Real Trading Strategy
Many traders spend years searching for the perfect entry.
Very few spend enough time mastering exits.
Entries create opportunities.
Exits determine profitability.
Professional traders think in probabilities rather than certainty.
No setup guarantees success.
No indicator guarantees accuracy.
Risk management is the only variable completely under your control.
Master that first.
Everything else becomes easier.
The Brutal Truth
If your strategy only works during bull markets, it isn't a strategy.
If you refuse to accept losses, you aren't trading—you are hoping.
If one bad trade destroys months of progress, the market isn't the problem.
Your discipline is.
Crypto will always create another opportunity.
What it will never do is protect traders from their own emotions.
The traders who survive multiple market cycles are rarely the smartest people in the room.
They are simply the ones who respect risk more than they chase profits.
In the long run, consistency beats brilliance, discipline beats prediction, and patience beats speed.
The market doesn't pay those who guess correctly.
It pays those who manage uncertainty better than everyone else.
#SummerCreationCamp #CryptoTrading #Blockchain #GateSquare
@Gate_Square
repost-content-media
#SummerCreationCamp #夏日创作营
The Crypto Market Isn't Waiting for Retail—It's Waiting for Confidence
Every correction creates the same headline:
"Crypto is crashing."
But experienced market participants ask a different question:
Who is actually selling, and who is quietly preparing for the next move?
The last several trading sessions have been driven more by leverage than by fundamentals. Long liquidations accelerated downside momentum, fear spread across social media, and many traders confused forced selling with permanent weakness. History shows these are two completely different events.
The ma
Dubai_Prince
#SummerCreationCamp #夏日创作营
The Crypto Market Isn't Waiting for Retail—It's Waiting for Confidence
Every correction creates the same headline:
"Crypto is crashing."
But experienced market participants ask a different question:
Who is actually selling, and who is quietly preparing for the next move?
The last several trading sessions have been driven more by leverage than by fundamentals. Long liquidations accelerated downside momentum, fear spread across social media, and many traders confused forced selling with permanent weakness. History shows these are two completely different events.
The market is now entering one of the most important decision periods of the summer.
Liquidity Is More Important Than Price
Price tells us where Bitcoin trades.
Liquidity tells us why it trades there.
When leveraged positions become overcrowded, even a relatively small decline can trigger automatic liquidations that push prices much lower than fundamentals justify. Once those positions disappear, volatility often begins to normalize.
That is exactly why many professional traders spend more time monitoring derivatives, funding rates, ETF flows, and open interest than watching individual candles.
Markets do not simply move because buyers or sellers appear.
They move because liquidity disappears.
Bitcoin Is Testing Market Psychology
Bitcoin around the $65,000 region is no longer just a technical level.
It has become a psychological battlefield.
Bulls believe the correction has already removed excessive leverage and created healthier conditions for another advance.
Bears argue that institutional demand remains cautious and that macroeconomic uncertainty could trigger another wave of selling.
Neither side has complete control.
That uncertainty is exactly what creates opportunity.
If support continues holding, confidence may gradually return as volatility declines.
If support breaks decisively, another liquidity hunt becomes increasingly likely before any sustainable recovery develops.
ETF Flows Matter More Than Daily Headlines
Retail traders often react to price.
Institutions react to capital allocation.
Spot ETF inflows and outflows provide one of the clearest windows into long-term market conviction.
Short-term withdrawals do not automatically signal the end of a bull cycle.
Large investors frequently reduce exposure while waiting for better risk-to-reward conditions instead of abandoning the asset class entirely.
This distinction is critical.
Temporary caution should never be confused with structural rejection.
Ethereum Is Quietly Building Its Own Story
While Bitcoin continues fighting for market direction, Ethereum is developing a different narrative.
Institutional interest remains resilient.
Layer-2 ecosystems continue expanding.
Real-world asset tokenization keeps attracting serious attention.
Staking participation continues reducing liquid supply.
These developments rarely create dramatic headlines overnight.
Instead, they slowly strengthen the long-term investment case.
Markets reward patience long before they reward excitement.
Why U.S. Stocks Still Matter
Crypto does not exist in isolation.
Every major move in digital assets increasingly reflects broader global liquidity.
If inflation continues moderating and expectations for easier monetary policy strengthen, technology stocks and digital assets may benefit together.
However, stronger inflation, rising Treasury yields, or unexpected geopolitical developments could quickly reduce investors' willingness to own higher-risk assets.
Watching only Bitcoin while ignoring Wall Street has become an outdated strategy.
Today's market is interconnected.
Hong Kong's Growing Importance
Hong Kong continues positioning itself as one of Asia's most important digital asset gateways.
Every regulatory improvement, institutional product launch, or expansion of licensed crypto services increases the region's strategic importance.
Global capital is becoming increasingly diversified.
The next wave of institutional participation may not originate from a single country but from multiple financial centers working simultaneously.
That trend deserves far more attention than short-term daily price swings.
Prediction Markets Are Becoming Market Indicators
Prediction markets are evolving beyond entertainment.
They increasingly reflect how participants collectively price probability rather than certainty.
Whether forecasting monetary policy, regulatory decisions, elections, ETF approvals, or macroeconomic events, these markets provide another layer of sentiment that traditional charts cannot capture.
Probability often moves before price.
Ignoring that information means ignoring part of the market's collective intelligence.
My View
I remain neutral in the immediate short term but cautiously constructive over the medium term.
The recent correction appears healthier than previous panic events because leverage has been significantly reduced without destroying long-term institutional interest.
That does not guarantee immediate upside.
It simply creates a stronger foundation if buying demand returns.
The next several sessions may define market direction for the remainder of the summer.
Patience currently has greater value than prediction.
Questions for Every Trader
Instead of asking:
"Will Bitcoin pump tomorrow?"
Ask yourself:
• Are institutions increasing or reducing exposure?
• Is liquidity improving or disappearing?
• What are ETF flows signaling?
• What is the bond market telling us?
• Are you reacting emotionally or managing risk professionally?
The traders who survive multiple market cycles rarely predict every move correctly.
They simply avoid making catastrophic mistakes.
Sometimes protecting capital is the most profitable trade available.
What is your outlook for the next major move?
Will Bitcoin reclaim momentum above key resistance, or does the market need one final liquidity sweep before confidence fully returns?
#SummerCreationCamp #Crypto #Bitcoin @Gate_Square
repost-content-media
BTC-0.92%
ETH-0.84%
#SummerCreationCamp
The Biggest Edge in Crypto Isn't Capital—It's Perspective.
Every market cycle creates new millionaires.
It also creates thousands of people who entered with the same information everyone else had, chased the same narratives, and exited with heavy losses. The difference was rarely intelligence. More often, it was the ability to separate meaningful signals from endless noise.
Today's crypto market is no longer driven by a single catalyst. Bitcoin reacts to ETF flows, Ethereum is increasingly shaped by institutional adoption, U.S. equity markets influence global risk appetite
Dubai_Prince
#SummerCreationCamp
The Biggest Edge in Crypto Isn't Capital—It's Perspective.
Every market cycle creates new millionaires.
It also creates thousands of people who entered with the same information everyone else had, chased the same narratives, and exited with heavy losses. The difference was rarely intelligence. More often, it was the ability to separate meaningful signals from endless noise.
Today's crypto market is no longer driven by a single catalyst. Bitcoin reacts to ETF flows, Ethereum is increasingly shaped by institutional adoption, U.S. equity markets influence global risk appetite, Hong Kong continues strengthening its position as a digital asset hub, and prediction markets are becoming an unexpected source of sentiment analysis. The market has evolved into an interconnected financial ecosystem where one headline can ripple across multiple asset classes within minutes.
That is why content creation has become more valuable than ever.
Not because the internet needs more opinions.
Because it needs more analysis.
The creators who will shape the next generation of Web3 are not those who post first—they are those who explain why something matters. They connect macroeconomics with blockchain, trading psychology with on-chain data, and short-term volatility with long-term adoption. They help readers think independently instead of following the crowd.
Markets reward preparation far more often than prediction.
A well-researched article can remain useful long after a trending headline disappears. One thoughtful market breakdown can prevent emotional decisions. One original perspective can start a discussion that teaches thousands of people something new.
That is the true purpose behind #SummerCreationCamp.
It is not simply about producing more content. It is about raising the quality of conversation across the crypto industry. Every creator has the opportunity to contribute research, challenge assumptions, and provide insights that help others navigate one of the fastest-moving financial markets in history.
As digital assets continue merging with traditional finance, the demand for credible voices will only increase. Investors are looking beyond hype. They want context, evidence, and balanced analysis.
The future of crypto will not be written only by developers, institutions, or regulators.
It will also be written by creators who consistently educate, question, and inspire.
So before publishing your next post, ask yourself one question:
Are you adding more noise—or creating knowledge that people will still remember after the market moves on?
#SummerCreationCamp #GateSquare #Crypto @Gate_Square
repost-content-media
BTC-0.92%
ETH-0.84%
#AnthropicSecondaryValuationHits1.2Trillion
Anthropic Secondary Market Valuation Reaches $1.2 Trillion: The artificial intelligence company Anthropic has achieved a remarkable milestone by reaching a $1.2 trillion valuation on secondary markets, making it the most sought-after company in the venture secondary market history. This valuation represents a staggering 550% year-over-year increase and has positioned Anthropic ahead of its primary competitor OpenAI, which currently trades at approximately $908 billion on the same secondary platforms.
Understanding Secondary Market Valuation
Secondar
HighAmbition
#AnthropicSecondaryValuationHits1.2Trillion
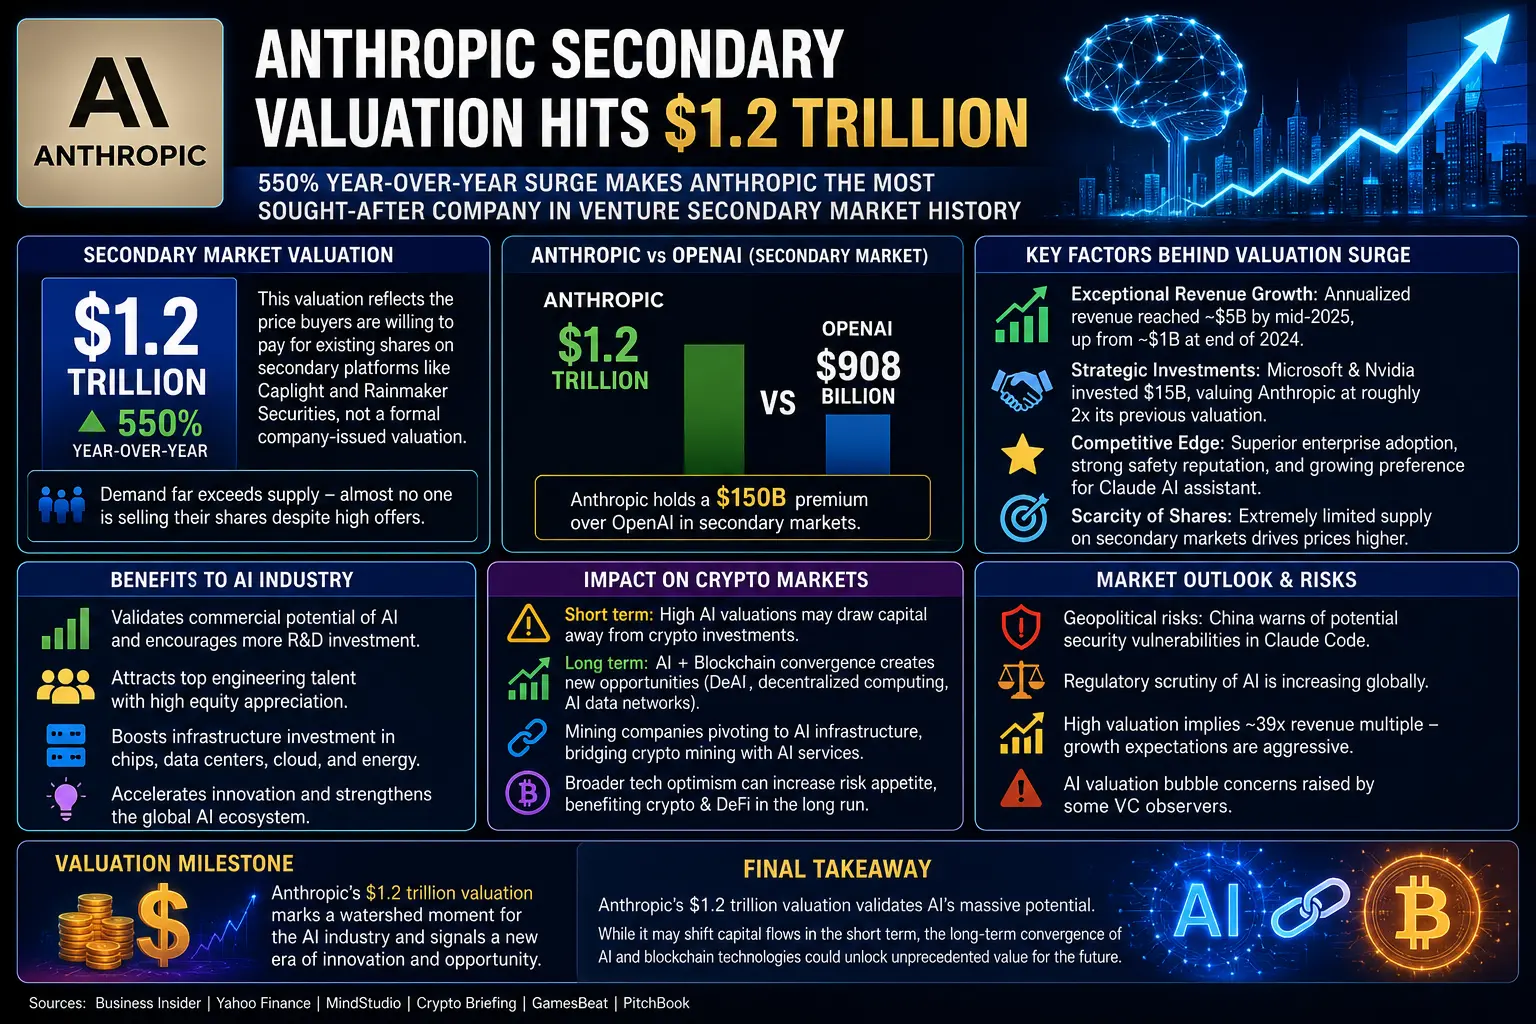
Anthropic Secondary Market Valuation Reaches $1.2 Trillion: The artificial intelligence company Anthropic has achieved a remarkable milestone by reaching a $1.2 trillion valuation on secondary markets, making it the most sought-after company in the venture secondary market history. This valuation represents a staggering 550% year-over-year increase and has positioned Anthropic ahead of its primary competitor OpenAI, which currently trades at approximately $908 billion on the same secondary platforms.
Understanding Secondary Market Valuation
Secondary market valuation differs significantly from traditional funding rounds. When a company raises money through primary funding, it issues new shares to investors in exchange for capital that goes directly to the company. Secondary markets, however, involve existing shareholders, typically early employees, founders, or initial investors, selling their pre-owned shares to new buyers. The $1.2 trillion figure for Anthropic reflects what buyers are willing to pay for existing shares on platforms like Caplight and Rainmaker Securities, not a formal company-issued valuation.
The scarcity of available shares has created an unusual dynamic where demand vastly exceeds supply. According to market data, almost no one is selling their Anthropic shares despite the astronomical prices being offered. This supply shortage has driven prices higher as institutional investors and wealthy individuals compete for limited access to what they perceive as the next generation-defining technology company.
Key Factors Behind the Valuation Surge
Several critical elements have contributed to Anthropic's rapid valuation appreciation. The company has demonstrated exceptional revenue growth, with annualized revenue reaching approximately $5 billion by mid-2025, up from roughly $1 billion at the end of 2024. This represents a fivefold increase in just eighteen months, validating investor confidence in the company's commercial viability.
Strategic investments from major technology players have also reinforced Anthropic's market position. Microsoft and Nvidia collectively invested $15 billion in a package that valued the company at roughly double its previous September 2025 Series F valuation of $183 billion. Google's reported discussions about additional investment at valuations exceeding $350 billion further validated the company's trajectory.
The competitive landscape has shifted dramatically in Anthropic's favor. Eighteen months ago, most industry observers considered Anthropic a distant second to OpenAI. Today, Anthropic commands a $150 billion premium over OpenAI's secondary market valuation. This reversal reflects Anthropic's superior enterprise adoption rates, more favorable safety reputation, and the growing market preference for its Claude AI assistant in professional applications.
Benefits to Artificial Intelligence Industry
Anthropic's $1.2 trillion valuation delivers substantial benefits to the broader AI ecosystem. First, it validates the commercial potential of large language models and generative AI technologies, encouraging continued investment in research and development across the sector. When investors assign such valuations to AI companies, it signals that the technology has moved beyond experimental phases into genuine profit-generating businesses.
The valuation also attracts top-tier engineering talent to the AI field. When employees see their equity appreciating at these rates, it creates powerful incentives for the world's best researchers and engineers to join AI companies rather than traditional technology firms or financial institutions. This talent concentration accelerates innovation cycles and drives competitive advancement across the industry.
Furthermore, Anthropic's success encourages infrastructure investment. Data centers, cloud computing providers, semiconductor manufacturers, and energy companies all benefit when AI valuations demonstrate sustained demand for computational resources. Nvidia's position as a leading AI chip supplier has been reinforced by Anthropic's growth, creating positive feedback loops throughout the technology supply chain.
Impact on Cryptocurrency Markets
The relationship between Anthropic's valuation surge and cryptocurrency markets operates through several interconnected channels. Initially, high AI valuations can create competitive pressure for investment capital. When institutional investors allocate billions to AI companies, less capital may flow into cryptocurrency investments in the short term. This dynamic has contributed to periods of crypto market stagnation during major AI funding announcements.
However, the longer-term implications are more nuanced and potentially beneficial for crypto markets. AI and blockchain technologies are increasingly converging in several areas. Decentralized AI networks, which distribute computational resources across blockchain infrastructure, may benefit from the capital and attention flowing into the AI sector. Projects that combine AI capabilities with blockchain verification mechanisms could attract investment as investors seek exposure to both trends.
The valuation also reflects broader technological optimism that can lift all innovation sectors. When investors believe we are entering a transformative technological era, they become more willing to take risks on emerging technologies including cryptocurrencies and decentralized finance protocols. Anthropic's success story reinforces the narrative that disruptive technologies can generate extraordinary returns, potentially increasing risk appetite across digital asset markets.
Mining companies have already begun pivoting toward AI infrastructure, recognizing that the energy and computational resources required for cryptocurrency mining can be redirected to AI data center operations. This transition creates hybrid business models that bridge traditional crypto mining with AI services, potentially stabilizing revenues for companies previously dependent on volatile cryptocurrency prices.
Market Outlook and Risk Considerations
Despite the optimistic valuation trends, several risks warrant consideration. China's recent warning about potential security vulnerabilities in Anthropic's Claude Code tool introduces geopolitical uncertainty that could affect market confidence. Regulatory scrutiny of AI technologies continues intensifying globally, with governments seeking greater control over frontier model development and deployment.
The current valuation implies revenue multiples of approximately 39 times estimated 2025 revenue, indicating aggressive growth expectations that may be difficult to sustain. Some venture capital observers have raised concerns about potential bubble conditions in AI valuations, drawing parallels to previous technology investment cycles that experienced significant corrections.
For cryptocurrency investors, the key consideration involves monitoring capital rotation patterns between AI and crypto sectors. Historical patterns suggest that when one technology sector experiences rapid appreciation, capital may temporarily migrate away from alternative investments. However, the fundamental value propositions of blockchain technology remain distinct from AI applications, suggesting both sectors can coexist and potentially complement each other over longer time horizons.
The convergence of AI and blockchain technologies represents the most promising intersection for future growth. Projects that successfully integrate artificial intelligence capabilities with decentralized infrastructure could capture value from both technological trends, potentially outperforming pure-play investments in either sector alone.
In conclusion, Anthropic's $1.2 trillion secondary market valuation marks a watershed moment for the artificial intelligence industry, validating years of research investment and commercial development. While creating some competitive pressure for cryptocurrency investment capital in the near term, the broader technological optimism and innovation incentives generated by such valuations ultimately benefit the entire digital asset ecosystem. Investors should monitor developments in both sectors while recognizing the distinct value propositions and risk profiles each technology offers.
repost-content-media
#MyGateTradeStory
My Gate Trading Moment: A Strategic BTC Trade
The cryptocurrency market never sleeps, and neither do the opportunities it presents. Today, I want to share my trading journey with Bitcoin on Gate, the best cryptocurrency exchange for both beginners and experienced traders.
Current Market Snapshot
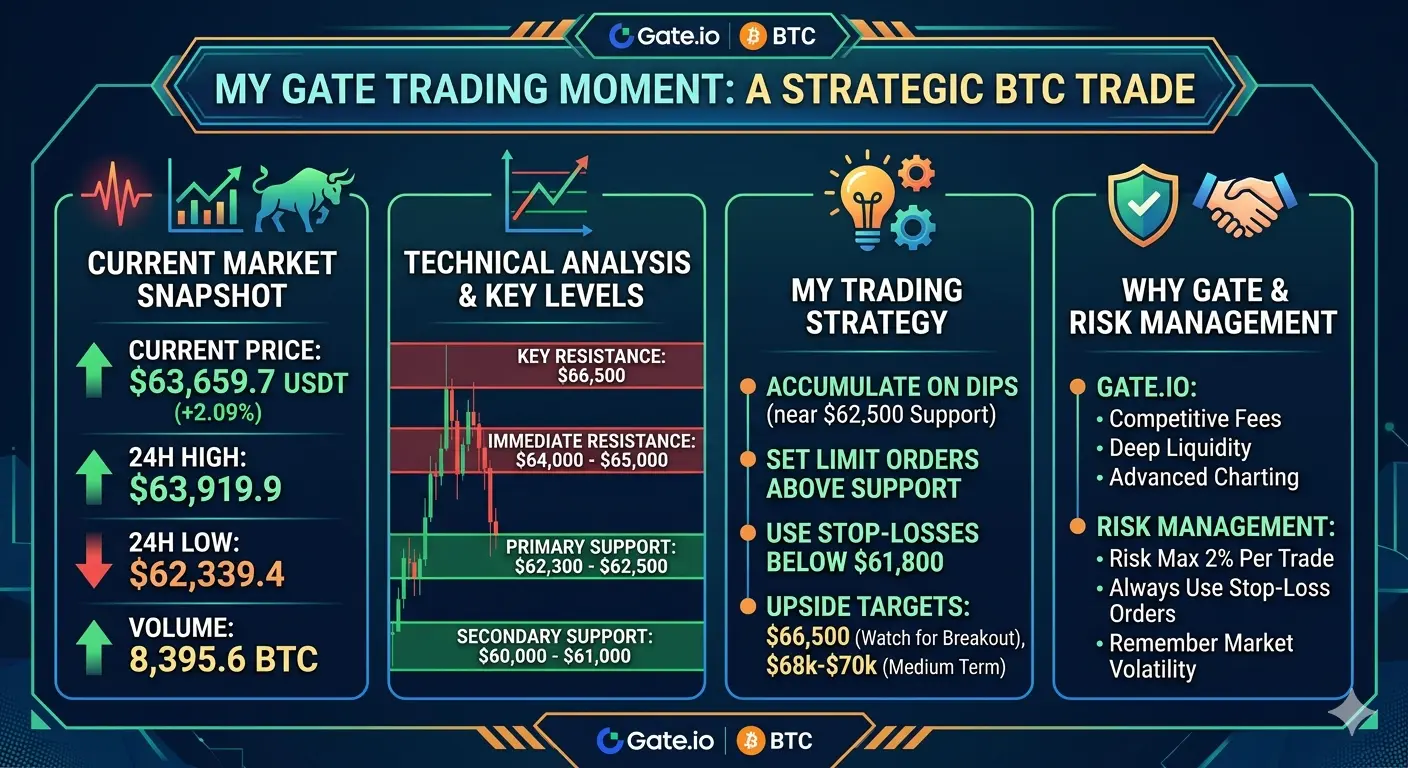
Bitcoin is currently trading at $63,659.7 USDT, showing a positive movement of 2.09% with a price increase of $1,303.2 from the opening price of $62,356.4. The 24-hour high reached $63,919.9, while the low touched $62,339.4. The trading volume stands at 8,395.598 BTC, demonstrating s
HighAmbition
#MyGateTradeStory
My Gate Trading Moment: A Strategic BTC Trade
The cryptocurrency market never sleeps, and neither do the opportunities it presents. Today, I want to share my trading journey with Bitcoin on Gate, the best cryptocurrency exchange for both beginners and experienced traders.
Current Market Snapshot
Bitcoin is currently trading at $63,659.7 USDT, showing a positive movement of 2.09% with a price increase of $1,303.2 from the opening price of $62,356.4. The 24-hour high reached $63,919.9, while the low touched $62,339.4. The trading volume stands at 8,395.598 BTC, demonstrating strong market participation.
Technical Analysis and Key Levels
Based on my analysis of the recent price action, here are the critical levels I am monitoring:
Support Levels:
Primary Support: $62,300 - $62,500 range. This zone has shown strong buying interest and has acted as a floor during recent pullbacks.
Secondary Support: $60,000 - $61,000. A psychological level that could trigger significant buying if tested.
Resistance Levels:
Immediate Resistance: $64,000 - $65,000. The recent high of $63,919.9 suggests this area will be challenging to break.
Key Resistance: $66,500. Breaking above this level could signal a continuation of the uptrend toward higher targets.
My Trading Strategy
My approach combines technical analysis with risk management principles. I am currently looking for opportunities to accumulate BTC on dips toward the $62,500 support level. The strategy involves setting limit orders slightly above support to catch potential bounces while maintaining stop-losses below $61,800 to protect capital.
For upside targets, I am watching the $66,500 resistance level closely. A breakout above this zone with strong volume would confirm bullish momentum, potentially opening the path toward $68,000 - $70,000 in the medium term.
Why Gate is My Preferred Exchange
Gate provides the perfect environment for executing this strategy. With competitive fees, deep liquidity, and advanced charting tools, I can implement my trading plan with confidence. The platform's security features give me peace of mind while holding positions overnight.
Risk Management
No trade is complete without proper risk management. I never risk more than 2% of my portfolio on a single trade and always use stop-loss orders. Remember, the cryptocurrency market is highly volatile, and past performance does not guarantee future results.
Final Thoughts
Bitcoin continues to show resilience despite market uncertainties. The current price action suggests accumulation by smart money at lower levels. By combining technical analysis with disciplined risk management on Gate, I believe we can navigate these markets successfully.
Join me on Gate and share your own trading stories. Let us learn and grow together in this exciting market.
@Gate_Square
repost-content-media
BTC-0.92%
#BTC
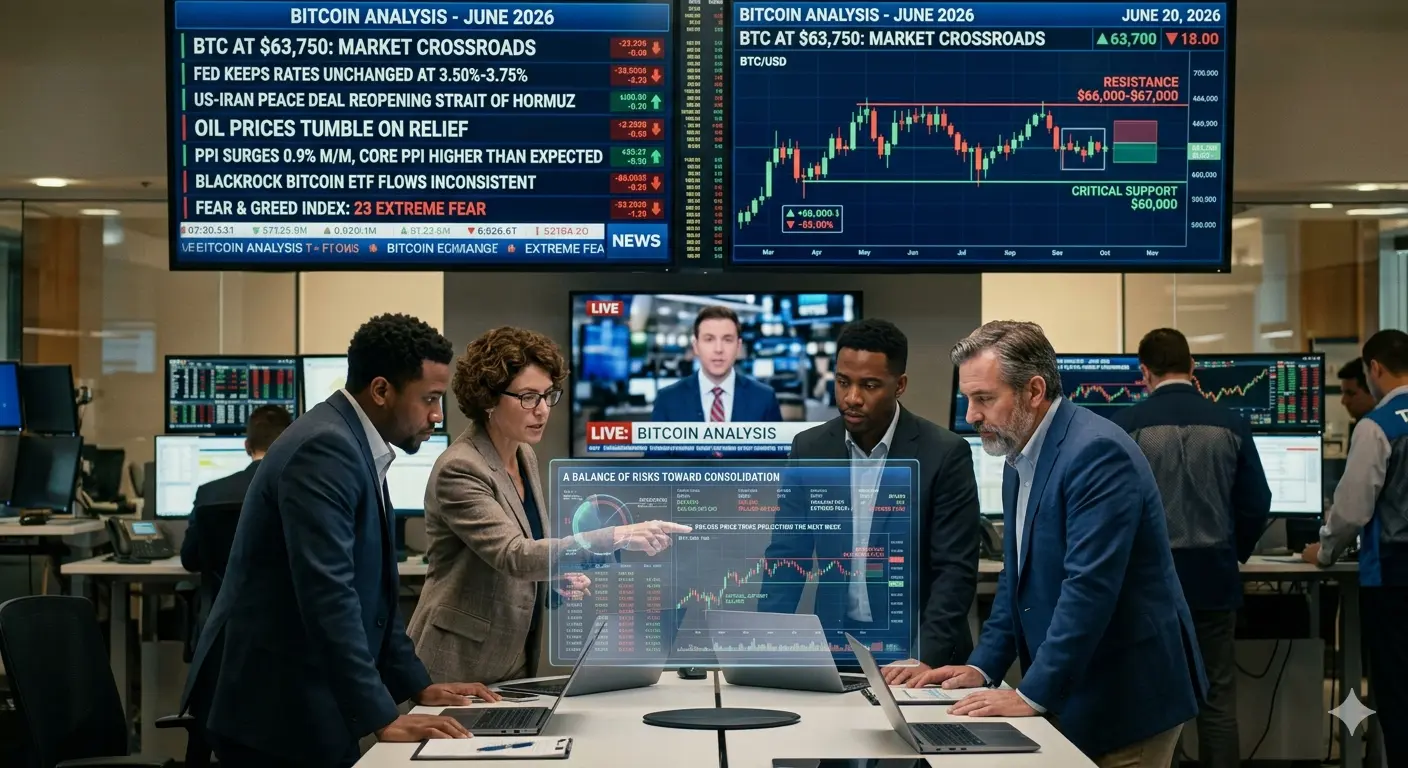
Bitcoin is currently trading at approximately $63,750, representing a critical juncture in the market as multiple macroeconomic and geopolitical factors converge. This analysis examines every major catalyst affecting BTC price action and provides detailed projections for the coming week.
Current Market Status
Bitcoin has experienced significant volatility over recent weeks, recovering from lows near $60,000 following the US-Iran peace deal announcement. The cryptocurrency has shown resilience, climbing back above $65,000 at its peak before settling around current levels. The Fear and Gre
HighAmbition
#BTC
Bitcoin is currently trading at approximately $63,750, representing a critical juncture in the market as multiple macroeconomic and geopolitical factors converge. This analysis examines every major catalyst affecting BTC price action and provides detailed projections for the coming week.
Current Market Status
Bitcoin has experienced significant volatility over recent weeks, recovering from lows near $60,000 following the US-Iran peace deal announcement. The cryptocurrency has shown resilience, climbing back above $65,000 at its peak before settling around current levels. The Fear and Greed Index remains at a concerning 23, indicating Extreme Fear sentiment despite the recent bounce. This divergence between price recovery and market sentiment suggests the rally may be fragile and driven more by short-term factors than genuine conviction.
US-Iran Deal Impact Analysis
The preliminary peace agreement between the United States and Iran represents one of the most significant geopolitical developments affecting Bitcoin this month. The deal, mediated by Pakistan, includes reopening the Strait of Hormuz and lifting the US naval blockade of Iran. This development has had a mixed but generally positive impact on Bitcoin.
If the deal had failed or been postponed, Bitcoin would likely have faced severe downward pressure. Geopolitical tensions typically drive investors toward safe-haven assets like gold and the US dollar, while risk assets including Bitcoin suffer. The Strait of Hormuz closure would have disrupted approximately 20% of global oil supply, triggering energy price spikes and broader market instability. In such a scenario, Bitcoin could have retested the $60,000 support level or even broken below it toward $58,000-$59,000.
However, with the deal proceeding as planned and formal signing occurring in Switzerland, the geopolitical risk premium has been removed from markets. This has allowed Bitcoin to stabilize and attempt building a base. The reopening of the Strait of Hormuz has caused oil prices to tumble more than 4%, reducing inflationary pressures and providing breathing room for risk assets. Copper prices have surged on the deal news, indicating renewed risk appetite in commodity markets that often correlates with crypto sentiment.
Kevin Warsh Fed Meeting and Monetary Policy
Kevin Warsh has now chaired his first Federal Reserve meeting as the new Fed Chair, marking a significant shift in monetary policy communication. This meeting carried extraordinary importance for Bitcoin and broader crypto markets.
The Federal Reserve maintained interest rates unchanged at 3.50% to 3.75%, which was widely expected. However, the key developments came from updated economic projections and Warsh's communication style. The dot plot revealed that officials now expect the benchmark rate to reach 3.8% by year-end 2026, up from previous projections of 3.4%, signaling a more hawkish stance than markets anticipated.
Warsh has introduced significant changes to Fed communication, dropping forward guidance on future rate paths and establishing five task forces to overhaul central bank messaging. This creates uncertainty for markets, as investors can no longer rely on explicit Fed signals for future policy direction. The Fed has also signaled possible rate hikes later in 2026 if inflation persists, with markets now pricing in a 54% chance of a hike.
For Bitcoin, this hawkish shift presents headwinds. Higher interest rates reduce the attractiveness of non-yielding assets like Bitcoin, as investors can earn better returns in traditional fixed-income instruments. The removal of forward guidance increases market volatility, which typically pressures risk assets. However, if inflation data begins cooling, the Fed may still pivot toward easing, which would be bullish for Bitcoin.
CPI and PPI Data Impact
Inflation data remains crucial for Bitcoin price direction. Recent Producer Price Index readings have shown concerning trends, with July PPI surging 0.9% month-over-month against forecasts of 0.2%, and 3.3% year-over-year versus expected 2.5%. Core PPI also exceeded expectations at 0.9% monthly.
These elevated inflation readings reduce expectations for near-term Fed rate cuts, creating a challenging environment for Bitcoin. When CPI and PPI data exceed forecasts, it typically strengthens the US dollar and pressures Bitcoin lower as traders anticipate tighter monetary policy. Conversely, softer inflation data would support Bitcoin by increasing the probability of rate cuts.
The relationship between inflation data and Bitcoin has become increasingly pronounced in 2026 as institutional adoption has grown. Bitcoin now responds more sensitively to macroeconomic shifts, behaving increasingly like a risk asset rather than an inflation hedge. Traders should monitor upcoming CPI and PPI releases closely, as surprises in either direction can trigger significant Bitcoin volatility.
Technical Analysis and Market Structure
From a technical perspective, Bitcoin is showing mixed signals. The cryptocurrency is trading above its 100-day EMA at approximately $65,549, which provides some support. However, the MACD histogram and overall momentum indicators suggest caution.
Bitcoin's Sharpe ratio recently hit levels that have marked cycle lows since 2015, suggesting potential bottoming conditions. Long-term holders absorbed approximately 125,000 BTC in June, indicating strong conviction among seasoned investors. Strategy (formerly MicroStrategy) has continued accumulating Bitcoin, purchasing an additional 1,587 BTC for $100 million, bringing their total holdings above 800,000 coins.
However, bearish patterns persist. A bear flag formation remains intact on higher timeframes, with immediate TBO Support around $63,418. If this support fails, the technical target suggests a potential move toward $49,000 or even $38,555 in a worst-case breakdown scenario. Bitcoin dominance stands at 56.5%, with altcoins continuing to underperform, indicating that capital is not rotating aggressively into higher-risk crypto assets.
Open interest has been rising while funding rates remain negative, suggesting a short squeeze has been driving recent price appreciation. While this can fuel rallies, it also means the recovery lacks fundamental buying support and may be vulnerable to reversal.
Additional Market Factors
Several other factors merit consideration in this analysis. The Bank of Japan's rate decision carries significance for Bitcoin, as speculative short positions in the yen are at nine-year highs. If the BOJ signals more aggressive tightening, it could trigger a yen short squeeze and unwind carry trades that have supported risk assets, potentially impacting Bitcoin negatively.
SpaceX's historic IPO has created some distraction in markets, with the stock gaining nearly 40% in its first days of trading. Some analysts note that Cathie Wood sold Bitcoin-related positions to buy SpaceX shares, representing potential capital rotation away from crypto.
Bitcoin ETF flows remain critical to watch. BlackRock's Bitcoin ETF inflows have been inconsistent, and traders are hoping for a rebound in institutional demand to sustain price levels. The correlation between ETF inflows and Bitcoin price has strengthened considerably.
One-Week Price Projection
For the upcoming week, Bitcoin faces a challenging environment with multiple conflicting forces. The Iran deal provides a geopolitical relief tailwind, but Fed hawkishness and elevated inflation data create monetary headwinds.
The most likely scenario sees Bitcoin trading in a range between $62,000 and $67,000 over the next seven days. Support levels to watch include $63,418 (immediate TBO Support), $62,000 (psychological level), and $60,000 (critical support that marked the recent bottom). Resistance levels include $65,500 (recent highs), $66,000-$67,000 (congestion zone), and $68,000 (strong resistance).
If bearish technical patterns resolve to the downside, Bitcoin could test $60,000 again or potentially break lower toward $58,000. Conversely, if institutional buying resumes through ETFs and macro conditions stabilize, a move toward $68,000-$70,000 remains possible.
The balance of risks appears skewed toward further consolidation or mild downside rather than a strong breakout. Traders have been burned by collapsed ceasefires twice in recent months, creating skepticism about geopolitical-driven rallies. The Fed's hawkish pivot under Warsh removes a key bullish catalyst that had supported Bitcoin earlier in 2026.
Key Levels to Monitor
Critical support: $60,000 (must hold to maintain bullish structure)
Immediate support: $63,418
Resistance: $66,000-$67,000
Major resistance: $68,000-$70,000
Conclusion
Bitcoin at $63,750 represents a market at a crossroads. The Iran peace deal removes significant geopolitical risk, but monetary policy headwinds under the new Fed leadership create uncertainty. Technical indicators suggest caution, with bearish patterns still intact despite the recent bounce. For the coming week, expect continued volatility with a slight bearish bias as markets digest the Fed's new communication approach and await fresh inflation data. Long-term holders remain committed, but short-term price action will likely be driven by macroeconomic developments and institutional flow data.
#USIranTalksPostponed #TradFiCFDGoldMasters #STRC跌破面值11%創上市新低 #WarshDebutsAsFedHoldsRatesSteady
repost-content-media
#MyGateTradeStory
XRP is currently trading at 1.1470, positioning itself in a critical consolidation zone. The cryptocurrency has been experiencing heightened volatility as institutional interest grows and regulatory clarity continues to evolve. Recent price action suggests a potential breakout scenario is developing, with traders closely monitoring key technical levels.
Technical Analysis Overview
Support Levels
The immediate support for XRP stands at 1.12, which has acted as a reliable floor during recent pullbacks. Below this, secondary support is located at 1.10, representing the previous
HighAmbition
#MyGateTradeStory
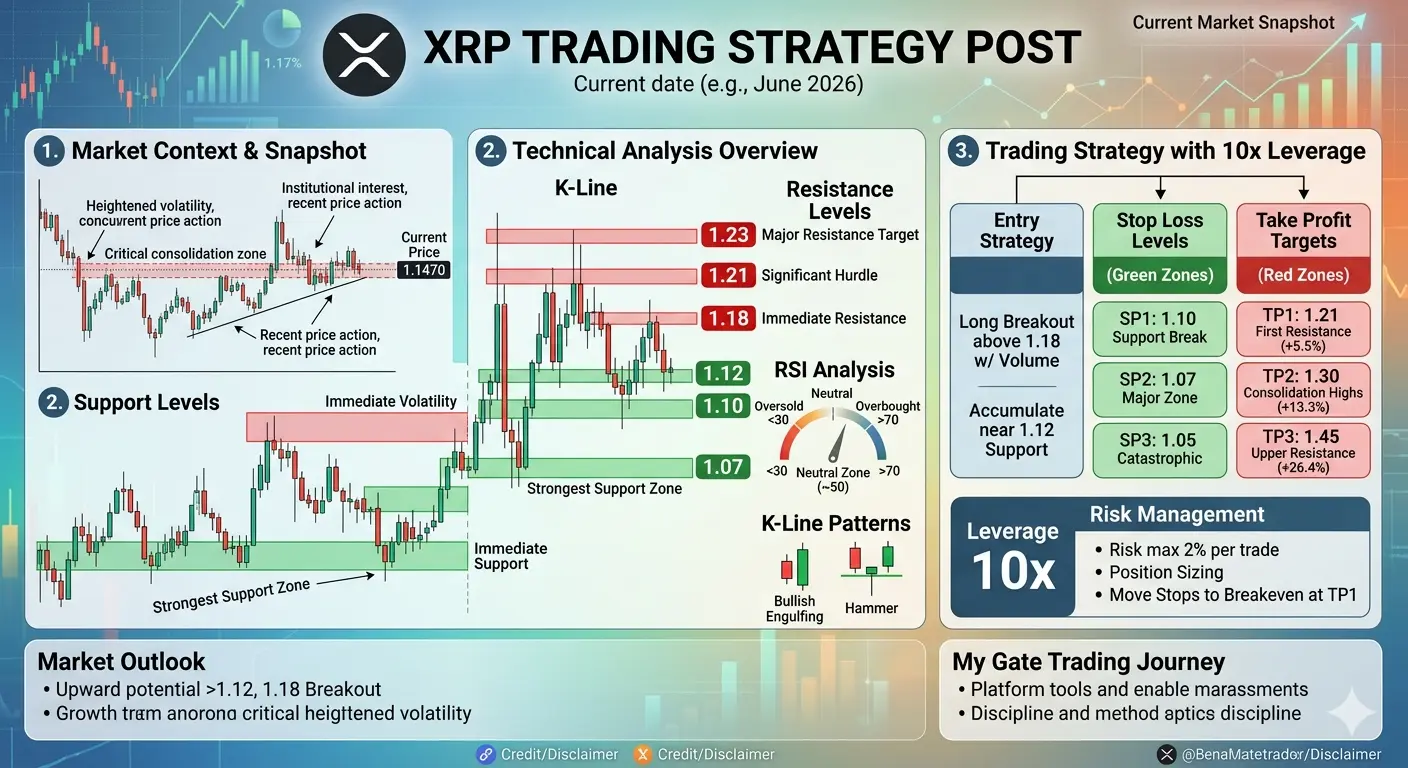
XRP is currently trading at 1.1470, positioning itself in a critical consolidation zone. The cryptocurrency has been experiencing heightened volatility as institutional interest grows and regulatory clarity continues to evolve. Recent price action suggests a potential breakout scenario is developing, with traders closely monitoring key technical levels.
Technical Analysis Overview
Support Levels
The immediate support for XRP stands at 1.12, which has acted as a reliable floor during recent pullbacks. Below this, secondary support is located at 1.10, representing the previous consolidation range low. The strongest support zone sits at 1.07, a level that has historically provided substantial buying interest and could serve as a safety net for long positions.
Resistance Levels
On the upside, XRP faces immediate resistance at 1.18, which aligns with the recent rejection zone. The next significant hurdle is 1.21, where previous selling pressure has been observed. The major resistance target is 1.23, a breakout above which could trigger a sustained rally toward higher price targets.
RSI Analysis
The Relative Strength Index is currently reading in the neutral zone, indicating that XRP is neither overbought nor oversold. This positioning provides room for movement in either direction. A reading below 30 would signal oversold conditions and potential buying opportunities, while readings above 70 would suggest overbought conditions and possible profit-taking scenarios.
K-Line Patterns
Recent candlestick formations show mixed signals with some indecision patterns emerging. The presence of higher lows on the daily timeframe suggests underlying bullish sentiment, though volume confirmation remains essential for validating any breakout attempts. Traders should watch for bullish engulfing patterns or hammer formations near support levels as potential entry signals.
Trading Strategy with 10x Leverage
Given the current price of 1.1470 and utilizing 10x leverage, here is a structured trading plan designed for optimal risk management.
Entry Strategy
Consider entering a long position if XRP breaks above 1.18 with volume confirmation. Alternatively, accumulate on dips toward the 1.12 support level with scaled entries. The position sizing should account for the 10x leverage multiplier, meaning a 10 percent move in price results in a 100 percent gain or loss on the leveraged position.
Stop Loss Levels
Protect your capital with strategic stop loss placement. Set SP1 at 1.10, representing a break below immediate support. Position SP2 at 1.07, the strongest support zone, as a secondary protection level. Maintain SP3 at 1.05 as a catastrophic stop to preserve account equity in case of unexpected market events.
Take Profit Targets
Plan your exits with disciplined profit-taking levels. Target TP1 at 1.21, capturing the first resistance zone for a 5.5 percent price move. Set TP2 at 1.30, representing a 13.3 percent gain and aligning with recent consolidation highs. Position TP3 at 1.45 for a 26.4 percent move, targeting the upper resistance zone and maximizing the risk-reward ratio.
Risk Management
With 10x leverage, risk management becomes paramount. Never risk more than 2 percent of your total trading capital on a single trade. Use position sizing calculations to determine appropriate entry amounts based on your stop loss distance. Monitor the trade actively and be prepared to adjust stops to breakeven once TP1 is achieved.
Market Outlook
XRP shows potential for upward movement if it can maintain support above 1.12 and break through the 1.18 resistance. The neutral RSI provides flexibility for both bullish and bearish scenarios. Institutional developments and broader market sentiment will likely dictate the next major directional move.
My Gate Trading Journey
Trading on Gate has provided access to advanced leverage options and comprehensive charting tools essential for executing this strategy. The platform's robust infrastructure supports precise entry and exit execution, which is critical when trading with leverage. Consistent application of technical analysis and disciplined risk management has been the foundation of successful trading outcomes.
Final Thoughts
This XRP trading setup offers a balanced approach with clear entry, exit, and risk management parameters. The 10x leverage amplifies both potential gains and losses, making strict adherence to stop losses essential. Monitor price action closely and adjust the strategy as market conditions evolve.
@Gate_Square
repost-content-media
XRP-7.73%
#PredictWorldCup🇩🇪vs🇨🇮
Germany vs Ivory Coast 2026 FIFA World Cup Match Prediction
Match Details:
Germany and Ivory Coast face off in a crucial Group E encounter on June 20, 2026, at BMO Field in Toronto, Canada. This matchday 2 fixture carries significant weight as both teams enter with 3 points from their opening games. Germany demolished Curacao 7-1 in their first match, while Ivory Coast secured a hard-fought 1-0 victory over Ecuador courtesy of a late Amad Diallo strike.
Polymarket Prediction Market Analysis:
According to Polymarket data, Germany holds a commanding position in the Gr
HighAmbition
#PredictWorldCup🇩🇪vs🇨🇮
Germany vs Ivory Coast 2026 FIFA World Cup Match Prediction
Match Details:
Germany and Ivory Coast face off in a crucial Group E encounter on June 20, 2026, at BMO Field in Toronto, Canada. This matchday 2 fixture carries significant weight as both teams enter with 3 points from their opening games. Germany demolished Curacao 7-1 in their first match, while Ivory Coast secured a hard-fought 1-0 victory over Ecuador courtesy of a late Amad Diallo strike.
Polymarket Prediction Market Analysis:
According to Polymarket data, Germany holds a commanding position in the Group E winner market at 74 cents, with Ivory Coast trailing at 21 cents. This represents one of the most lopsided markets across the entire FIFA World Cup ecosystem on the prediction platform. The market sentiment heavily favors the four-time world champions, reflecting their overwhelming squad depth and attacking prowess demonstrated in their opening match.
Team Form and Statistics:
Germany enters this fixture in scintillating form under manager Julian Nagelsmann. Die Mannschaft have scored 10 goals across their last three international matches and found the back of the net first in 9 of their last 10 outings. The attacking quartet of Jamal Musiala, Florian Wirtz, Kai Havertz, and Thomas Muller provides creativity and finishing ability that few teams can match. Germany's defensive solidity was evident despite conceding once against Curacao, a match where they dominated possession and created numerous chances.
Ivory Coast arrives with confidence after their first World Cup appearance in 12 years. The Elephants have won five of their last six matches, including a notable 2-1 friendly victory over France. Their defensive organization against Ecuador showcased their ability to grind out results, with Yan Diomande earning FIFA Player of the Match honors. However, they will be without striker Elye Wahi, who was denied entry to Canada due to match-fixing allegations, potentially weakening their attacking options.
Head-to-Head History:
These nations have met only once at senior level, playing out a 2-2 draw in a friendly at Veltins-Arena in Gelsenkirchen on November 18, 2009. That historical result offers little guidance given the vastly different circumstances and personnel involved 17 years later.
Tactical Breakdown:
Germany's approach centers on controlling possession through their technically gifted midfield, stretching opponents with overlapping full-backs, and exploiting spaces with intricate passing combinations. Nagelsmann's system demands high pressing and quick transitions, overwhelming opponents with sustained attacking pressure.
Ivory Coast will likely adopt a counter-attacking strategy, utilizing the pace of Amad Diallo and Yan Diomande on the break. Their success against Ecuador demonstrated discipline and organization, but facing Germany's relentless attack presents a different caliber of challenge entirely.
Key Factors:
The Toronto venue favors neither side significantly, though Germany's experience in major tournaments provides a psychological edge. Ivory Coast's confidence from their opening victory should not be underestimated, yet the quality gap between the squads remains substantial. Germany's ability to rotate fresh legs while maintaining performance levels adds another dimension to their advantage.
My Prediction:
Germany will secure a 3-1 victory over Ivory Coast. The Germans' superior attacking firepower and squad depth should prove decisive, though Ivory Coast's counter-attacking threat means they will likely find the net. Expect Germany to control possession from the outset, creating numerous chances through their creative midfielders, while Ivory Coast attempts to stay compact and hit on the break.
The match promises to be an entertaining encounter with Germany ultimately demonstrating why they are considered among the tournament favorites. Their combination of youth and experience, tactical flexibility under Nagelsmann, and momentum from their opening demolition of Curacao positions them strongly to claim all three points and effectively secure passage to the knockout stages.
repost-content-media
#广场预测世界杯赢40000U
Tunisia vs Japan: World Cup 2026 Group F Match Analysis - Based on Polymarket Predictions
The upcoming clash between Tunisia and Japan in Group F of the 2026 FIFA World Cup presents a fascinating tactical battle between two teams at very different stages of their tournament campaigns. Scheduled for June 20, 2026 at Estadio BBVA in Guadalupe, Mexico, this fixture carries significant weight for both nations as they seek to advance from what many consider one of the more competitive groups in this expanded 48-team tournament.
Polymarket Prediction Market Analysis
According to Poly
HighAmbition
#广场预测世界杯赢40000U
Tunisia vs Japan: World Cup 2026 Group F Match Analysis - Based on Polymarket Predictions
The upcoming clash between Tunisia and Japan in Group F of the 2026 FIFA World Cup presents a fascinating tactical battle between two teams at very different stages of their tournament campaigns. Scheduled for June 20, 2026 at Estadio BBVA in Guadalupe, Mexico, this fixture carries significant weight for both nations as they seek to advance from what many consider one of the more competitive groups in this expanded 48-team tournament.
Polymarket Prediction Market Analysis
According to Polymarket, the world's largest prediction market, Japan enters this matchup as the clear favorite with traders assigning approximately 64.5% implied probability for a Japanese victory. This substantial market confidence reflects not just Japan's superior squad depth and recent form, but also the contrasting circumstances both teams face heading into this crucial second group game.
The prediction market data reveals that Japan's odds have remained relatively stable, supported by their resilient performance in their opening match against the Netherlands, where they secured a valuable 2-2 draw despite falling behind twice. Tunisia, meanwhile, finds itself in turmoil following a humiliating 5-1 defeat to Sweden in their opener, a result that led to the immediate dismissal of their manager and the appointment of an interim coach just days before facing Japan.
Team Form and Current Situation
Japan demonstrated remarkable character in their opening fixture against the Netherlands, one of the tournament favorites. Under the guidance of head coach Hajime Moriyasu, who has been in charge for nearly eight years, Japan showcased their tactical flexibility and mental resilience. The Samurai Blue pulled level twice through goals from Keito Nakamura and Daichi Kamada, with the equalizer coming in the 88th minute. This result has put Japan in a strong position to advance, and a victory against Tunisia would virtually secure their passage to the knockout stages.
The Japanese squad features an impressive blend of experienced campaigners and emerging talents. Takefusa Kubo remains their most important attacking option, capable of unlocking defenses with his dribbling and vision. Ritsu Doan provides width and creativity from the flanks, while Ayase Ueda offers a genuine goal threat through the center. The team's depth is evidenced by the fact that quality players like Takehiro Tomiyasu sometimes find themselves on the bench. Japan's tactical system under Moriyasu emphasizes high pressing, quick transitions, and structured possession play that has proven effective against both Asian and European opposition.
Tunisia, by contrast, approaches this match in a state of crisis. The Eagles of Carthage suffered their heaviest World Cup defeat in the opening game against Sweden, conceding five goals in a performance that exposed significant defensive frailties and a lack of cohesion throughout the team. The 5-1 loss prompted the Tunisian Football Federation to take immediate action, replacing their coach with an interim appointment. This upheaval comes at the worst possible time, with the team needing to regroup quickly to salvage their tournament hopes.
The North African side had actually qualified for the World Cup with an impressive defensive record, becoming the first nation in history to complete a World Cup qualifying campaign without conceding a single goal. However, that defensive solidity completely evaporated against Sweden, raising serious questions about their ability to compete at this level. Key players like Ellyes Skhiri, Hannibal Mejbri, and Yassine Meriah will need to rediscover their form quickly if Tunisia is to have any chance of upsetting the odds.
Tactical Breakdown and Key Matchups
From a tactical perspective, this match presents a clear contrast in styles. Japan will look to dominate possession, using their technical superiority and quick passing combinations to break down what is expected to be a compact Tunisian defensive block. Moriyasu's side typically operates with a fluid system that can shift between different formations, often utilizing a back three that allows their wing-backs to push high and create overloads in wide areas.
Tunisia's best hope lies in organization and discipline. Under their new interim management, they are expected to adopt a more defensive approach, looking to frustrate Japan and hit on the counter-attack when opportunities arise. The Eagles of Carthage possess pace in wide areas and physical presence in midfield, but their confidence will be fragile after the Sweden debacle. Set pieces could represent their most likely route to goal, given Japan's occasional vulnerability in defending aerial situations.
The midfield battle will be crucial. Japan's Kaishu Sano is expected to anchor their midfield, providing the platform for more creative players to influence the game. Tunisia will rely on experienced campaigners like Skhiri to disrupt Japan's rhythm and protect their backline. If Tunisia can successfully congest the central areas and force Japan wide, they may be able to limit the clear-cut chances their opponents create.
My Analysis and Prediction
Based on the available evidence, including Polymarket's prediction data and the respective form of both teams, I believe Japan will secure victory in this encounter. The 64.5% implied probability assigned by prediction market traders aligns with my assessment of the matchup.
Japan's advantages are multiple and significant. They possess superior technical quality, better tactical organization, greater squad depth, and crucially, they enter the match with confidence intact following their impressive comeback against the Netherlands. The stability provided by Moriyasu's long tenure and the clear identity he has established for this team cannot be overstated. Japan knows exactly what they are trying to achieve and has the players capable of executing that game plan.
Tunisia faces an almost impossible task in trying to turn around their fortunes so quickly after the managerial change and heavy defeat. While they have quality players who performed admirably during qualification, the psychological damage of the Sweden result combined with the disruption of changing coaches makes a significant improvement unlikely. Their defensive record in qualifying suggests they are capable of better, but the step up in competition has exposed limitations that will be difficult to address in just a few days.
The match will likely follow a pattern where Japan controls possession and probes for openings, while Tunisia attempts to remain compact and look for counter-attacking opportunities. Japan's patience and ability to vary their attacking approach should eventually tell, particularly as the game progresses and Tunisian legs tire from defending deep.
I predict Japan will win this match by a scoreline of 2-0 or 2-1. The Japanese victory probability in my estimation is approximately 70%, slightly higher than the Polymarket consensus, reflecting my belief that Tunisia's off-field turmoil will prove decisive. A draw, while possible if Tunisia can rediscover their defensive organization, appears unlikely given the contrasting momentum of the two sides
Broader Group F Implications
This match carries significant implications for the final Group F standings. The Netherlands and Sweden are the other two teams in the group, with the Dutch being heavy favorites to top the section. Japan's draw against the Netherlands puts them in a strong position, and victory against Tunisia would likely set up a decisive final match against Sweden for group supremacy or secure qualification.
For Tunisia, defeat would almost certainly eliminate them from contention, making their final match against the Netherlands a mere formality. Even a draw would leave them needing an improbable combination of results in the final round of fixtures. The pressure is therefore immense on the North African side, which may paradoxically work against them as they face a Japanese team that can afford to play with more patience and confidence.
Conclusion
The Tunisia versus Japan match represents a classic World Cup group stage encounter between a team in crisis and a team building momentum. The prediction markets, team form, tactical analysis, and psychological factors all point toward a Japanese victory. While football occasionally produces surprises that defy logic and probability, the circumstances surrounding this particular fixture make an upset highly unlikely.
Japan's blend of technical excellence, tactical sophistication, and mental resilience developed under Moriyasu's long-term project should prove too much for a Tunisian side struggling to recover from their opening game trauma. The Samurai Blue have the opportunity to take a significant step toward the knockout stages, and I expect them to seize it with a professional performance that reflects their status as one of Asia's most progressive football nations.
For Tunisia, this match represents a damage limitation exercise and an opportunity to restore some pride. Realistically, their World Cup campaign may already be over before this second game kicks off, but sport has a way of producing unexpected narratives. However, based on all available evidence and analysis, Japan's victory appears the most probable outcome, with the prediction markets correctly identifying the likely winner of this Group F encounter.
@Gate_Square
#认证创作者专属推广任务
repost-content-media
#PredictWorldCupWin40000U
Ghana vs Panama is expected to be a competitive and tactically interesting encounter, where both teams bring very different styles of play to the pitch.
🔎 Team Overview
Ghana Ghana enter this match with a reputation for physical strength, fast transitions, and strong attacking talent. Their midfield is usually energetic, allowing them to press high and recover the ball quickly. In international tournaments, Ghana often performs better against teams that try to play open football.
Key strengths:
Strong physical presence
Fast counter-attacks
Dangerous wide players
Hig
HighAmbition
#PredictWorldCupWin40000U
Ghana vs Panama is expected to be a competitive and tactically interesting encounter, where both teams bring very different styles of play to the pitch.
🔎 Team Overview
Ghana Ghana enter this match with a reputation for physical strength, fast transitions, and strong attacking talent. Their midfield is usually energetic, allowing them to press high and recover the ball quickly. In international tournaments, Ghana often performs better against teams that try to play open football.
Key strengths:
Strong physical presence
Fast counter-attacks
Dangerous wide players
High pressing intensity
Weak points:
Defensive inconsistency under pressure
Sometimes lack control in midfield possession phases
Panama Panama are known for their disciplined defensive structure and compact shape. They rely heavily on teamwork, organization, and patience rather than individual brilliance. Against stronger opponents, they often sit deep and look for counter-attacking chances or set-pieces.
Key strengths:
Very organized defense
Good tactical discipline
Effective counter-attacks
Strong teamwork cohesion
Weak points:
Limited attacking creativity
Struggle when chasing possession for long periods
⚔️ Tactical Battle
This match will likely be decided in midfield. Ghana will try to dominate physically and increase tempo, while Panama will aim to slow the game down and frustrate Ghana’s attacking rhythm.
If Ghana score early → they can control the game comfortably
If Panama stay compact early → match becomes tight and low-scoring
Set-pieces could also play a major role, especially for Panama.
📊 Match Prediction
Based on overall squad quality, experience, and attacking depth:
Ghana win probability: 55%
Draw probability: 25%
Panama win probability: 20%
🧠 Final Prediction
Ghana have a slight edge in terms of quality and attacking power, but Panama’s defensive discipline makes this a tricky matchup.
Expected Result:
Ghana 1–0 Panama or 2–1 Ghana
📌 Summary
This is not an easy match for either side. Ghana are favorites, but Panama can definitely make it a close contest if they stay organized and capitalize on counter-attacks.
repost-content-media
#MyGateTradeStory
Worldcoin represents one of the most fascinating projects in the cryptocurrency space, combining digital identity verification with blockchain technology. Founded by Sam Altman of OpenAI fame, WLD has captured significant attention from both retail and institutional traders. This detailed analysis covers everything you need to know about trading WLD at current levels around 0.66.
Project Fundamentals and Market Position
Worldcoin operates at the intersection of artificial intelligence, digital identity, and cryptocurrency. The project has achieved remarkable scale with over
HighAmbition
#MyGateTradeStory
Worldcoin represents one of the most fascinating projects in the cryptocurrency space, combining digital identity verification with blockchain technology. Founded by Sam Altman of OpenAI fame, WLD has captured significant attention from both retail and institutional traders. This detailed analysis covers everything you need to know about trading WLD at current levels around 0.66.
Project Fundamentals and Market Position
Worldcoin operates at the intersection of artificial intelligence, digital identity, and cryptocurrency. The project has achieved remarkable scale with over 30 million World App users and approximately 15 to 17.9 million verified humans globally. This massive user base provides WLD with a unique value proposition in the crypto ecosystem. The token derives its value from the narrative of proof-of-personhood becoming essential infrastructure in an AI-dominated future. However, investors should note that direct token utility and monetization mechanisms remain works in progress, making WLD primarily a narrative-driven speculative asset at this stage.
Current Market Status and Price Action
WLD is currently trading at approximately 0.66, representing a significant recovery from lows near 0.33 seen in late May 2026. The token has posted impressive gains of over 70% in recent weeks, driven by a combination of whale accumulation, increased network activity, and broader AI sector enthusiasm. Daily trading volume has surged to approximately 1.22 billion dollars, indicating strong liquidity and active participation from market participants. Open interest in derivatives markets has climbed above 449 million dollars, suggesting substantial leveraged positioning in the market.
Support and Resistance Analysis
Understanding key price levels is essential for successful WLD trading. Immediate support is established at 0.62 to 0.65, representing the recent breakout zone that has now flipped from resistance to support. This area is critical for maintaining bullish momentum. Secondary support exists at 0.5677, a level that previously acted as resistance and now provides a safety net for pullbacks. Deeper support can be found at 0.55, where the 200-day moving average currently sits, and at 0.504, which aligns with the 23.6% Fibonacci retracement level.
On the resistance side, immediate resistance is located at 0.6736, representing the 2026 high and a significant psychological barrier. Above this, the 0.70 to 0.75 zone presents the next major resistance cluster where profit-taking is likely to intensify. The 38.2% Fibonacci retracement level sits at approximately 0.676, adding confluence to this resistance area. Further upside targets include 0.80 and ultimately 0.85, though these levels would require sustained bullish momentum and favorable market conditions.
Moving Average Analysis
The moving average structure for WLD has turned increasingly bullish. The 50-day moving average currently sits at approximately 0.40, while the 200-day moving average is positioned near 0.40 as well. This convergence indicates a period of consolidation that is now resolving to the upside. The 20-day exponential moving average provides dynamic support near current levels, while the 100-day EMA sits around 0.35, offering a deeper safety net for any significant corrections.
Price action above all major moving averages is a bullish signal that suggests the trend has shifted from bearish to bullish. Traders should watch for the 50-day MA to cross decisively above the 200-day MA, which would confirm a golden cross formation and potentially trigger additional buying interest from systematic traders.
RSI and Momentum Indicators
The Relative Strength Index for WLD is currently reading approximately 66.3 on the 14-period setting, placing it in neutral to slightly bullish territory. This reading indicates that while momentum is positive, the token is not yet in overbought conditions that would suggest an imminent correction. The RSI has room to extend toward 70 or higher before reaching extreme levels.
The MACD indicator shows bullish alignment with the signal line below the MACD line, though the histogram indicates some caution as momentum may be plateauing. The stochastic oscillator provides additional confirmation of bullish conditions, with readings suggesting continued upside potential before reaching overbought extremes.
Volume and On-Chain Analysis
Trading volume analysis reveals strong institutional and whale interest in WLD. Whale transactions exceeding 100,000 dollars have hit yearly highs, indicating that smart money is accumulating positions at current levels. This whale activity often precedes significant price movements and should be monitored closely by retail traders.
Network activity has received a boost from the integration of Oku Trade into the World App, which introduced weekly rewards of up to 100 WLD for users participating in token swaps. This creates organic transactional demand within the ecosystem and supports price stability.
Fibonacci Retracement Levels
Applying Fibonacci analysis to the recent price action provides additional precision for entry and exit planning. The 23.6% retracement level at 0.504 serves as immediate support, while the 38.2% level at 0.676 coincides with major resistance. The 50% retracement would place support at approximately 0.50, and the 61.8% golden ratio retracement sits near 0.46. These levels should be monitored for potential bounce opportunities during any corrective phases.
Spot Trading Strategy for Conservative Traders
For conservative spot traders, the optimal entry strategy involves waiting for pullbacks toward the 0.62 to 0.65 support zone. This area offers a favorable risk-reward ratio with clearly defined stop loss placement below 0.60. Position sizing should be calculated to risk no more than 2% to 3% of total portfolio value on this trade.
Entry targets include 0.63 for initial scaling in, with additional purchases at 0.60 if the market provides deeper discounts. Stop loss should be placed at 0.58 to protect capital in case of trend failure. Take profit targets are set at 0.70 for 50% of the position, 0.75 for 75% closure, and trailing stops for any remaining exposure above 0.75.
Aggressive Spot Trading Approach
Aggressive traders may consider entering at current levels near 0.66, accepting higher risk for immediate exposure to potential upside momentum. This approach requires tighter stop loss management at 0.62 to limit downside. Position size should be smaller than the conservative approach to account for the less favorable entry price.
The aggressive strategy targets quick moves to 0.70 for partial profits, with the remaining position aiming for 0.75 to 0.80. This approach works best in strong trending markets and requires active monitoring of positions.
Long Position Strategy
Long positions are favored while WLD maintains support above 0.62. The technical setup supports leveraged longs with appropriate risk management. Entry points for long positions include current levels or any dips toward 0.63 to 0.65.
Stop loss for long positions should be placed at 0.60, representing a breakdown of the recent breakout structure. Target 1 is set at 0.70, Target 2 at 0.75, and Target 3 at 0.80 for extended moves. The risk-reward ratio for this setup is approximately 1 to 3, making it attractive from a probability perspective.
Short Position Strategy
Short positions should only be considered if WLD fails to hold the 0.62 support level on a daily closing basis. Entry for shorts would trigger on a confirmed break below 0.62 with targets at 0.58 and 0.55. Stop loss for short positions should be placed above 0.66.
Given the current bullish momentum and whale accumulation, shorting WLD carries elevated risk and should be attempted only by experienced traders with strict risk management protocols.
Swing Trading Plan
Swing traders should focus on the 0.60 to 0.75 range for the coming weeks. Entries near range lows with exits near range highs offer predictable profit opportunities. The strategy involves buying dips to 0.62 to 0.65 and selling rallies to 0.70 to 0.73, repeating this cycle as long as the range holds.
Breakout traders should prepare for potential expansion above 0.75, which could trigger a rapid move toward 0.85 or higher. Conversely, a breakdown below 0.60 would invalidate the bullish structure and suggest a deeper correction toward 0.50.
Day Trading Considerations
Day traders should focus on the 15-minute and hourly charts for intraday opportunities. Key levels to watch include 0.65 as intraday support and 0.68 as immediate resistance. Scalping opportunities exist in the 0.65 to 0.68 range for quick profits.
Volume profile analysis suggests that 0.66 represents a high-volume node where significant trading activity occurs, making it a pivot point for intraday direction. Breaks above 0.68 with volume support bullish continuation, while rejection at this level suggests range-bound action.
Risk Management Framework
Proper risk management is essential for WLD trading success. Never risk more than 2% to 3% of your trading capital on any single trade. Use stop losses on every position without exception. Consider scaling into positions rather than entering with full size immediately. Take partial profits at resistance levels to reduce risk while maintaining upside exposure.
Position sizing should account for WLD's volatility, which can see 10% to 20% daily moves. Smaller position sizes are appropriate for this high-beta asset. Always maintain cash reserves for adding to winning positions or averaging down on high-conviction setups.
Market Sentiment and Catalysts
WLD price action is heavily influenced by AI sector sentiment and news related to OpenAI and Sam Altman. Positive developments in AI adoption typically benefit WLD due to its association with the AI narrative. Regulatory developments regarding digital identity verification also impact price action, with favorable regulations supporting upside and restrictive policies creating headwinds.
Upcoming catalysts include potential exchange listings, protocol upgrades, and partnership announcements. Traders should monitor official Worldcoin channels and crypto news sources for developments that could impact price.
Long-Term Price Outlook
Analyst forecasts suggest WLD could reach maximum prices of 0.6736 in 2026, with average prices around 0.5427. Looking further ahead, projections indicate potential prices between 1.81 and 2.17 by 2029 if adoption and market demand improve significantly. By 2032, some forecasts suggest WLD could climb to maximum prices of 3.57, though these long-term projections carry substantial uncertainty.
Common Trading Mistakes to Avoid
Avoid chasing prices after large green candles, as these often mark local tops. Do not average down on losing positions without a clear technical reason. Never trade without stop losses, especially in volatile altcoins like WLD. Avoid overleveraging, as WLD's volatility can liquidate positions quickly. Do not ignore the broader market context, as Bitcoin's direction heavily influences altcoin performance.
Summary for Active Traders
WLD at 0.66 presents a bullish trading opportunity with clearly defined risk parameters. The key level to watch is 0.62 to 0.65 support, which must hold for the bullish structure to remain intact. Entries on dips toward this zone offer the best risk-reward ratios, with stop losses below 0.60 protecting against trend failure. Upside targets extend to 0.70, 0.75, and potentially 0.80 for sustained momentum.
repost-content-media
#MyGateTradeStory
Micron Technology has emerged as a direct beneficiary of the artificial intelligence revolution. The stock has delivered a historic 760 percent rally over the past 12 months, yet it now sits at a critical juncture where smart traders must understand both sides of the trade. At the current price of 1080, the stock sits in extreme overbought territory, yet the AI demand fundamentals remain unprecedented. This tension between technical overextension and fundamental strength will define trading decisions going forward.
Deep Technical Picture
The monthly RSI stands at 98.96 accor
HighAmbition
#MyGateTradeStory
Micron Technology has emerged as a direct beneficiary of the artificial intelligence revolution. The stock has delivered a historic 760 percent rally over the past 12 months, yet it now sits at a critical juncture where smart traders must understand both sides of the trade. At the current price of 1080, the stock sits in extreme overbought territory, yet the AI demand fundamentals remain unprecedented. This tension between technical overextension and fundamental strength will define trading decisions going forward.
Deep Technical Picture
The monthly RSI stands at 98.96 according to Dow Jones Market Data, which represents a phenomenally overbought reading. Normal overbought conditions trigger at 70, making 98.96 virtually unheard of. This indicates the price has risen so rapidly that a correction or consolidation now carries higher statistical probability than continued straight-line upward momentum. The daily RSI hovers in the 65 to 70 range, while the Stochastic K (14) on shorter timeframes reads 92.39, confirming overbought conditions across multiple timeframes. This dual overbought signal spanning monthly and daily charts represents the most significant technical warning currently in play.
K-Line Pattern Analysis
The 5-minute and hourly charts reveal an ascending triangle formation with flat resistance between 1057 and 1100 and rising support creating higher lows. This pattern typically resolves upward, but given the extreme RSI readings, a false breakout followed by sharp reversal carries equal probability. On the macro scale, the stock sits at the median line of a multi-decade mega macro pitchfork intersecting with the 1.618 Fibonacci extension. This represents one of the highest resistance zones on the entire long-term chart, compressing upside potential and elevating rejection risk.
Detailed Support Levels
Support 1 sits at 1050 as the immediate floor below current price. This level can absorb intraday volatility but lacks strong buying pressure. Support 2 at 1000 marks the psychological round number and simultaneously serves as a major put strike where institutional options flow concentrates. Large bearish put prints totaling 5.6 million dollars in premium have appeared here. Support 3 between 927 and 900 represents the next downside cluster with heavy put positioning exceeding 21 million dollars in premium. Support 4 at 884 marks a previous consolidation zone where buyers stepped in previously. Support 5 between 820 and 774 serves as a deep safety net only reachable in significant correction scenarios. Support 6 at 740 aligns with the 50-day moving average, important for trend-following traders. Support 7 at 684 matches Raymond James position trading entry zone monitored by long-term investors. Support 8 at 650 marks the next major horizontal support. Support 9 at 600 provides round number psychological support. Support 10 at 550 marks multi-month trend line support where bearish structure would confirm upon break.
Detailed Resistance Levels
Resistance 1 at 1100 forms the immediate ceiling just above current levels. This level has tested repeatedly and produced rejections. Resistance 2 at 1120 marks the short-term pivot cluster. Resistance 3 at 1150 represents the next psychological barrier. Resistance 4 at 1180 marks previous swing high resistance. Resistance 5 at 1212 represents major pivot cluster where sellers have historically remained active. Resistance 6 at 1250 marks the ascending channel upper boundary. Resistance 7 at 1292 represents higher Fibonacci extension target. Resistance 8 at 1350 marks the 1.272 Fibonacci extension. Resistance 9 at 1450 represents measured move target from breakout pattern. Resistance 10 at 1500 aligns with TD Cowen and Motley Fool price targets for late 2027. Resistance 11 at 1600 marks next round number resistance. Resistance 12 at 1750 matches Susquehanna analyst maximum price target possible with AI cycle continuation. Resistance 13 at 2000 marks psychological round number that could become meme target in extreme bull run.
Take Profit Levels for Long Positions
Take Profit 1 at 1120 captures quick momentum. Take Profit 2 at 1150 marks initial target. Take Profit 3 at 1180 targets swing high break. Take Profit 4 at 1212 marks major pivot resistance. Take Profit 5 at 1250 targets channel upper boundary. Take Profit 6 at 1292 marks Fibonacci extension target. Take Profit 7 at 1350 marks extended target. Take Profit 8 at 1450 marks measured move completion. Take Profit 9 at 1500 marks analyst consensus target. Take Profit 10 at 1600 marks extended bull case target.
Stop Loss Levels for Long Positions
Stop Loss 1 at 1070 provides tight scalp protection. Stop Loss 2 at 1050 marks immediate support break. Stop Loss 3 at 1030 provides buffer zone. Stop Loss 4 at 1000 marks psychological level protection. Stop Loss 5 at 980 allows extended volatility. Stop Loss 6 at 950 marks major structure break. Stop Loss 7 at 920 marks deep correction level. Stop Loss 8 at 900 marks maximum risk tolerance. Stop Loss 9 at 880 marks trend invalidation. Stop Loss 10 at 850 confirms bearish structure.
Short Setup Levels
Short entry zone spans 1057 to 1100 on rejection at resistance with RSI confirmation above 70. Short stop loss sits above 1110 to 1150 above next pivot cluster. Short target 1 at 1020 marks initial downside. Short target 2 at 1000 marks large put strike magnet. Short target 3 at 980 marks next support cluster. Short target 4 at 950 marks extended move. Short target 5 between 927 and 900 marks institutional downside bet concentration. Short target 6 at 880 marks previous consolidation. Short target 7 at 850 marks major support break. Short target 8 between 820 and 774 marks deep correction zone. Short target 9 at 750 marks long-term moving average. Short target 10 at 700 marks bearish extension.
Fundamental Catalysts
The June 24 earnings report stands as the single biggest catalyst on the calendar. Micron reported Q2 2026 revenue of 23.86 billion dollars, up 196.3 percent year over year, with 74.4 percent gross margins. Q3 guidance calls for 33.5 billion dollars in revenue and 81 percent margins. NVIDIA certified Micron as HBM4 supplier for the Vera Rubin platform. TD Cowen raised price target from 660 to 1500 citing sustained AI demand. Raymond James lifted target from 530 to 1100. Susquehanna issued maximum target of 1750. Thirty analysts maintain consensus Buy rating. However, insiders are net selling while the stock has surged 776 percent. Memory margins historically collapse below 30 percent in downturns, and current 74 percent margins signal classic peak-cycle setup. Micron and Sandisk have both sold out 2026 production capacity, which appears bullish but risks overstocked supply chain if demand slows.
Risk Factors
Monthly RSI at 98.96 marks extreme overbought. Price sits at macro pitchfork median line and 1.618 Fibonacci extension intersection. Institutional put flow concentrates heavily at 1000 and 900 strikes. Memory cycles historically prove volatile. AI capex cut risk exists if Microsoft or other big tech slows spending. Geopolitical tensions can affect semiconductor supply chains. Interest rate environment challenges growth stocks. Valuation at 9 times forward earnings appears reasonable but carries multiple compression risk on earnings miss.
Trading Strategy Recommendations
Aggressive scalpers can take longs in the 1050 to 1100 zone with tight stops below 1040, targeting 1120 to 1150. Conservative traders should wait for pullback to 927 to 1000 zone with confirmation of support holding. Swing traders should wait for ascending triangle breakout above 1100 with volume confirmation, targeting 1212 to 1250. Short sellers should hunt rejection candles between 1080 to 1100 with RSI above 70 confirmation, stops above 1120, initial targets 1000 to 1020. Reduce position size before June 24 earnings because earnings gap risk runs elevated. Risk management remains paramount given volatility.
Market Structure Analysis
EMA200 on 1-hour timeframe provides dynamic support and recent bounces have maintained bull trend. Golden crosses with 9-period above 21-period on 1H and 4H charts confirm constructive momentum. However, 50-period SMA sits at 240 and 200-period SMA at 148, meaning current price at 1080 stretches extreme distances above these benchmarks. Historical mean reversion probability increases when price stretches this far from key moving averages.
Volume Profile
Accumulation zone appears between 1000 and 1080, providing solid foundation for further upside if demand sustains. Distribution signs remain non-obvious but declining volume on new highs signals caution. Options flow data reveals institutional positioning with large put premium at 1000 and 900 strikes suggesting downside hedging or outright bearish bets.
Conclusion
MU at 1080 sits at a fascinating crossroads. AI fundamentals remain undeniable yet technical overextension proves equally undeniable. Smart traders play both sides, with institutional money placing large downside bets through options while analyst consensus remains bullish. The next two weeks leading into June 24 earnings will define whether this stock continues its historic run or whether the memory cycle peak theory takes center stage. Watch the 1000 level like a hawk because massive put flow concentrates here and psychological significance creates gravitational pull. Break below 1000 with volume opens door to 900 quickly. Bounce off 1000 with strong buying creates base for another leg toward 1100 and beyond. Trade wisely.#MyGateTradingMoment
repost-content-media
#MyGateTradeStory
Every trader remembers that one trade that completely changes the way they look at the market. Some people make life-changing profits from Bitcoin, while others find hidden opportunities in smaller projects. For me, that unforgettable experience came through ESPORTS on Gate.
About a month ago, the crypto market was going through a difficult period. Fear was everywhere. Many altcoins were falling aggressively, and ESPORTS was one of the projects that suffered a dramatic decline. The token crashed heavily, and its price dropped to nearly $0.007. Most traders had already lost h
HighAmbition
#MyGateTradeStory
Every trader remembers that one trade that completely changes the way they look at the market. Some people make life-changing profits from Bitcoin, while others find hidden opportunities in smaller projects. For me, that unforgettable experience came through ESPORTS on Gate.
About a month ago, the crypto market was going through a difficult period. Fear was everywhere. Many altcoins were falling aggressively, and ESPORTS was one of the projects that suffered a dramatic decline. The token crashed heavily, and its price dropped to nearly $0.007. Most traders had already lost hope. Social media platforms were full of negative comments, predictions of further declines, and warnings to stay away from the project.
I still remember opening the chart and seeing the damage caused by the sell-off. Red candles dominated the screen. Many investors who had bought at higher levels were exiting their positions in panic. The atmosphere was extremely negative. Whenever a project experiences such a sharp decline, people start believing that recovery is impossible.
At that time, I did not have a large trading account. In fact, I had only $10 available to invest. For many people, $10 may seem too small to make a difference, but I have always believed that successful trading is not determined by the size of the capital. It is determined by discipline, patience, timing, and the ability to recognize opportunities when others cannot see them.
Instead of blindly following public opinion, I decided to analyze the situation carefully. I spent time looking at the price action, market sentiment, and trading activity. Although the market looked weak, I noticed signs that selling pressure was beginning to slow down. The price had already fallen significantly, and I felt that risk was becoming more manageable compared to the potential reward.
After thinking carefully, I made my decision.
I used my entire $10 and bought ESPORTS through Gate.
The moment I entered the trade, I felt a mixture of excitement and uncertainty. Every trader knows this feeling. Once a position is opened, emotions immediately become involved. You begin checking the chart more often. Every small movement seems important. Every candle creates new thoughts.
The first few days were not easy.
The price continued to fluctuate. Sometimes it moved slightly higher, giving me confidence.
Other times it pulled back and tested my patience. There were moments when I questioned my decision. I wondered whether I should take a small profit and leave the market. I wondered whether the negative comments from other traders might actually be correct.
However, I reminded myself why I entered the trade in the first place.
I had done my own analysis.
I had accepted the risk.
And most importantly, I understood that successful trades require patience.
As the days passed, something started to change.
Buying activity gradually increased. The market began showing signs of life. The same traders who had been extremely negative started paying attention again. Trading volume improved, and the chart slowly became stronger. What once looked like a completely broken project was beginning to recover.
Each day brought new excitement.
I watched my position grow.
The small $10 investment slowly increased in value.
The feeling was difficult to describe because it was not just about money. It was about seeing my analysis play out exactly as I had expected. It was proof that independent thinking can be more valuable than following the crowd.
Then came the breakthrough.
Within approximately seven days, ESPORTS experienced strong price fluctuations and significant upward momentum. The token climbed toward $0.025, creating an incredible return from the levels where I had entered.
When I checked my position and saw that I had generated around $30 in profit, I felt an enormous sense of satisfaction.
For some traders, $30 may not seem like a huge amount. But for me, that profit represented much more than a number.
It represented confidence.
It represented patience.
It represented discipline.
Most importantly, it represented proof that opportunities still exist even during the darkest market conditions.
After carefully evaluating the situation, I decided to secure my gains and close the trade.
Watching the profit become realized was an amazing feeling. I knew that protecting profits is just as important as finding opportunities. Too many traders become greedy and allow winning trades to turn into losing ones. I did not want to make that mistake.
When I finally sold my position, I felt proud of the entire process.
I had entered when fear was high.
I had remained patient during uncertainty.
I had trusted my analysis.
And I had successfully achieved my target.
This trade taught me lessons that go far beyond ESPORTS itself.
It taught me that markets often reward patience.
It taught me that panic creates opportunities.
It taught me that discipline is more powerful than emotion.
And it taught me that even a small amount of capital can produce meaningful results when managed correctly.
My experience with Gate played a major role in this journey. The platform provided a smooth trading experience, reliable execution, and access to opportunities that allowed me to participate in the market with confidence. Every trade becomes part of a trader's story, and this ESPORTS trade has become one of the most memorable chapters of mine.
Today, whenever I look back at that trade, I remember more than the profit itself. I remember the emotions, the uncertainty, the patience, and the belief required to hold my position while others were losing confidence.
The crypto market constantly changes. Prices rise and fall. Narratives come and go.
Opportunities appear and disappear. But the lessons learned from a successful trade remain forever.
My ESPORTS journey on Gate proved that great opportunities can emerge from difficult situations. Sometimes the market rewards those who remain calm when everyone else is afraid.
That is why this trade will always be one of my favorite trading memories.
It started with only $10.
It started with a market full of fear.
It started with a decision to believe in my own analysis.
And seven days later, it became a story of patience, confidence, and success that I will never forget.
Thank you, Gate, for being part of my trading journey and helping create a trading experience that turned a small investment into a memorable achievement.
#MyGateTradeStory #MyGateTradingMoment @Gate_Square
repost-content-media
ESPORTS-2.22%
BTC-0.92%