Square
Following
Hot
News
Notifications
Profile

CanDx

vip
No content yet
Live TradingMarket AnalystWeb3 CreatorOn-chain Analyst
36
Following
10k
Followers
14k
Liked
Pin
$PI sitting around $0.09716, up 0.39%. Buyers are holding the area, but the next move needs stronger momentum for confirmation.
PI-0.60%
  • 12
  • 2
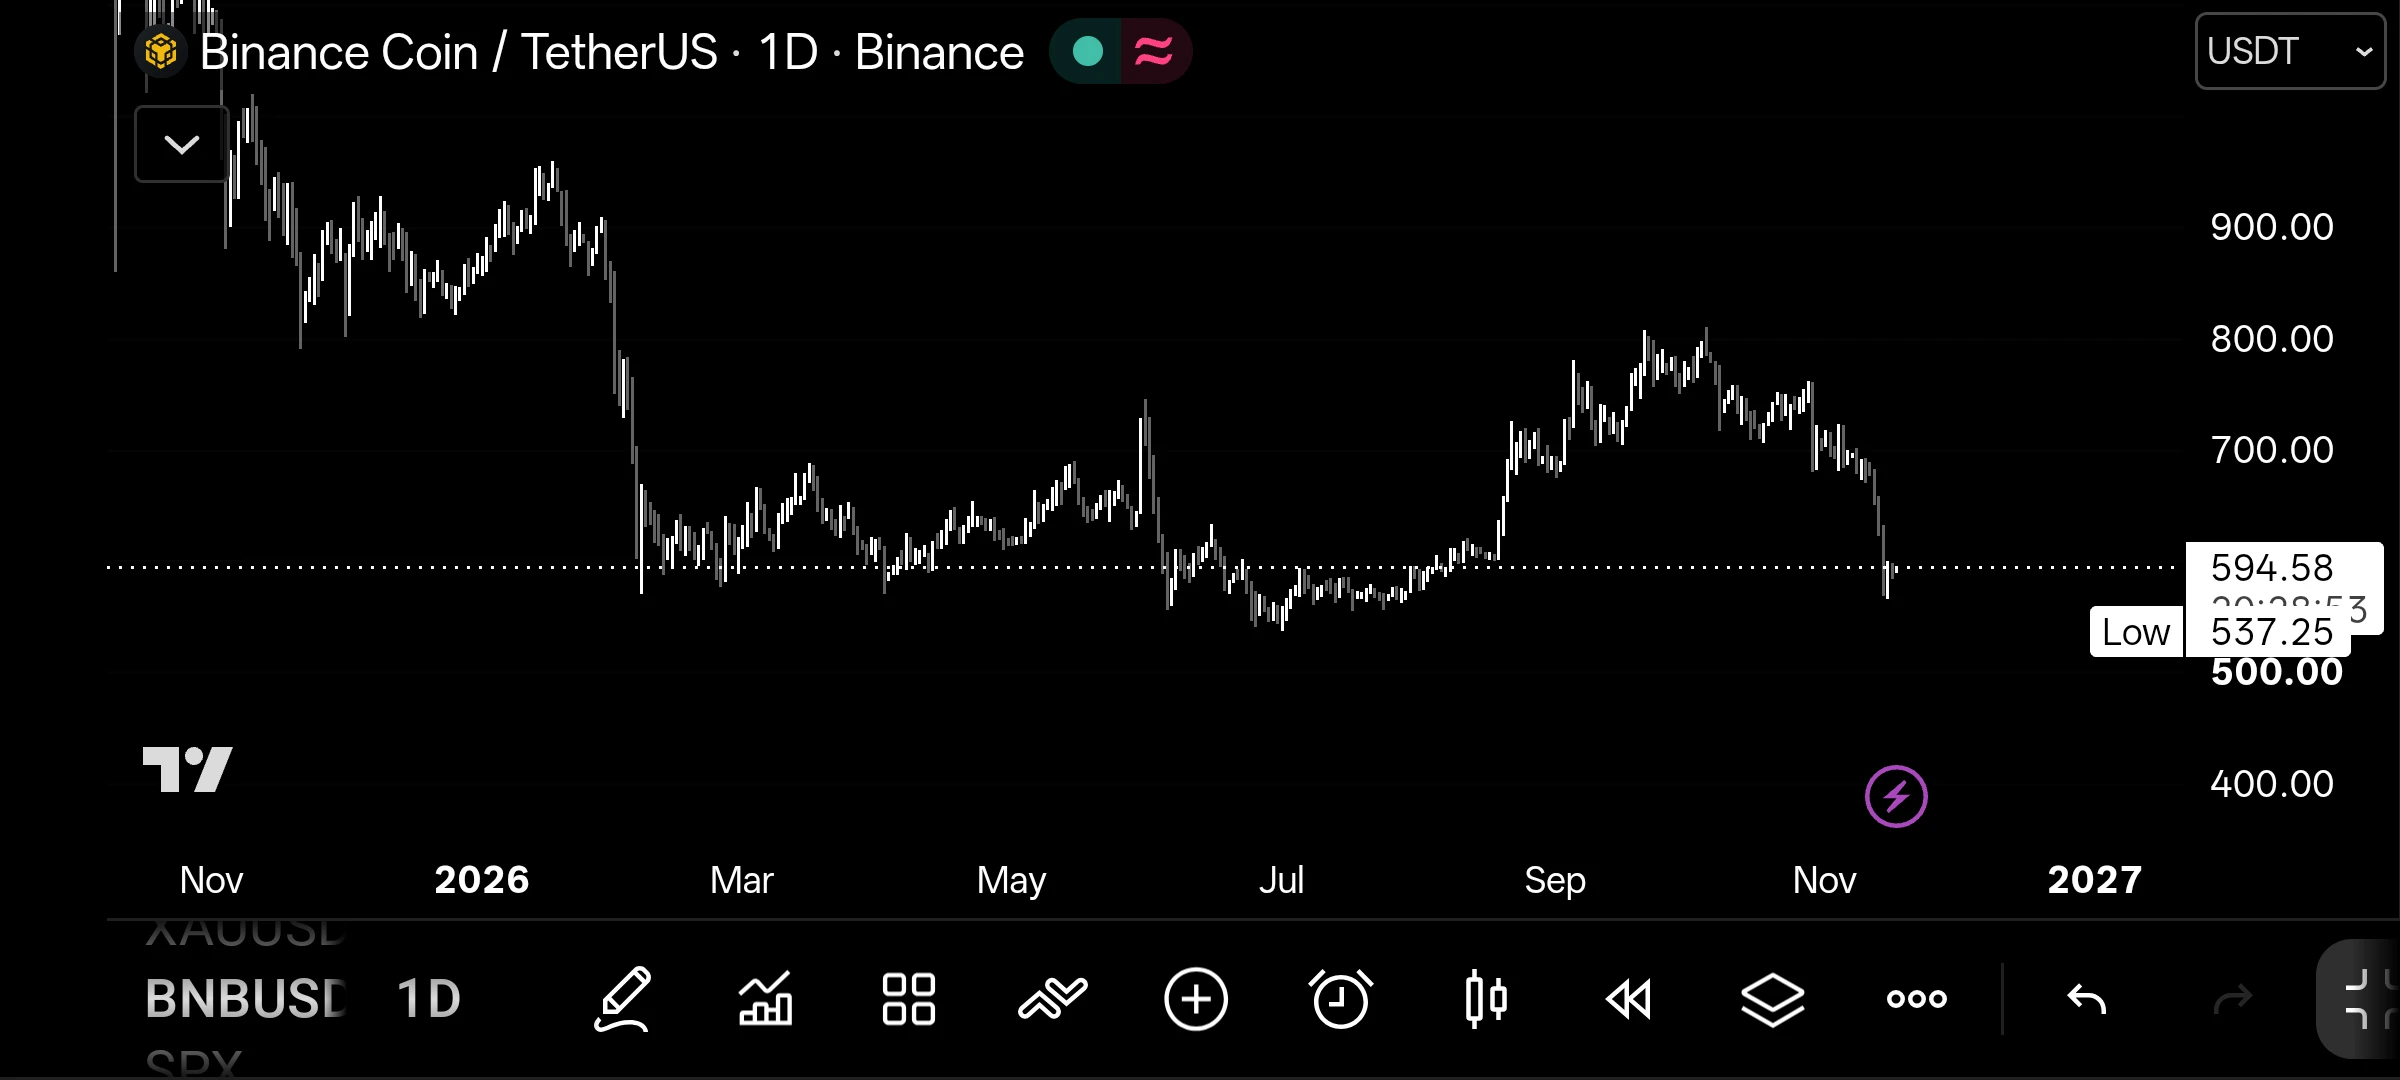
$BNB is back near $595 after a sharp drop. The level I’m watching is $600. BNB spent weeks trading around that price earlier this year, and now buyers are trying to get back above it.

What catches my eye on the daily chart is how each bounce has fallen short of the last one since BNB traded near $800. A daily close above $600 would give me more confidence, especially if buyers step in around that level on the next dip. If it holds, I’ll be watching $650, where several rallies stalled earlier this year.

There’s also room for buyers to show up below $595. I’d like to see them step in well befo
post-image
BNB-0.76%
  • 1
$SOPH touched $0.00261 and pulled back to $0.00206. The long upper wicks on the 4H chart show buyers have struggled to hold gains above $0.00250.

I’m watching $0.00220 now. A 4H close back above it would put $0.00250–$0.00261 back in focus. If $0.00200 gives way, I’ll be watching for buyers near $0.00170.

#SOPH #Sophon #Altcoins #GateIPOAccessAnthropic #Dr.HanOxfordUnionSpeech
SOPH-3.83%
  • 2
  • 1
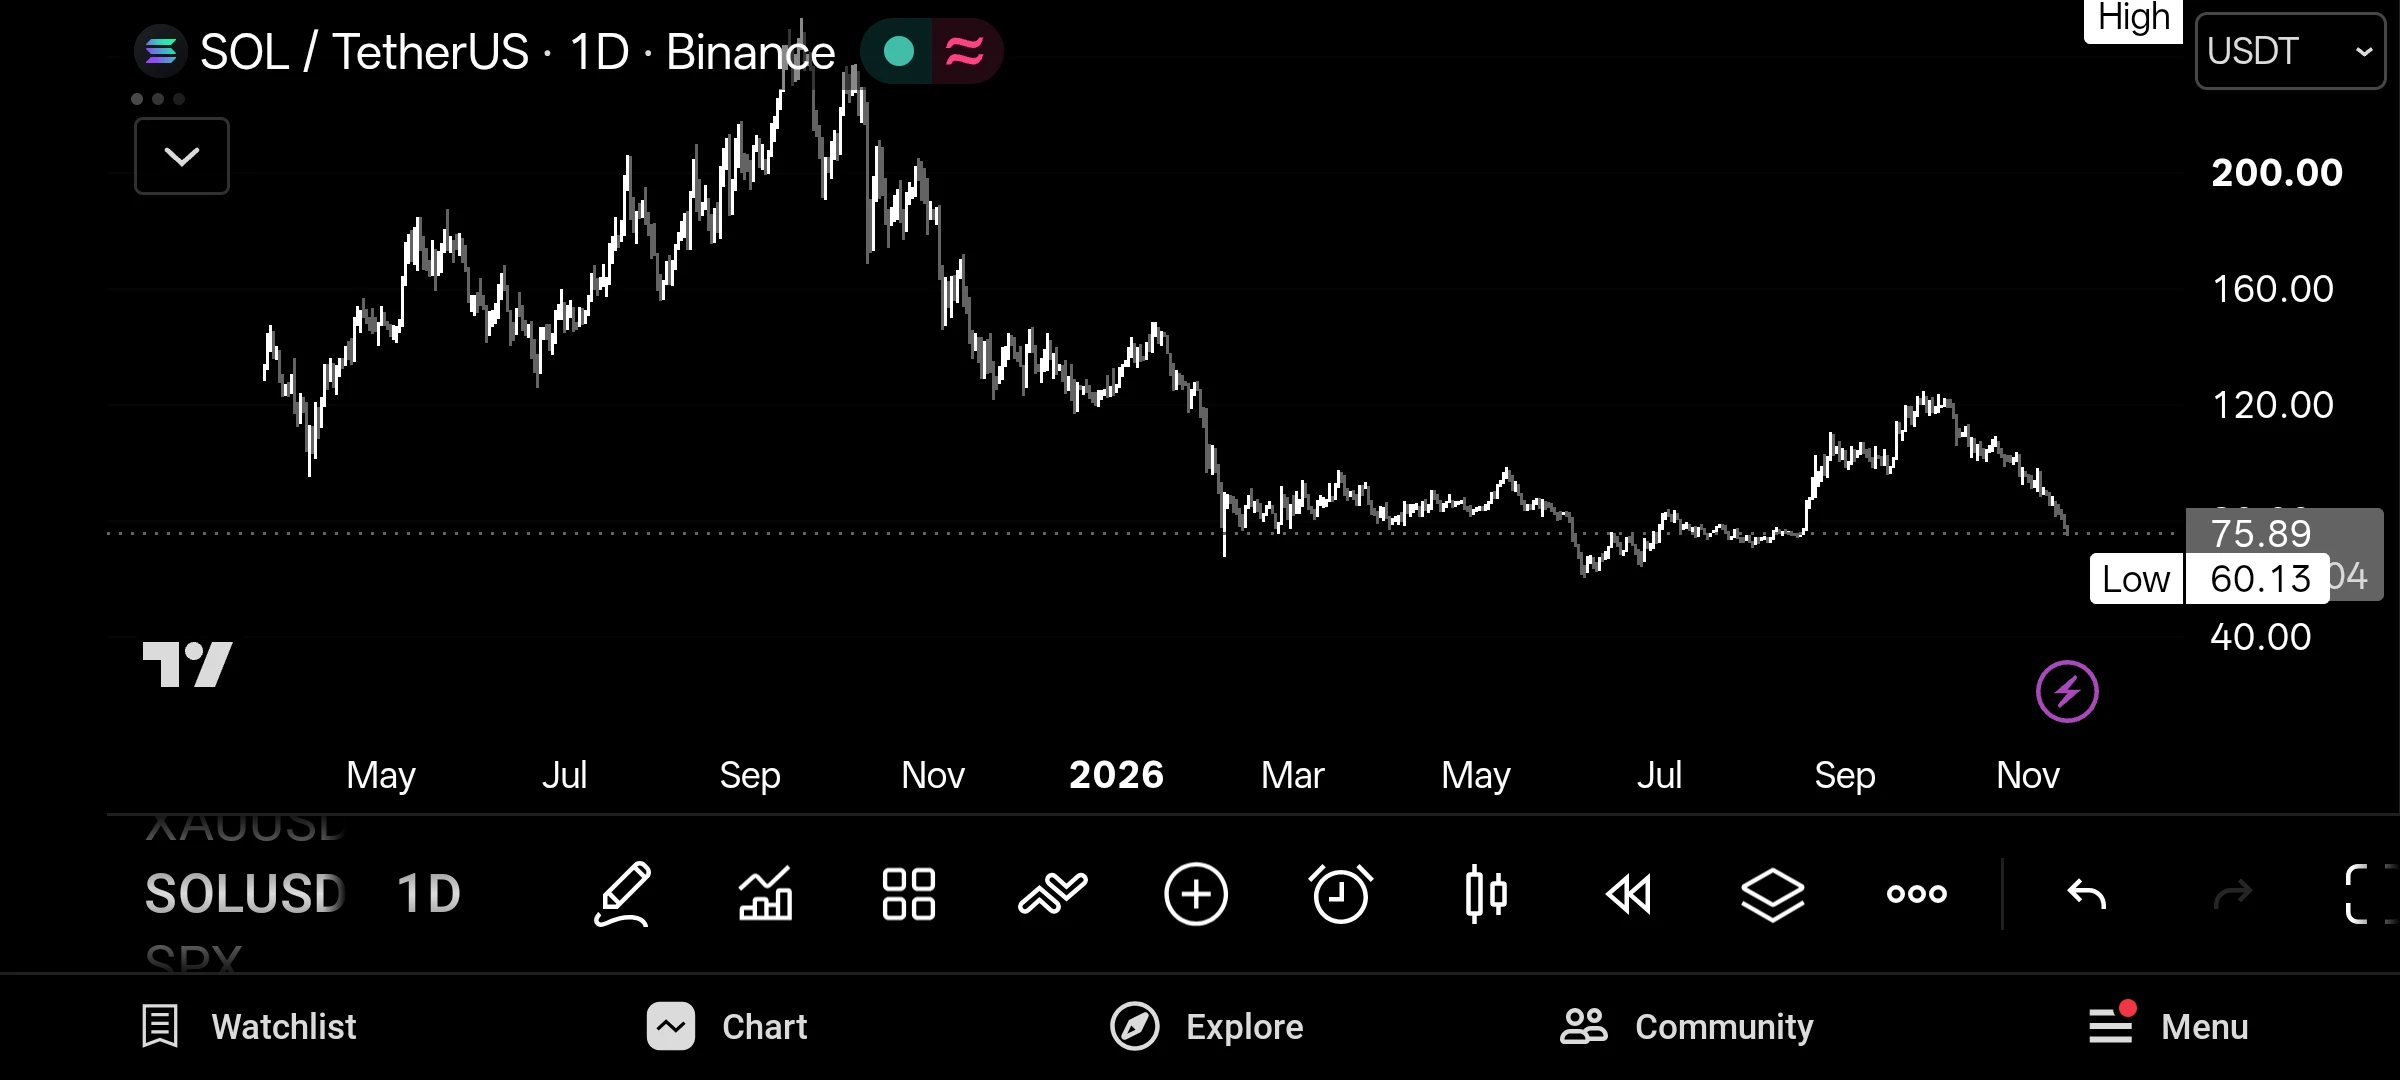
$SOL is back near $76 after giving up most of its rally to $120. I’m watching $75 because Solana spent weeks around that level before its late-August breakout.

A daily close back above $80 would be my first sign that buyers are stepping in. If $75 gives way, I’ll be watching $70 first, then the June low near $60.

#Solana #SOL #Altcoins #GateIPOAccessAnthropic #Dr.HanOxfordUnionSpeech
post-image
SOL-0.77%
  • 1
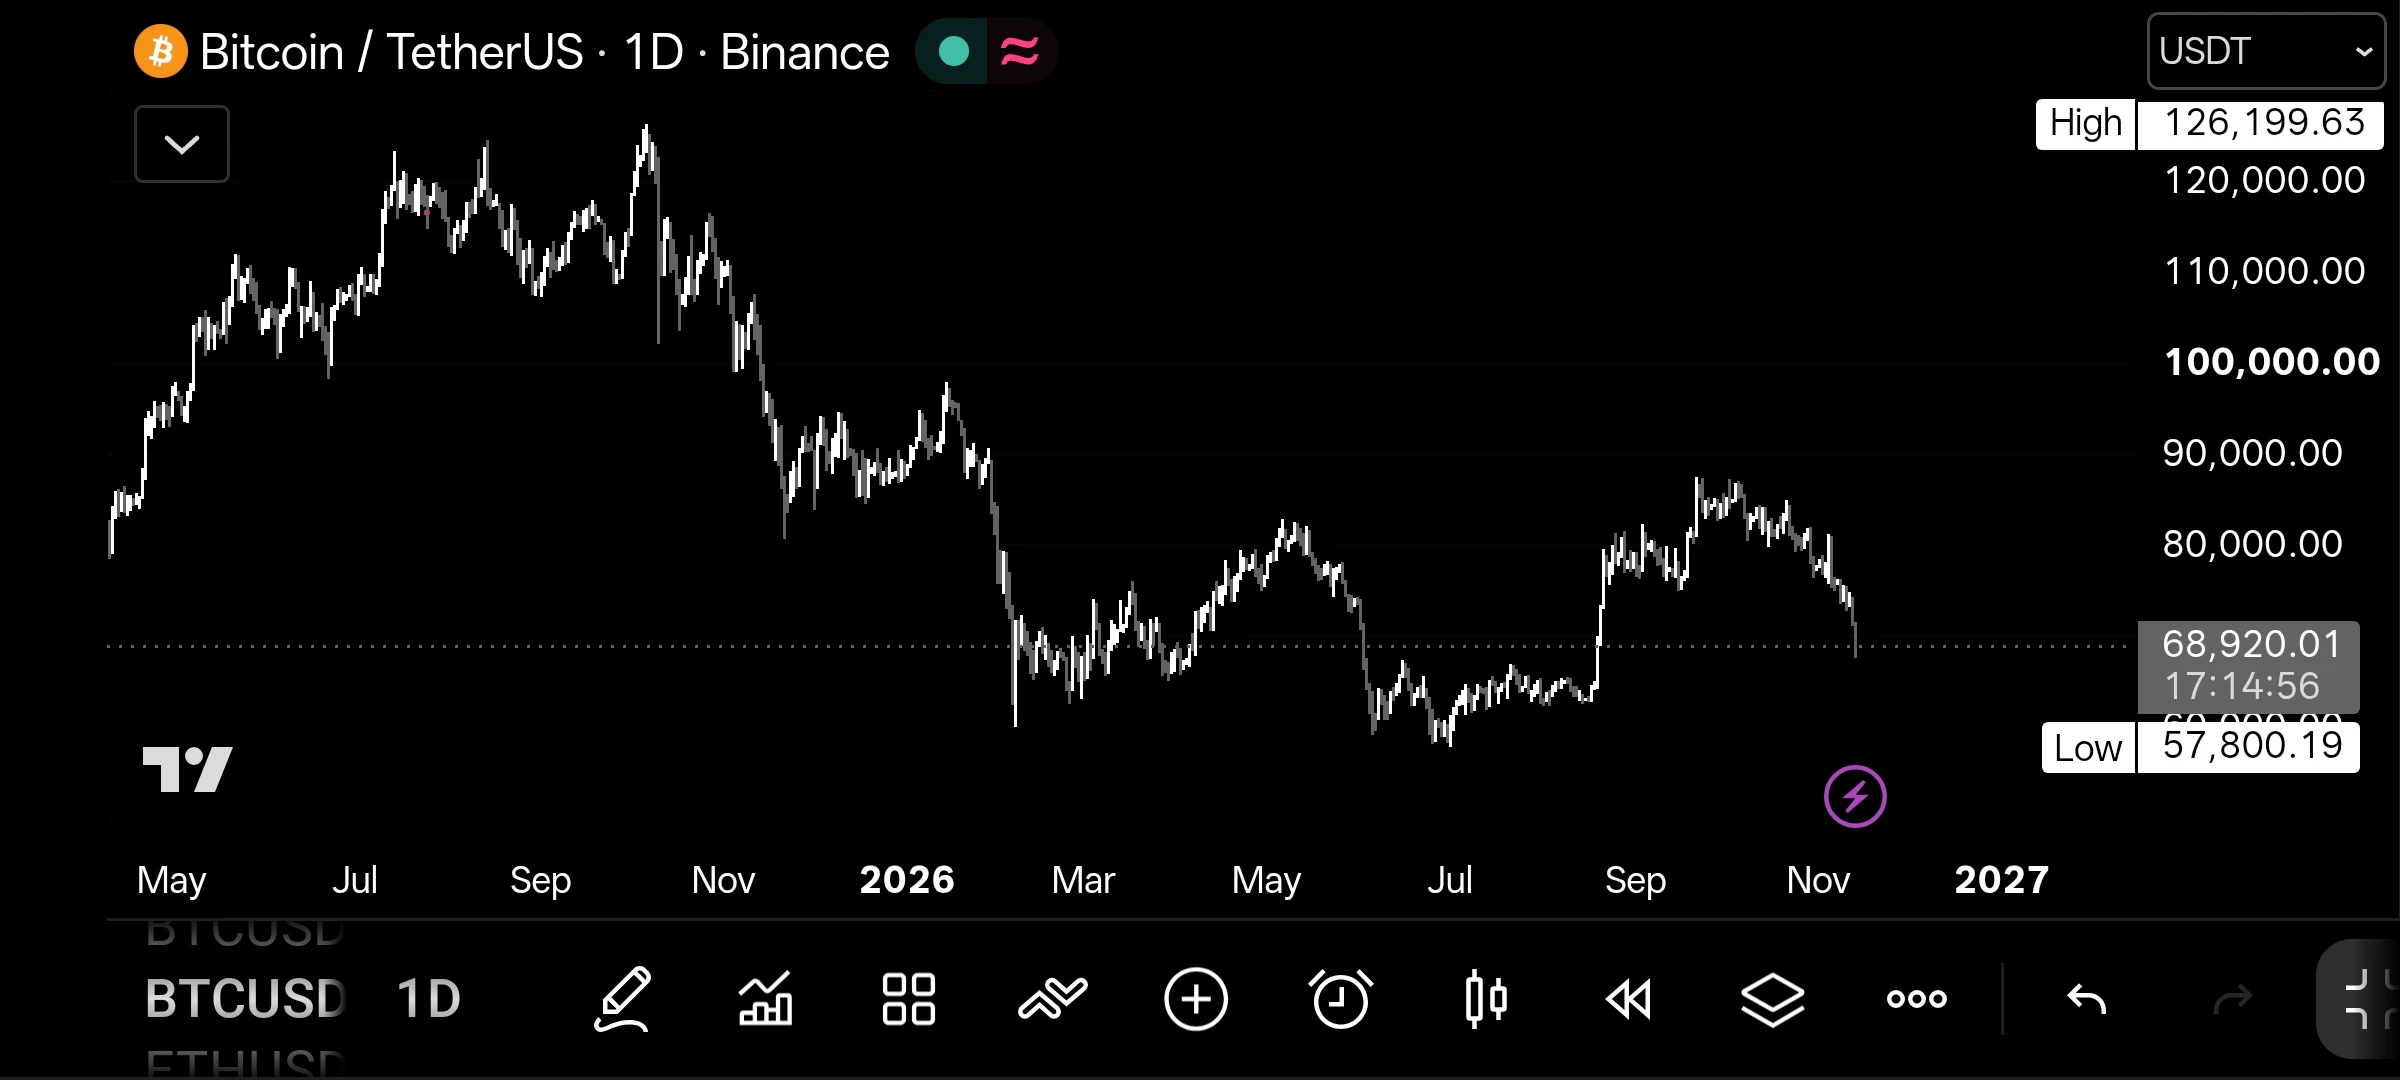
Can $BTC take back $70K? Bitcoin has pulled back from around $87K to $68.9K on the daily chart. I’m watching where this candle closes.

A close above $70K would be an early sign that buyers are stepping back in. If Bitcoin can hold that level on a retest, $75K is the next area I’m watching. If the selling continues, I’ll be looking for a reaction around $65K, where buyers stepped in earlier this year.

Which matters more to you here, the daily close or the retest?

#Bitcoin #BTC #BitcoinAnalysis #JensenHuangResigns #GateIPOAccessAnthropic
post-image
BTC-0.67%
  • 1
  • 1
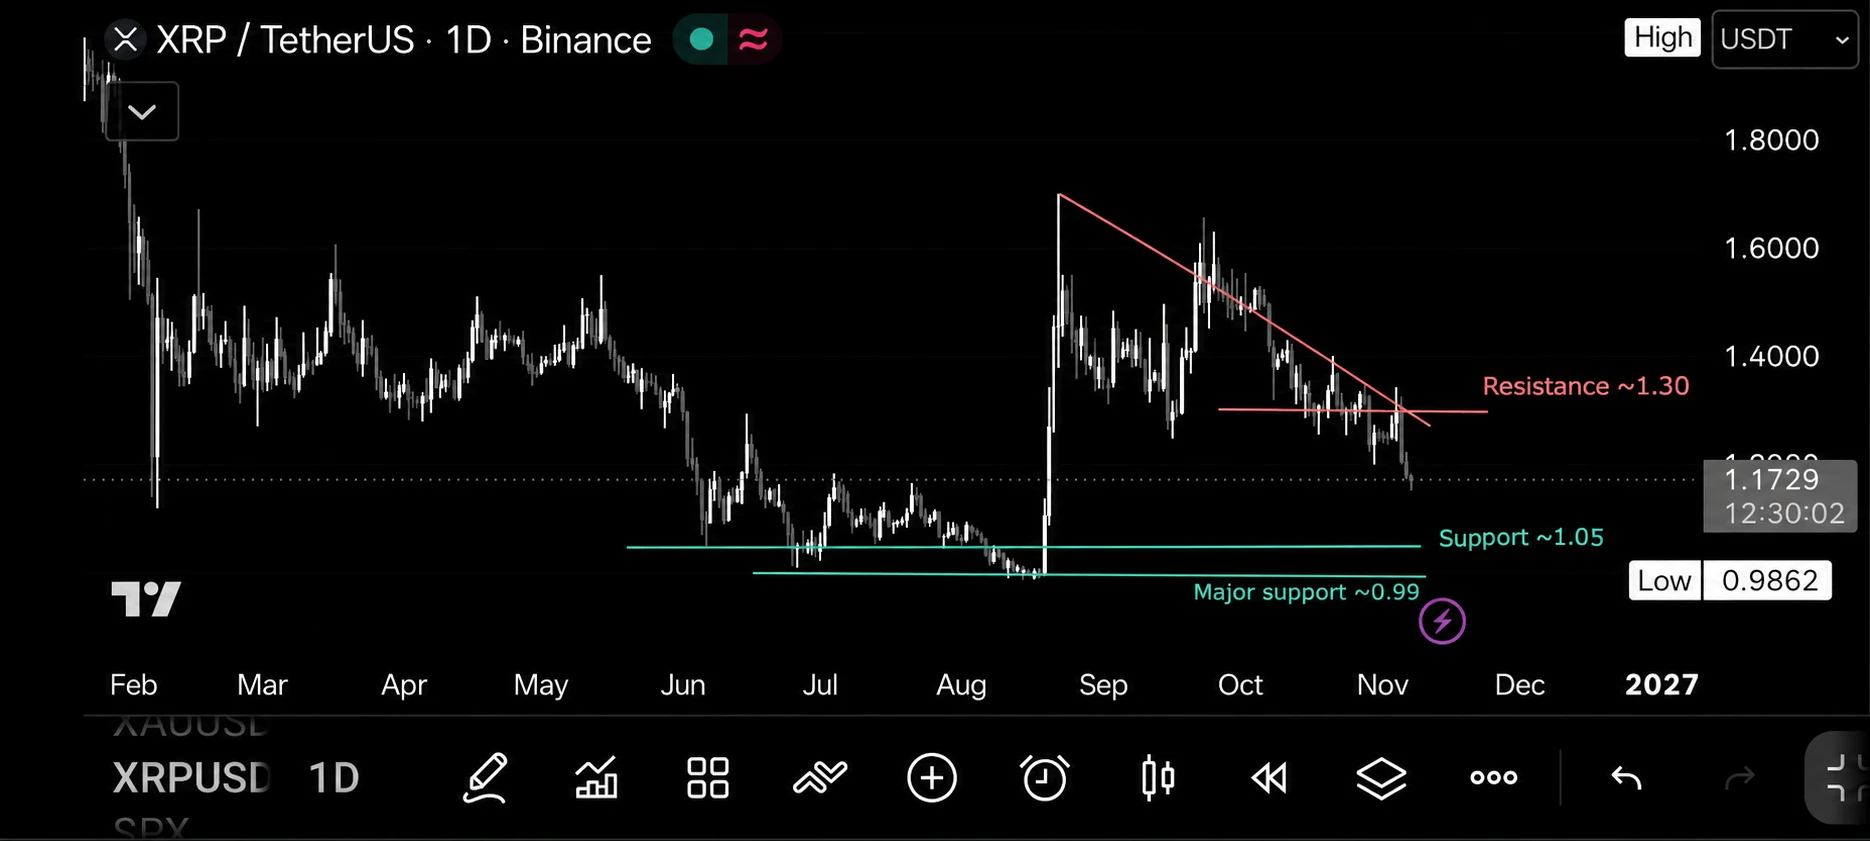
$XRP needs buyers to step in.

On this daily chart, price is near $1.17 and remains under a descending trendline. I’m watching $1.30 as the key resistance, with support around $1.05 and $0.99.

My view: I’d wait for a confirmed breakout and a steady retest before calling a recovery. Until then, lower highs keep me cautious.

#XRP #Ripple #Crypto #USAIStocksHitHard #USNonfarmPayrolls
post-image
XRP-1.15%
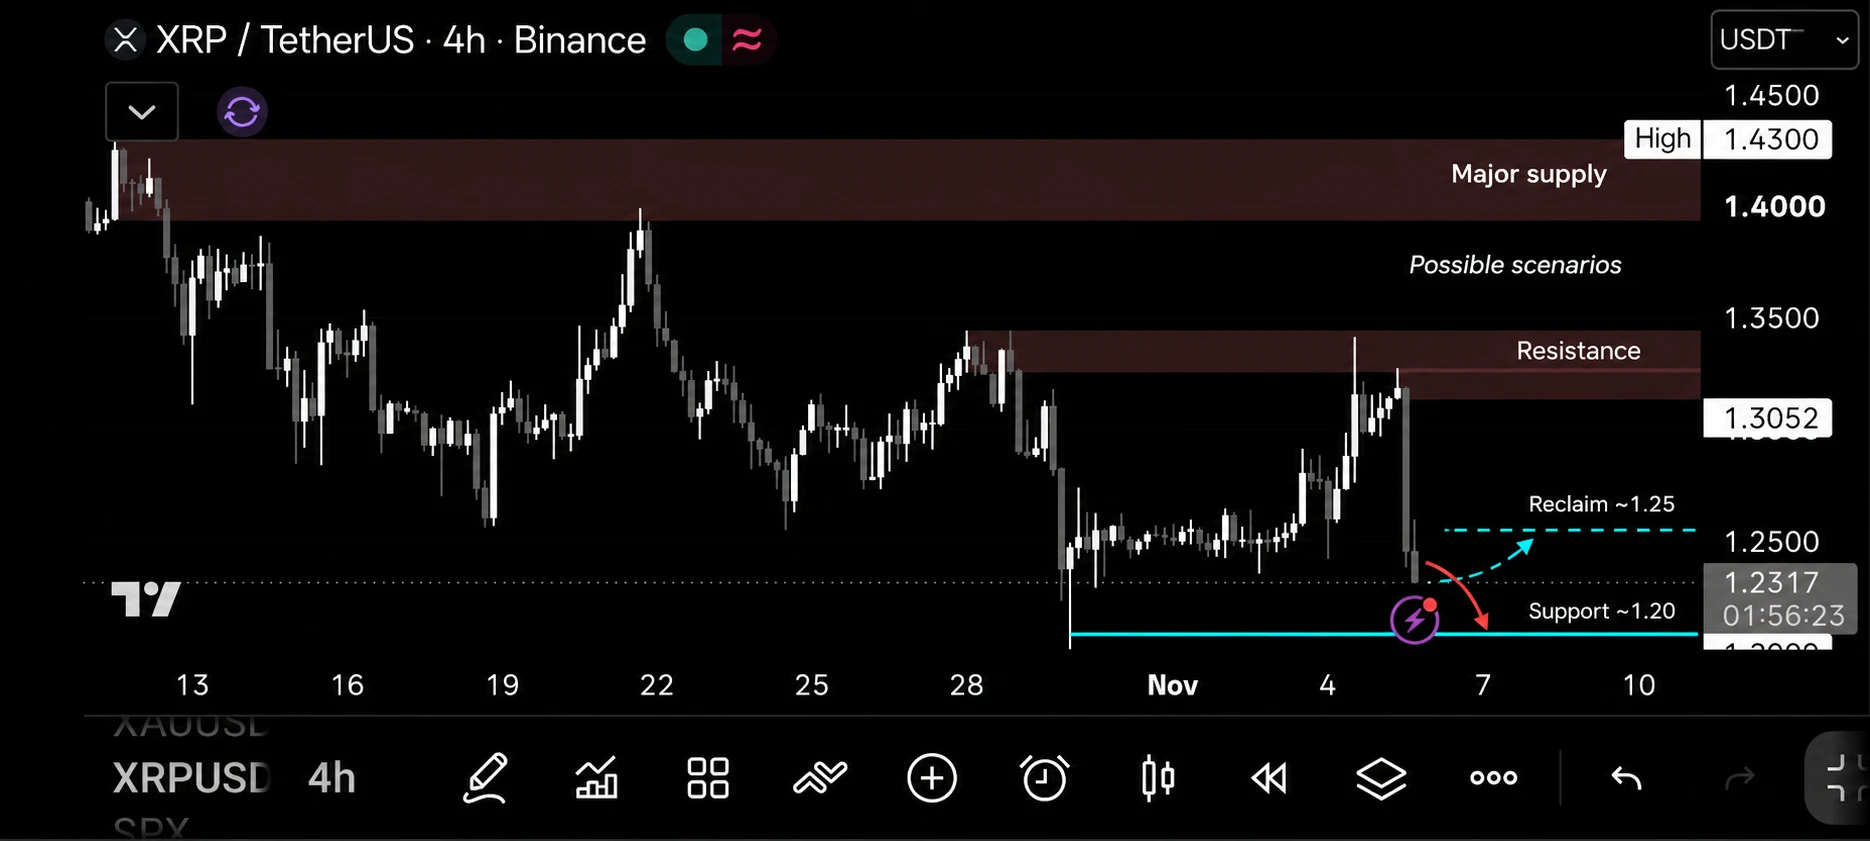
I’m watching $XRP after its sharp drop toward $1.23 on this 4H chart.

Support is near $1.20. Holding this level and moving back above $1.25 could help buyers recover. The next resistance area is $1.31 to $1.34.

Losing $1.20 would weaken the setup. For now, I’m waiting to see how price reacts near support.

#XRP #Crypto #GateLaunchesPoSECProofOfSecurity #BTCBackAbove80K
post-image
XRP-1.15%
  • 6
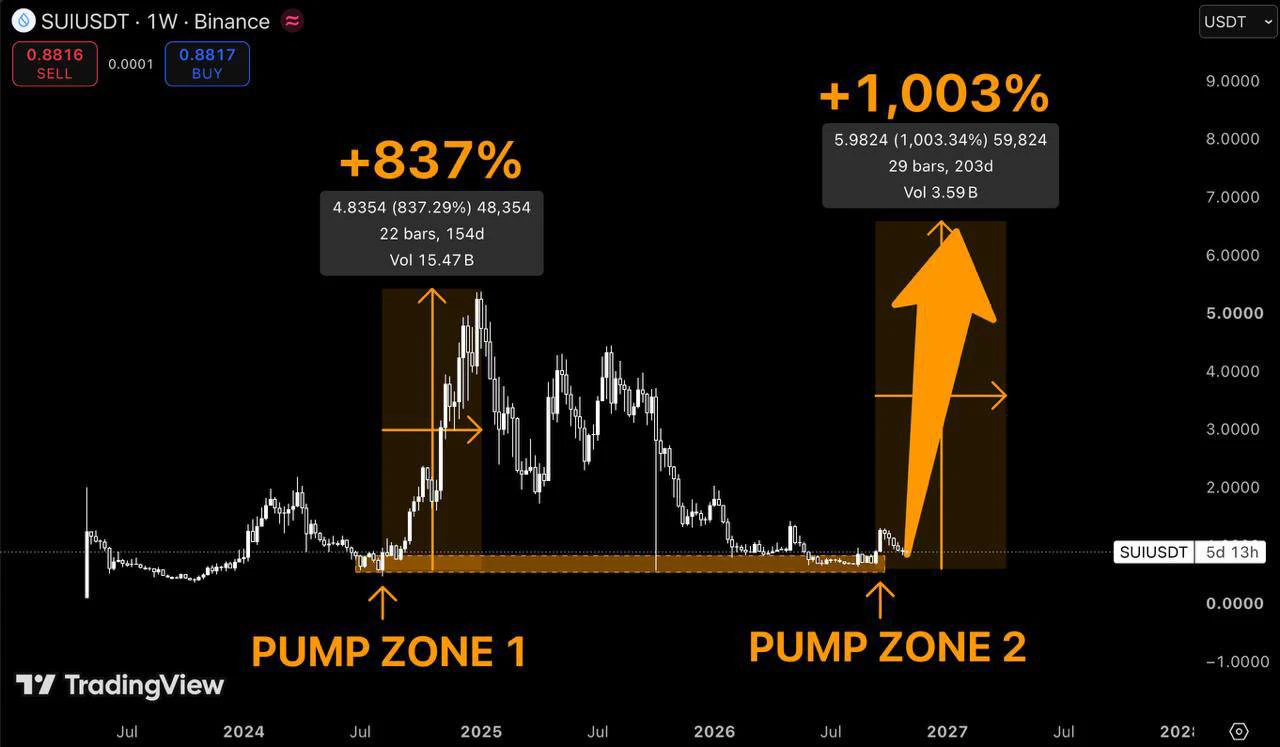
$SUI at $0.88 feels like déjà vu.

Last time it sat in this zone

it went on an 837% run.

Now we're back at almost the exact same levels

and suddenly nobody wants to talk about it. 💀

The chart is showing a second potential accumulation zone.

And if history rhymes, $6–7 becomes my aggressive bull-case target.

Another 1,000% rally? Sounds ridiculous.

But so did the first one before it happened.

I'm watching this one closely. 👀

#USMidtermsVoteToday #GateRanksTop2AcrossMultipleCategories #USEarningsSeason
post-image
SUI-1.05%
  • 5
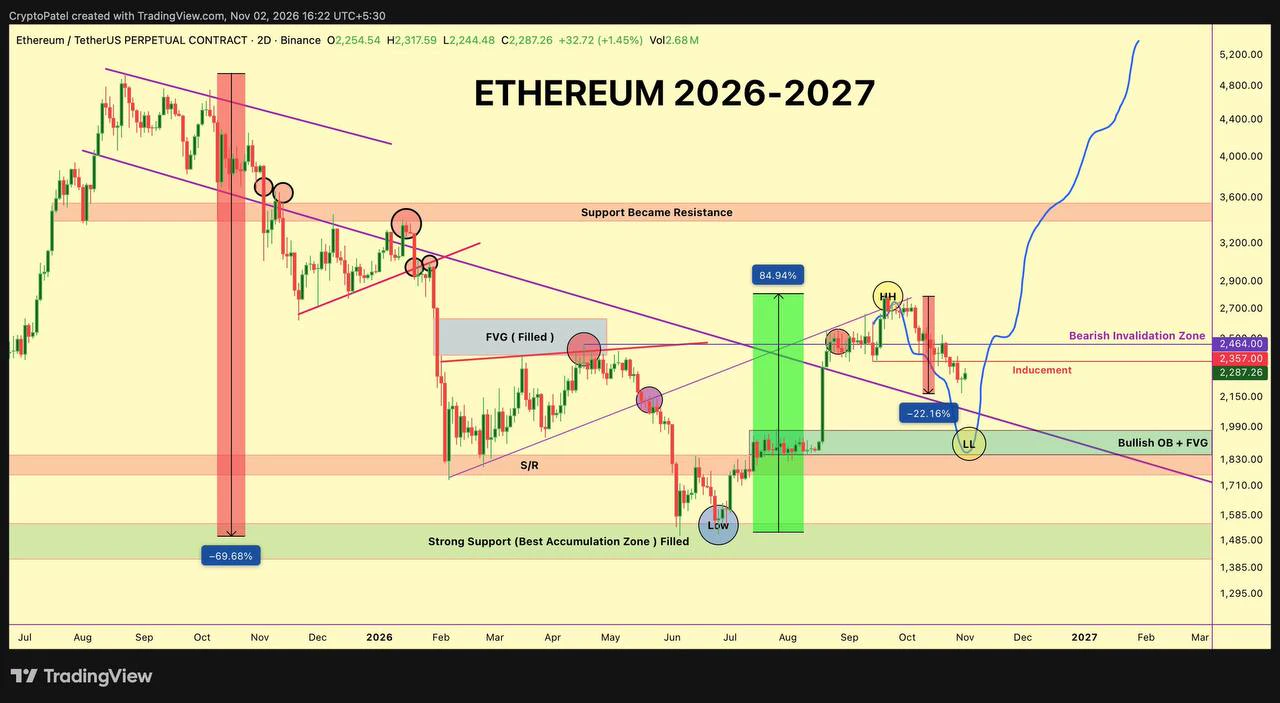
$ETH could face another dip before a stronger recovery.

On this chart, I’m watching $1,830–$1,990 as support. Reclaiming $2,464 would weaken the bearish setup and put $2,700 back in focus.

The projected rally is a possibility, not confirmation.

#ETH #Ethereum #Crypto #USMidtermsEnterFinalStretch #GateSOLStakingHitsNewHigh
post-image
ETH-1.26%
  • 4
  • 2
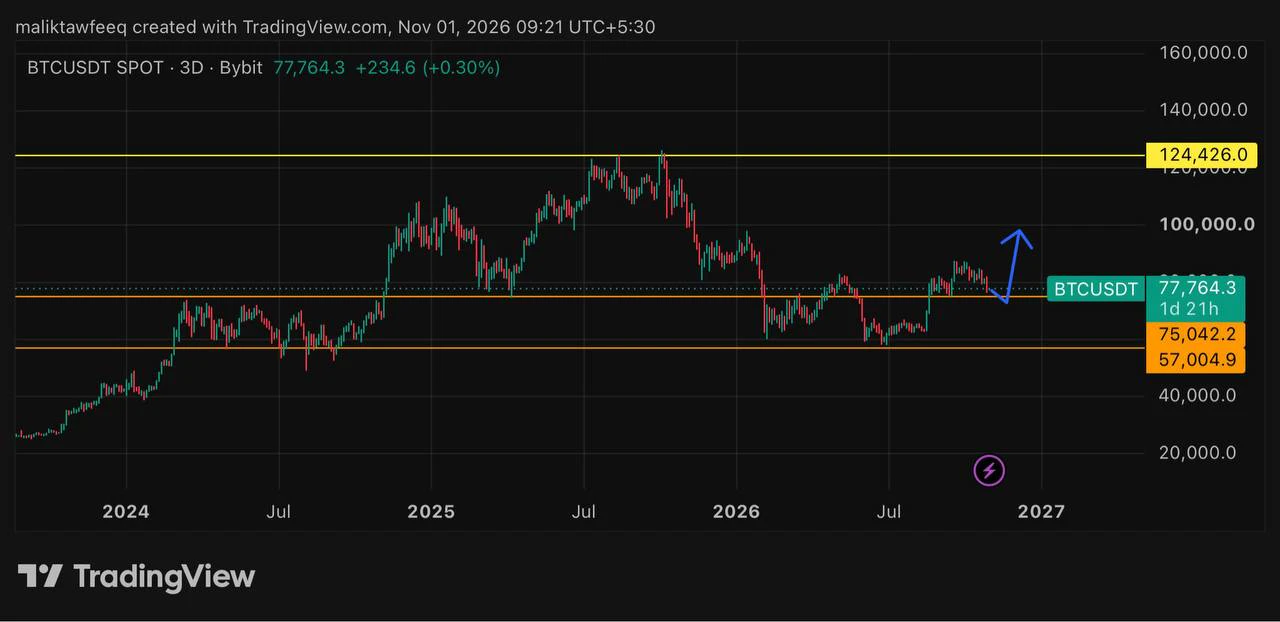
$BTC UPDATE

Bitcoin is testing support around $75,000, and the reaction here could shape its next move.

If buyers defend this level, a bounce could follow. Losing it would weaken the setup and leave room for further downside.

Waiting for confirmation before getting too confident.

#BTC #Bitcoin #Crypto #BTC大跌 #IntelBeatsEarningsButStockPlunges
post-image
BTC-0.67%
  • 8
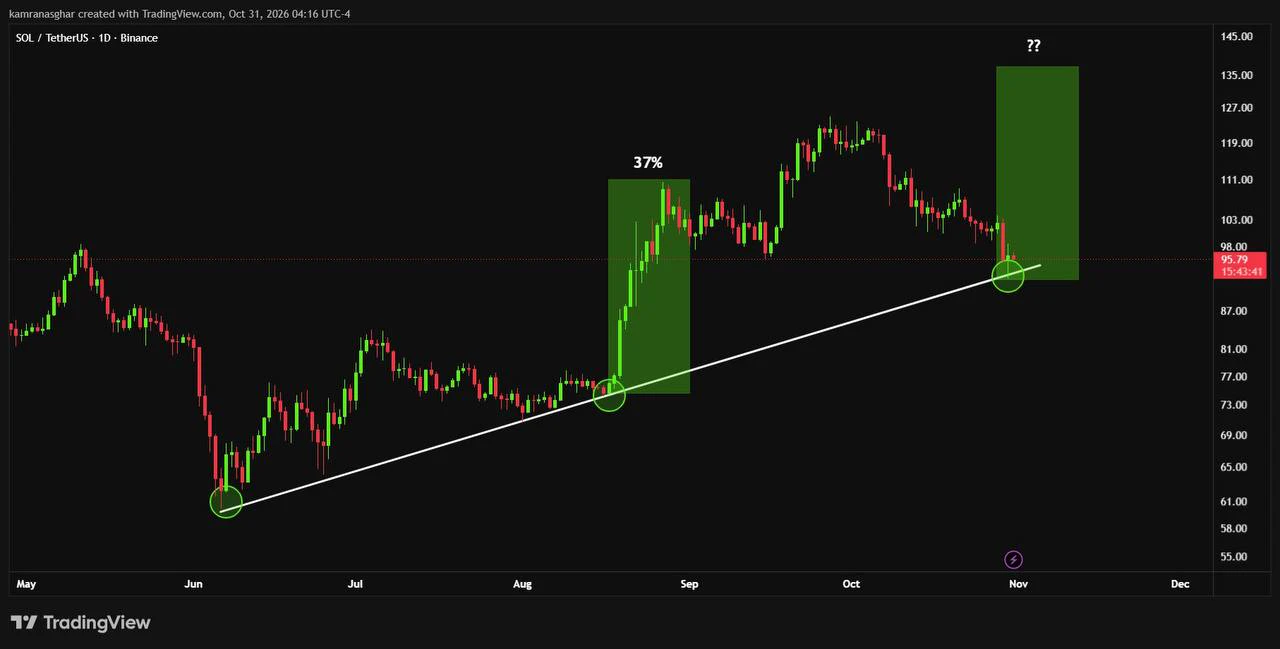
$SOL is testing rising support near $92 to $95 on this chart.

Holding here and reclaiming $103 could open room toward $111 and $120. A break below the trendline would weaken the setup.

Will buyers step in again?

#SOL #Solana #BTC大跌 #IntelBeatsEarningsButStockPlunges #StrategySTRCNears100ParValue
post-image
SOL-0.77%
  • 9
  • 2
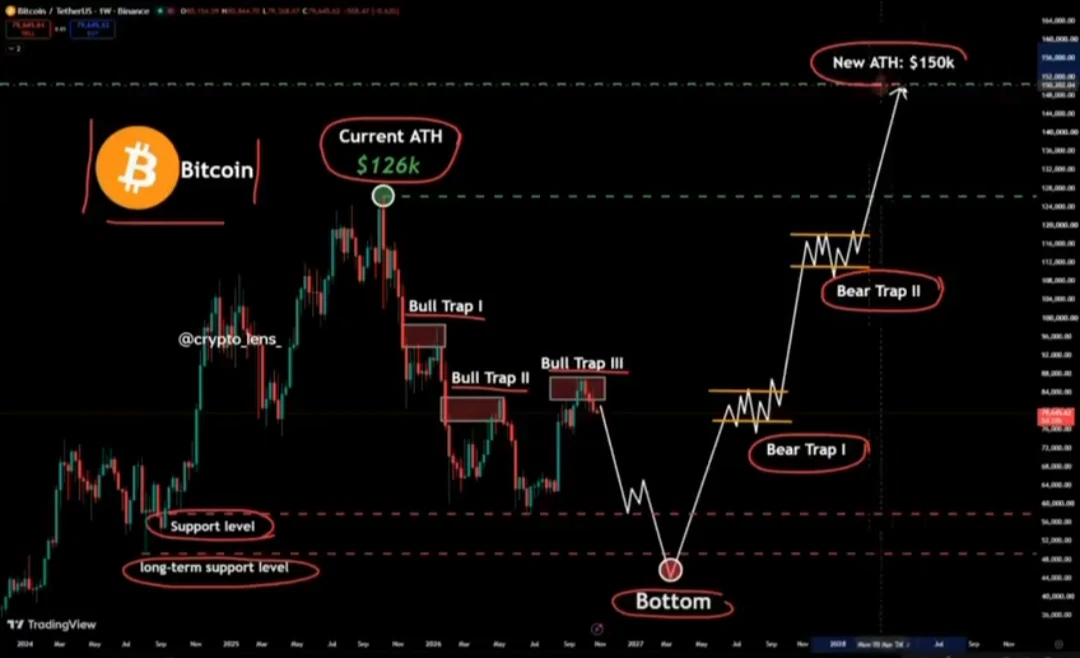
$BTC ’s rejection near $85K puts downside risk back in focus.

If $80K breaks, I’m watching $75K and $67K. A deeper correction could bring $53K–$49K into view.

These are potential scenarios, not confirmed targets. A sustained recovery above $85K would weaken the bearish outlook.

#btc #GateFirstToLaunchGoldCFD7x23Trading #KeyMacroWeekAhead #BTCBattlesFor80000
post-image
BTC-0.67%
  • 3
  • 2
GM! My opening move this week is patience.

With $BTC around $80K, I’m watching for a clear direction, stronger volume, and how price reacts to macro news.

My plan: keep some cash available, avoid chasing pumps, and only consider entries after confirmation. If the setup stays unclear, I’m comfortable waiting.

What’s your first move this week?

#WCTCS9
post-image
BTC-0.67%
  • 8
  • 2
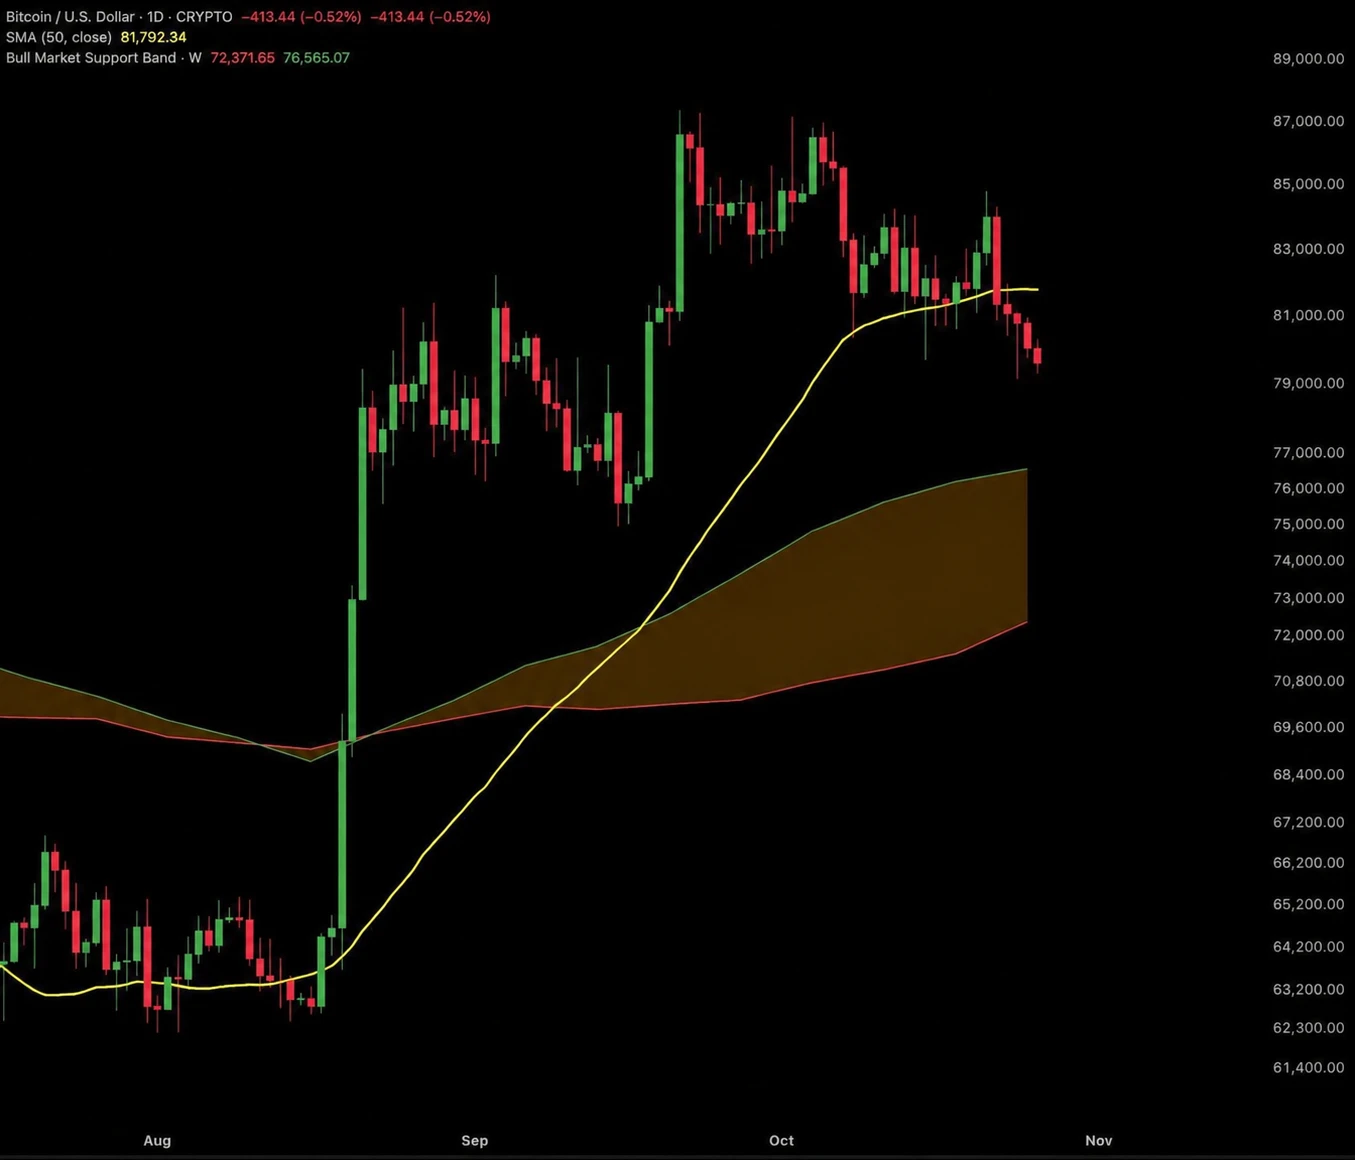
$BTC is losing momentum on the daily chart, slipping below the 50-day SMA near $81,792.

I’m watching $79K closely. A break below could bring the weekly bull market support band around $72.4K–$76.6K into focus, starting with its upper edge.

For buyers, reclaiming $81.8K would be the first sign of improving strength. Until then, the chart calls for patience.

#BTC #Bitcoin #CryptoAnalysis #USEarningsSeason #GateWCTCS9GlobalTradingCompetition
post-image
BTC-0.67%
  • 6
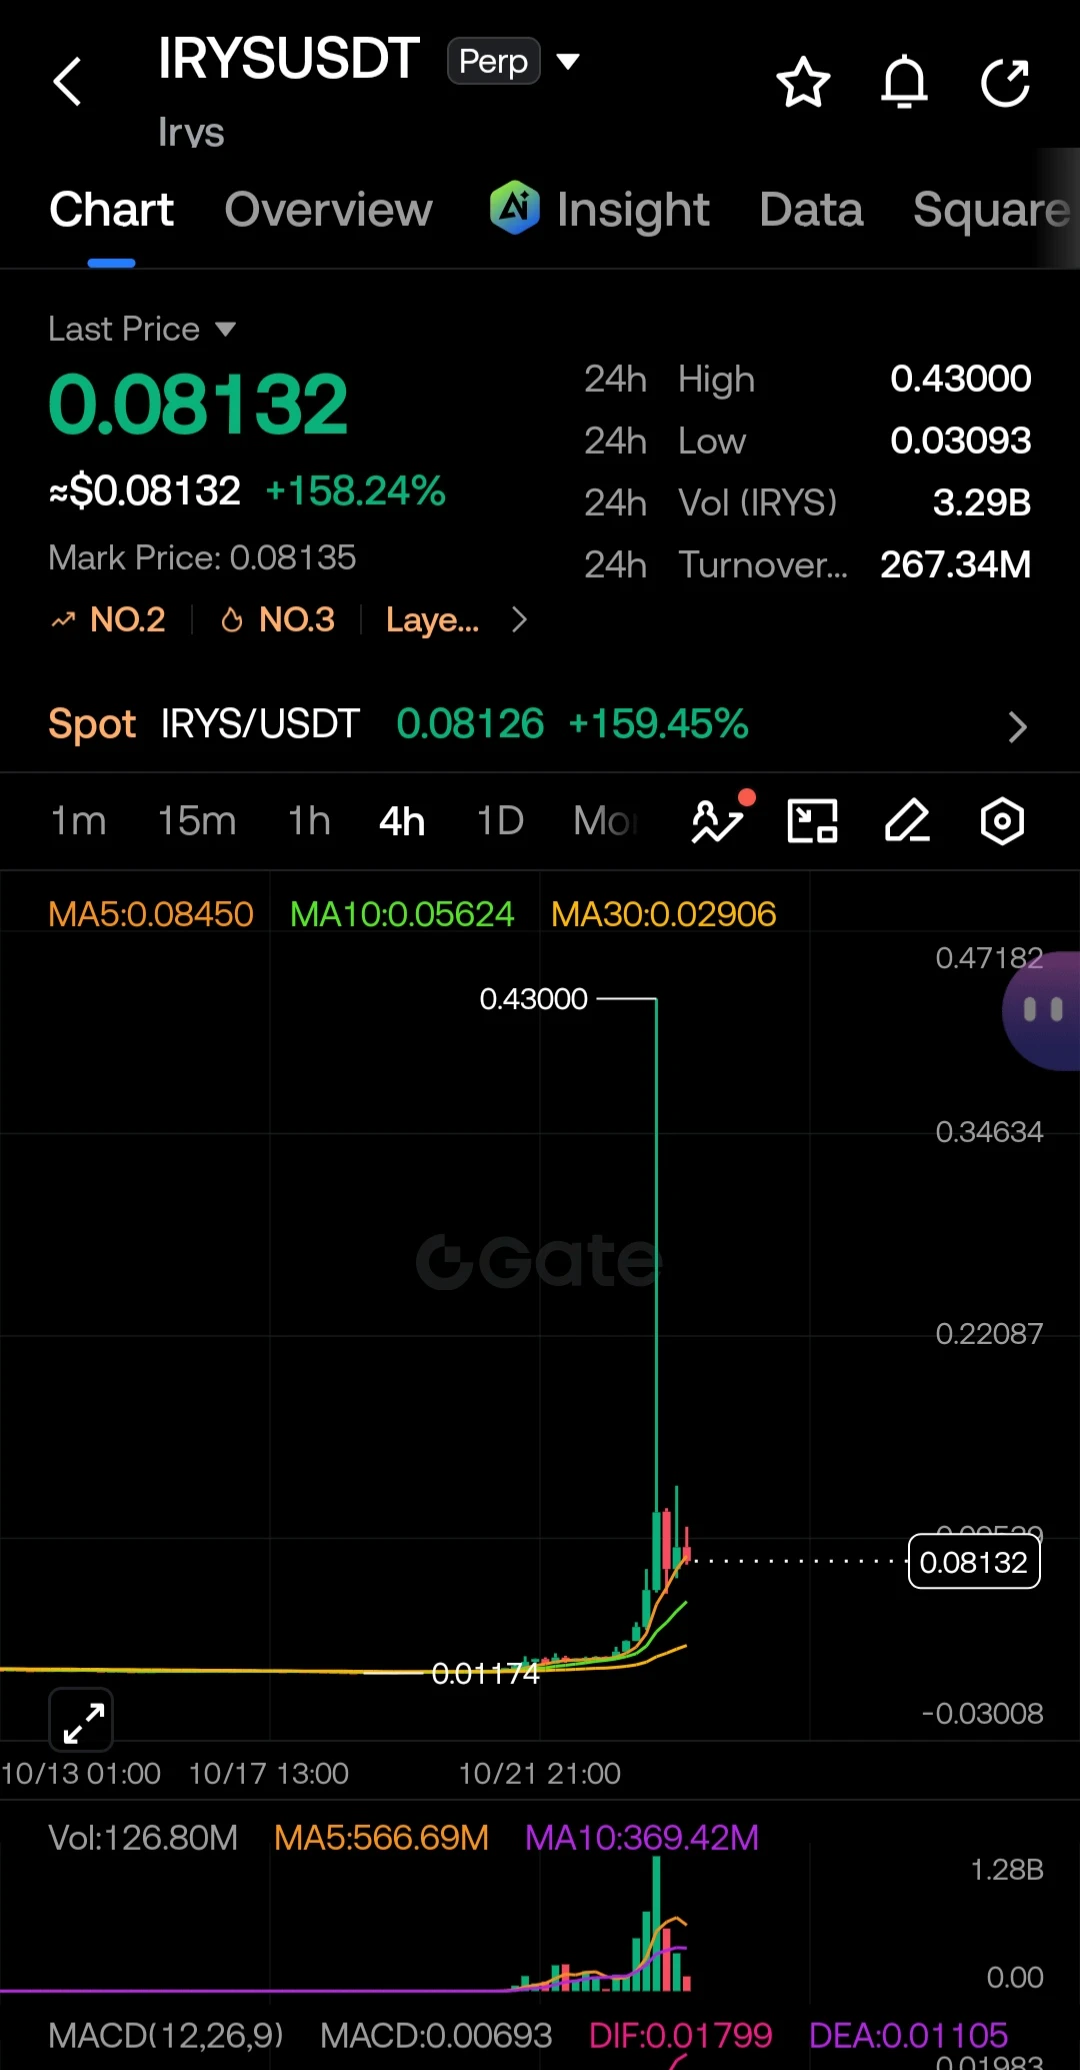
$IRYS shows +158% at $0.08132 on this 4H chart, but the huge rejection from $0.43 signals extreme volatility.

I’m watching a reclaim of $0.0845 for a possible move toward $0.095–$0.10. The next MA support reference sits near $0.0562.

Waiting for a stable base before chasing.

#IRYS #Gate #CryptoAnalysis #USEarningsSeason #GateWCTCS9GlobalTradingCompetition
post-image
IRYS-22.27%
  • 3
$SUI at $1.0098, down 3.12%. SUI is weaker than BTC, ETH and SOL in this snapshot. I’m watching for that relative performance to improve before expecting a stronger recovery.

#USSeptemberPPIBeatsExpectations #GateBTCAndETHFuturesVolumeRanksTop3
SUI-1.05%
  • 5
  • 2
$Q at $0.070563, up 30.74%. One of the strongest movers in these screenshots. The gain is impressive, but how much of it survives a pullback will tell us more.

#USSeptemberPPIBeatsExpectations #GateWCTCS9GlobalTradingCompetition
Q-28.72%
  • 5
  • 1
$INJ at $8.905, down 3.91%. Injective is showing a sharper decline than many major alts listed. Buyers need to demonstrate sustained demand before the recovery story becomes convincing.
INJ-1.67%
  • 5
$KORU contract at $10.691, down 10.37%. A double-digit decline signals a substantial move in the displayed instrument. Stabilization would be more informative than assuming an immediate rebound.
KORU-1.22%
  • 5
  • 2
$ADA at $0.2238, down 2.95%. Cardano is underperforming BTC and ETH in this snapshot. I’m watching whether buyers can reduce that weakness before calling the dip a recovery opportunity.
ADA-1.48%
  • 3
  • 2
$BTC USD pair shows $81,620, down 0.70%. Like the USDT listing, it reflects a relatively modest decline. Neither snapshot provides enough evidence to call a breakout or breakdown.
BTC-0.67%
  • 3
Load More