Square
Following
Hot
News
Profile
Share your thoughts
placeholder
Article
That same moment when you come to crypto for financial freedom and decentralization, but end up sitting at 12:30 UTC, holding your breath as you wait for U.S. officials’ report on producer inflation.
All the magic of blockchain temporarily takes a back seat when U.S. macro data takes center stage. Bitcoin’s chart now looks like a compressed spring. Trading volumes have locally declined, as nobody wants to risk big capital right before the PPI release. While big players wait it out, retail traders are spinning conspiracy theories. I decided to play it safe: moved some of my assets into stableco
BTC-0.56%
  • 1
I’ll buy when it gets to $20
post-image
Trenches
AGT
A
bade
b
AGT
0x5d...e274
Market Cap
$.
Change
.
24h Vol
$.
Holders
.
CNPY
C
bade
b
CNPY
0xc6...ddd2
Market Cap
$.
Change
.
24h Vol
$.
Holders
.
FOLIO
F
bade
b
FOLIO
0x5f...e411
Market Cap
$.
Change
.
24h Vol
$.
Holders
.
Q
Q
bade
b
Q
0xc0...0589
Market Cap
$.
Change
.
24h Vol
$.
Holders
.
Gato
G
bade
b
Gato
55A3...pump
Market Cap
$.
Change
.
24h Vol
$.
Holders
.
Bitcoin market caps correlation
live-cover
LIVE46
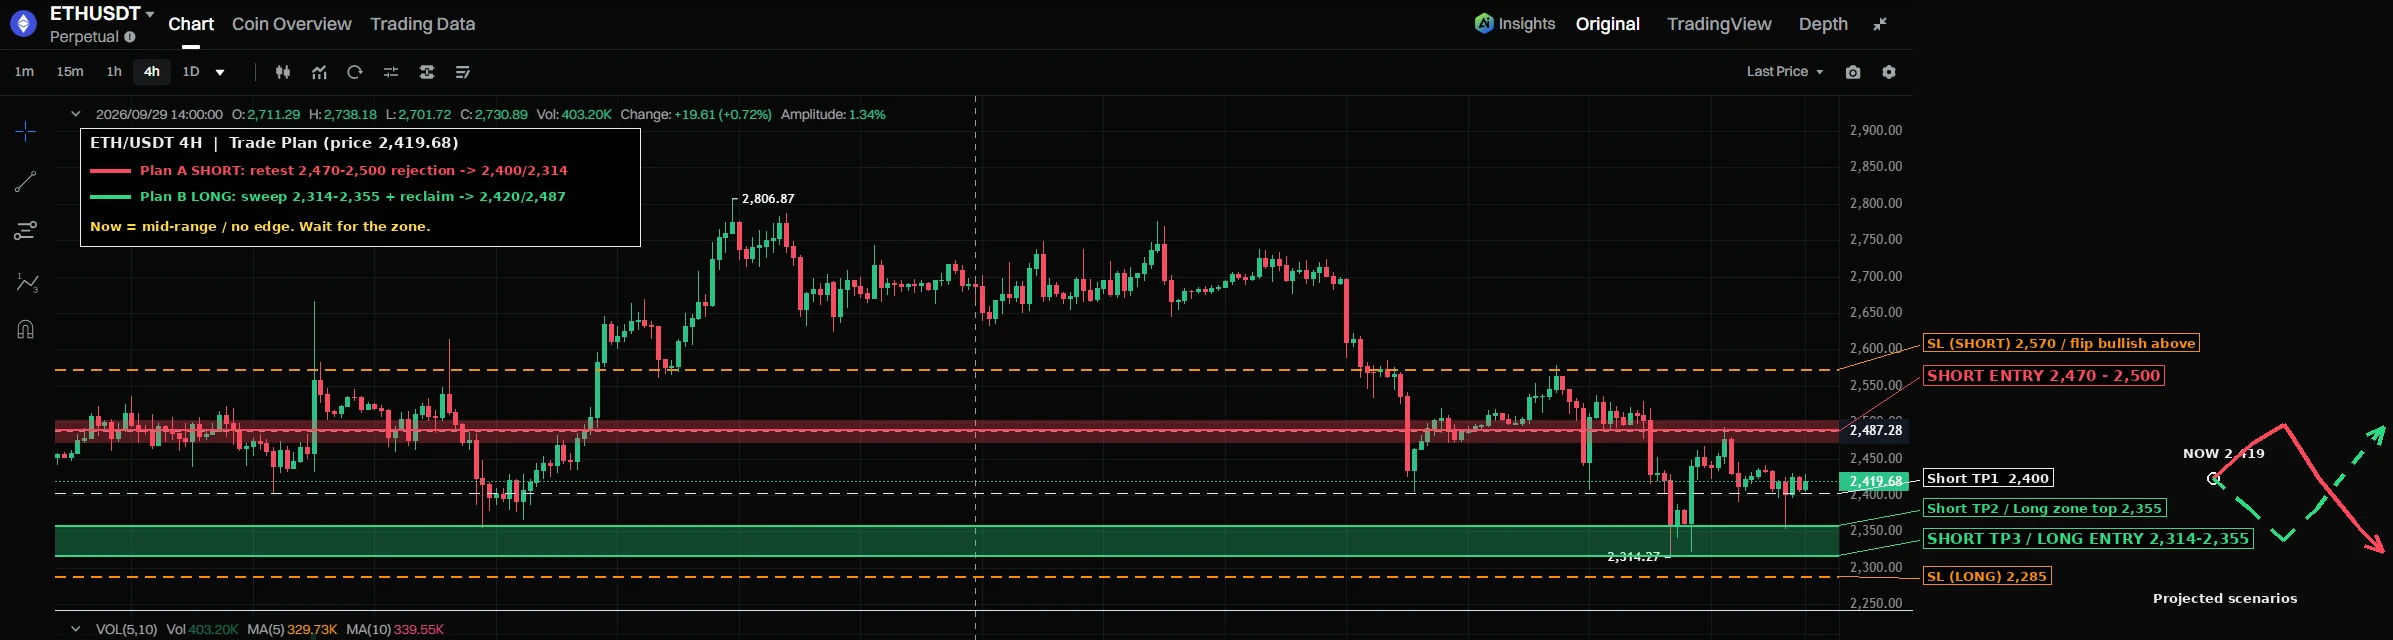
$ETH is back at $2,400. It has been here before.
On August 19, ETH rose about 18% in one day, its biggest daily jump since May 2025.
The easy explanation is “good news.” Reports point to something different. About $1 billion in bets against ETH were wiped out, which forced those traders to buy. Some Treasury bond news added to it.
Forced buying is not the same as people choosing to buy.
But there’s a second part. US Ethereum ETFs kept buying for days afterward. BlackRock’s fund took in roughly $1 billion over nine straight days with no selling. That’s demand with a plan behind it.
Since then
post-image
ETH-1.27%
ETH-1.43%
A huge bearish candle just came down.
If 80K holds, I’m not closing my long. I’m sticking with my bullish view and targeting 90K.
post-image
$Bull is coming. This move dumped from 0.0653 to 0.0560. I chased the highs last time and took an 18% loss as tuition—I still remember it clearly. It’s now at 0.0570, down 12.29% in 24h, with 12.6M in trading volume. Volume hasn’t collapsed, which means buyers are stepping in. My plan: don’t chase at the current price; wait for a pullback to the 0.0560–0.0565 range and enter in batches, keeping my position to 30%. Set a stop-loss at 0.0540 (below the previous low); if it breaks, I’m out—no hesitation. First take-profit target: 0.0600; second: 0.0630. Sell half when it gets there. This coin is
牛来-12.49%
The most unusual detail in today’s market is that the Fear & Greed Index remains in the greed zone at 55, while $SOXLB plunged 8.58% in a single day. Its current price of 86.5 has fallen straight through the lower Bollinger Band at 90.4088, and its RSI has crashed to the deeply oversold level of 17.5. Broader market sentiment has not turned cold, but this asset has already been abandoned by investors—a classic case of outflows from an individual coin within a sector, rather than systemic risk. With BTC trading flat, this kind of divergence often means selling pressure is nearing its end.
Tech
post-image
BTC-0.56%
zcash:native #ZEC #ZECUSD #ZCASH
ZEC PERPETUAL TRADE
SELL SETUP
Short from $1125
Currently $1125
Targeting $1085 or Down
(Trading plan IF ZEC go up to $1210
will add more shorts)
Its not a Financial advice
ZEC-1.52%
$NEAR Can Buyers Defend $4.30?
NEAR is facing a key technical test. The weekly TD Sequential sell signal puts $4.30 support in focus, with $3.76 as a potential downside level if buyers fail to defend it.
However, a bearish signal alone doesn't confirm a breakdown.
A weekly close below $4.30 would increase downside risk, while a strong recovery and resistance reclaim could keep the bullish scenario alive.
The key level is clear. Now the market needs to confirm the direction.
Will NEAR hold support, or are sellers preparing another leg down?
#NEAR #NEARProtocol #CryptoAnalysis
post-image
NEAR-2.53%
$ELIZAOS is up more than 3x from its low. Its founder declared the token dead in August.
Start with the chart. The price sat near $0.00014 for weeks, spiked to $0.0012, fell back to $0.00035, and now trades near $0.0005.
Now the part the chart doesn’t show. In August, ElizaOS founder Shaw Walters said there would be no buybacks, no supply cuts, no replacement token and no organized support for holders. This followed a lawsuit settlement that drained the treasury. The software continues, but separately from the token.
So the token lost what most tokens rely on: a team that cares about its pric
post-image
ELIZAOS+21.09%
Floki all time high hype ath go
post-image
FLOKI-2.57%
$AKE — A bullish reversal pattern has formed at a strong support level...
AKE bounced from the $0.02850 support zone, showing signs of a potential bullish reversal. The price is currently trading around $0.02927, and the latest green candle indicates renewed buying interest. If buyers maintain momentum and break through nearby resistance, the market could see a stronger recovery. Entry zone: $0.02900 – $0.02930 Target 1: $0.02950 Target 2: $0.03000 Target 3: $0.03050 Stop-loss: $0.02840
post-image
AKE-0.51%
Eth sopr oscillator buy signal
post-image
ETH-1.27%
Inflation is basically another tax
post-image
The day I lost 80k U, I deleted my trading app. $ALT bounced from 0.0082 to 0.0094 this time, but I just couldn't bring myself to chase it. But the data doesn't lie: 24h trading volume is 31.2M, turnover has clearly picked up, and retail traders couldn't have driven a 14.32% gain on their own. Net inflows to ALT staking contracts on-chain have risen 23% over the past 7 days, and with TVL in the L2 sector recovering, it's one of the most direct beneficiaries. Technically, 0.0082 is the confirmed bottom after the second retest this cycle, while 0.0098 is resistance at the previous high. My plan
ALT+13.79%
Lighter's EVM devnet, built with Axiom, is live, letting smart contracts place, modify and cancel orders on its exchange directly. Lighter is backed by Founders Fund, Ribbit Capital and Robinhood.
@Lighter_xyz
post-image
LIT-2.19%
HOOD-4.94%
Bitcoin Support and Resistance Levels
live-cover
LIVE87
$JCT I know exactly how I lost on this trade: I got in at 0.0023 and cut my losses at 0.0019, riding out the full -11.93% drop. I contributed to the panic selling in the 5.4M trading volume. Seeing the price near its 24h low, I thought I’d buy the dip, but ended up buying halfway down. I didn’t admit defeat and exit until it hit 0.0019. During the two days I held the position, my mindset went from “it’ll bounce any minute” to “just don’t let it go to zero.” There’s only one lesson: in a downtrend, it’s better to wait for the falling knife to settle than to try to catch it. 0.0019 is today’s lo
JCT-12.66%
Chainalysis, the analytics firm with more than 1,500 customers, automatically covers new tokens deployed on Stable, the chain that uses USDT0 for gas. Its KYT monitoring and Reactor tools trace activity there.
@Stable
STABLE-3.12%
Which of these crypto coins do you hold, hoping for life-changing gains? 1. $BT
2. $SO
3. SUI4. $LINK 5. AAVE
post-image
LINK-3.08%
Load More

Join 40 M users in our growing community

⚡️ Join 40 M users in the crypto craze discussion

💬 Engage with your favorite top creators

👍 See what interests you

Trending Topics

USSeptemberPPIBeatsExpectations

91.35k Views1.93k Discussing

US September PPI came in at 6.3% YoY, well above the 5.3% market expectation, pointing to renewed producer-side inflation pressure. Weekly jobless claims were 199K, broadly in line with forecasts. Could hotter inflation further reduce room for rate cuts, and what does it mean for $BTC, US stocks, and gold?

GateWCTCS9GlobalTradingCompetition

37.87k Views6.67k Discussing

GateBTCAndETHFuturesVolumeRanksTop3

53.8k Views1.81k Discussing

View More