Biology

vip
Futures Trading Strategist
On-chain Analyst
Airdrop Hunter
My character is defined by respect, integrity, and a strong belief in equal opportunity for everyone
ETH BTC XAU
live-cover
LIVE134
#GateTop4MainstreamCEX
Gate staying in the global Top 4 is interesting, but honestly, the ranking itself isn't what caught my attention. The bigger question is whether Gate can turn this position into a real push toward the Top 3.
According to BlockBeats data, Gate recorded approximately $40B in spot trading volume and around $285B in derivatives trading volume in August, placing it fourth among mainstream CEXs globally.
For me, those numbers show that Gate is already operating at a meaningful scale. But I don't think one month's ranking should be the final measure of an exchange's strength.
MrFlower_XingChen
#GateTop4MainstreamCEX
Gate staying in the global Top 4 is interesting, but honestly, the ranking itself isn't what caught my attention. The bigger question is whether Gate can turn this position into a real push toward the Top 3.
According to BlockBeats data, Gate recorded approximately $40B in spot trading volume and around $285B in derivatives trading volume in August, placing it fourth among mainstream CEXs globally.
For me, those numbers show that Gate is already operating at a meaningful scale. But I don't think one month's ranking should be the final measure of an exchange's strength.
What matters more is whether the activity is sustainable.
The $285B derivatives volume is particularly interesting because futures have become a major part of how traders interact with crypto markets. Traders want deep liquidity, fast execution and enough market participation to enter and exit positions without unnecessary slippage.
That's where my opinion comes in.
If I had to choose one factor above headline volume, I would choose liquidity.
High volume looks impressive on a ranking table, but as a trader, I care more about what happens when I actually place an order. Can I enter cleanly? Can I close during volatility? Is the order book deep enough? Are spreads reasonable?
Those things matter much more to me than simply seeing an exchange ranked Top 4 or Top 3
At the same time, I think product range is becoming increasingly important.
Crypto trading is expanding beyond the traditional spot market. Perpetuals, new asset categories, RWA-related products and other derivatives are creating more ways for traders to use an exchange. An exchange that continues adding useful products can potentially attract different types of market participants rather than relying on one trading segment.
Then there is something I personally don't want to compromise on: security and compliance.
I would rather use a platform that combines strong liquidity with a serious approach to security and regulatory development than choose an exchange purely because it has a bigger volume number.
So if you ask me what makes a strong CEX, my ranking would be:
1. Liquidity and execution
2. Security and reliability
3. Useful product range
4. Sustainable trading volume
And that is also why I think Gate's next challenge is more interesting than its current ranking.
Gate doesn't necessarily need to jump from No.4 to No.3 overnight.
It needs to keep proving that the activity behind the ranking is real, consistent and supported by a strong trading ecosystem.
If Gate can maintain this level of spot and derivatives activity while continuing to improve liquidity, products and overall user confidence, then I think the Top 3 conversation becomes much more realistic.
My take is simple: Top 4 is a position to watch, not a finish line.
August gave Gate the numbers.
Now I want to see consistency.
Do you think Gate can make the next move from No.4 into the Top 3? And if you had to choose only one factor when selecting an exchange — liquidity, volume, products, or security — which one would you choose?
#GateMeme #GateTrenchesZeroGas #GateLaunchesTrenchesWith0GasFee #AppleEvent @GateSquare @Gate_Square
repost-content-media
#Web3SecurityGuide
Depositing is easy. Withdrawing safely is where I pay more attention.
When using Gate, I don't look at a deposit or withdrawal as just another button to press. There are several points where a simple mistake can turn into a delayed transfer, additional verification, or even an account restriction.
The first thing I check is the network and destination.
Before confirming a withdrawal, I verify the coin, blockchain network, wallet address and memo/tag when required. I don't assume that because two platforms support the same asset, they automatically support the same network.
MrFlower_XingChen
#Web3SecurityGuide
Depositing is easy. Withdrawing safely is where I pay more attention.
When using Gate, I don't look at a deposit or withdrawal as just another button to press. There are several points where a simple mistake can turn into a delayed transfer, additional verification, or even an account restriction.
The first thing I check is the network and destination.
Before confirming a withdrawal, I verify the coin, blockchain network, wallet address and memo/tag when required. I don't assume that because two platforms support the same asset, they automatically support the same network.
For a new withdrawal address, I prefer sending a small test amount first. Once it arrives correctly, I can consider moving the remaining balance. It may feel slower, but recovering a wrongly sent transaction can be far more difficult.
The second issue is risk control.
Gate states that accounts can be frozen as part of risk-control measures, and its guidance indicates that enhanced monitoring or restrictions can be applied in certain situations.
So I would never try to “trick” the system by creating artificial transaction patterns, opening extra accounts, or routing funds through random third parties just to make activity look different.
My approach is the opposite:
Keep the transaction legitimate, consistent and explainable.
If Gate asks for additional information, provide accurate information through the official support process instead of trying to work around the restriction.
What if your card is frozen?
I wouldn't immediately assume the crypto account itself is compromised. First identify whether the issue is with the card, payment method or Gate account, then follow the official instructions and contact support through the official Gate channels.
For larger withdrawals, I also keep the transaction history organized: deposit records, withdrawal confirmations, transaction IDs and wallet details. If something needs to be reviewed later, having the complete trail makes the situation much easier to explain.
And one rule I consider non-negotiable:
Never let urgency make you careless.
If a withdrawal is pending, don't send the same funds again through another route just because you want it completed faster. Check the status first and understand why it is pending.
For me, safer Gate withdrawals come down to five checks:
Correct asset.
Correct network.
Correct address.
Small test when appropriate.
Complete transaction records.
The objective isn't to avoid Gate's risk controls.
The objective is to make sure your legitimate transaction doesn't create an avoidable problem in the first place.
That's the part of crypto security that doesn't get enough attention.
#AppleEvent @GateSquare @Gate_Square
repost-content-media
BTC ETH DOGE
live-replay-cover
249 views09-12 08:10
01:10:52
ETH
live-replay-cover
454 views09-12 05:30
01:18:13
#ShareWeekly
#NVDA is finally showing some buyers again, but I would not call this a reversal yet. After falling from the $233–$235 area toward $218, the stock is now trying to stabilize around $220. The interesting part is not the small green move itself — it is whether buyers can turn this rebound into a recovery of the levels that were lost this week.
The short-term structure weakened after NVDA failed to hold the $233–$235 region. September 8 produced a high around $233.71, followed by selling on September 9 and 10. The latest session has so far held above $219, which gives buyers a small
MrFlower_XingChen
#ShareWeekly
#NVDA is finally showing some buyers again, but I would not call this a reversal yet. After falling from the $233–$235 area toward $218, the stock is now trying to stabilize around $220. The interesting part is not the small green move itself — it is whether buyers can turn this rebound into a recovery of the levels that were lost this week.
The short-term structure weakened after NVDA failed to hold the $233–$235 region. September 8 produced a high around $233.71, followed by selling on September 9 and 10. The latest session has so far held above $219, which gives buyers a small base to work from, but the stock still has several resistance levels overhead.
Today's broader market environment is helping. U.S. equities rebounded after the latest inflation data came in broadly in line with expectations, while oil prices pulled back and Treasury yields eased from their recent highs. The Nasdaq was up around 1.3% in today's rebound, giving high-growth technology names some breathing room.
But NVDA has its own story to deal with. Barron's reported that Nvidia has fallen about 5% since Tuesday while some chip competitors have moved higher. The report also highlighted a reported DOJ investigation into whether Nvidia attempted to bypass antitrust rules around a 2025 licensing deal involving AI-chip company Groq. Nvidia disputes the concern and says the arrangement supports innovation and consumer benefit. That is not automatically a bearish fundamental signal, but it is another reason I would not chase a bounce without confirmation.
On the positive side, the underlying AI infrastructure story has not disappeared. Nvidia announced plans to expand AI data-center capacity in Australia by up to 2 GW through partnerships with local cloud and data-center companies. Jensen Huang has also been highlighting cybersecurity as another major commercial application for AI. So the long-term demand narrative remains strong even while the stock deals with short-term positioning pressure.
Now the chart becomes more interesting around $219–$220. That is the immediate area buyers need to defend. Today's low is $219.03, so losing that level would tell me the current bounce is failing before it has even reached meaningful resistance.
The first recovery test is $221.30–$222.50. Today's high sits around $221.34, while the options market is also heavily active around the $220–$222.50 strikes. A clean move above this area would improve the short-term structure, but I would still want to see price hold the breakout rather than immediately fall back underneath it.
The bigger resistance zone is $225–$228. NVDA traded around $225 before the latest weakness, and $227.92 was previously identified as an important breakout level. Reclaiming this zone would be much more meaningful than simply moving back above $221.
Above that, $230–$235 is the real decision zone. The recent high of $234.76 sits there, so a break above that level would effectively repair most of the current short-term damage. Until that happens, I still see the stock as being in a correction/recovery phase rather than a confirmed continuation.
On the downside, $219 is the first warning level. A confirmed break below today's low would put $217–$218 back into focus. That zone matters because NVDA has repeatedly traded around it recently, including the September 1 close at $217.44 and the September 2 low near $218.48.
If $217 gives way, the next important area is around $209–$211. Below that, $200 becomes the major psychological level. I would not automatically expect $200 simply because $217 breaks, but the risk of a deeper correction would increase substantially.
The derivatives market is giving another useful warning. Today's options chain shows particularly heavy activity around $220, $222.50, $225 and $227.50, with substantial open interest at several of those strikes. That suggests these levels can attract additional short-term price sensitivity, although options positioning alone does not tell us the direction of the next move.
For the bullish scenario, I want NVDA to first hold $219–$220 and then reclaim $222.50. The stronger confirmation would be a move through $225 with a successful retest. A confirmation entry around $225–$226 would make more sense to me than buying the middle of today's range. Invalidation would be a decisive move back below roughly $219. TP1 would be $230, TP2 $234.76, and TP3 around $240 if the previous high breaks with real momentum.
For the bearish scenario, the clean trigger is a confirmed break below $219, followed by a failed reclaim of that level. I would not short simply because price briefly dips below it. If sellers establish control below $219, the first downside area is $217–$218, followed by $209–$211. A deeper extension could bring $200 into play. The bearish thesis would weaken considerably if NVDA reclaims $225 and starts holding above it.
For me, the best trade is currently confirmation-based. The middle around $220–$222 does not offer enough information. I would rather wait for either a support reaction that clearly holds $219 or a breakout through $225 followed by a retest. That gives the trade a much cleaner invalidation point.
For example, a bullish entry around $225 with a $219 invalidation risks about $6 per share. A move toward $234.76 gives roughly $9.76 of upside, or about 1.6R. A move to $240 would improve that to roughly 2.5R. I would only take the setup if the actual chart confirms the breakout; these are scenario calculations, not guaranteed targets.
Risk management is separate from the thesis. I would keep the account risk around 1–2% on the trade and adjust position size according to the stop distance. If the invalidation is wider, the position should be smaller. The objective is to keep the amount at risk controlled even when NVDA becomes volatile.
My final verdict is neutral with a cautious bullish recovery attempt.
The level that changes my short-term view is $225. A sustained reclaim would make me more constructive and put $230–$234.76 back into focus. A confirmed break below $219 would flip the setup bearish and bring $217–$218, then $209–$211, into focus.
For now, I would not chase the green candle. I want NVDA to prove that $219–$220 is actually becoming support and that buyers can take back $225. That confirmation would tell me far more than today's 1% bounce.
#AppleEvent #GateMeme #GateLaunchesTrenchesWith0GasFee @GateSquare @Gate_Square
$SNDK
repost-content-media
#GateMeme
I entered at 0.08487 with 10x leverage, using only $5 margin, and the position is still active. The trade already moved into profit after entry, but I’m not treating a small green move as the end of the setup.
My target is 100% ROI on the position. With 10x leverage, that means I’m looking for roughly a 10% move in DOGE from my entry, which puts my approximate price objective around 0.09336. That is my trading target, not a claim that DOGE must reach it.
What I like about the setup is that DOGE is still holding close to the 0.084–0.085 area, while the latest 24-hour range has been r
MrFlower_XingChen
#GateMeme
I entered at 0.08487 with 10x leverage, using only $5 margin, and the position is still active. The trade already moved into profit after entry, but I’m not treating a small green move as the end of the setup.
My target is 100% ROI on the position. With 10x leverage, that means I’m looking for roughly a 10% move in DOGE from my entry, which puts my approximate price objective around 0.09336. That is my trading target, not a claim that DOGE must reach it.
What I like about the setup is that DOGE is still holding close to the 0.084–0.085 area, while the latest 24-hour range has been roughly 0.08275 to 0.08548. The important thing for me now is whether buyers can keep defending the lower part of that range and push price back through the recent high.
The broader market is not giving meme coins an easy environment. U.S. inflation remains elevated, and expectations for a Federal Reserve rate hike have increased after the latest CPI data. That can create sudden risk-off moves across crypto, so I’m not ignoring the downside simply because I’m currently long.
For my trade, 0.0855 is the first level I want to see reclaimed and held. If DOGE can turn that area into support, the next psychological test is 0.09000. A clean move above $0.09 would make my 0.09336 target much more realistic from a structure perspective.
On the other hand, 0.0827–0.0830 is the area I’m watching on the downside. A decisive break below that range would tell me that buyers are losing control of the current structure, and I would reassess the trade rather than blindly hold because I have a target.
I’m also keeping the leverage in perspective. 10x does not mean I need to force the market to give me 100% ROI. It simply increases the sensitivity of my $5 margin to DOGE's price movement. My job is to manage the position if the market stops following the thesis.
For now, I’m holding and watching the range. I want DOGE to prove strength above 0.0855, then 0.0900 becomes the next important checkpoint. If momentum continues, 0.09336 is my 100% ROI target.
I’m still holding my DOGEUSDT long.
My trade is active. My target is clear, but the market still has to earn that target.
#AppleEvent #GateMeme #GateLaunchesTrenchesWith0GasFee @GateSquare @Gate_Square
$DOGE
repost-content-media
DOGE+0.50%
#GateMeme
I closed my ZECUSDT long, and looking back at the trade, the exit mattered just as much as the entry.
I entered at 1,161.03 with 20x leverage, and the position reached +71.60% ROI, with the trade screen showing price around 1,204.16. I decided to close it instead of waiting for the market to give me one more push.
The reason I was interested in ZEC was the strength it had been showing. The coin had moved aggressively from below $1,000 into the $1,200+ area, but that kind of vertical move also creates a very different risk profile. When price moves that fast, I want to participate i
MrFlower_XingChen
#GateMeme
I closed my ZECUSDT long, and looking back at the trade, the exit mattered just as much as the entry.
I entered at 1,161.03 with 20x leverage, and the position reached +71.60% ROI, with the trade screen showing price around 1,204.16. I decided to close it instead of waiting for the market to give me one more push.
The reason I was interested in ZEC was the strength it had been showing. The coin had moved aggressively from below $1,000 into the $1,200+ area, but that kind of vertical move also creates a very different risk profile. When price moves that fast, I want to participate in the momentum without becoming attached to the position.
And today's price action explains why taking the profit made sense.
ZEC has since experienced a sharp reversal from the $1,290+ area, falling toward the $1,100 region. Today's move has been particularly aggressive, with ZEC briefly trading below $1,100 as the broader crypto market came under pressure.
The important technical change is that ZEC has lost several short-term moving-average levels and is now testing the area around $1,100. A recent technical report identified the rising 200-hour average near $1,099 as an important support area. If that level fails, the correction can become deeper rather than simply being a normal pullback.
For me, the key resistance is now around $1,160–$1,180. That area is important because it sits around the recent trading structure and could become resistance after the breakdown. If ZEC can reclaim it and hold above it, buyers could attempt another move toward $1,220 and eventually the $1,290–$1,300 zone.
On the downside, $1,100 is the first area I would watch, followed by roughly $1,050. Losing $1,050 would tell me that the current correction is becoming much more serious. I would not assume that previous momentum automatically returns just because ZEC has already made a huge move.
The broader market is also working against aggressive longs right now. Today's macro backdrop has increased expectations for a Federal Reserve rate hike, while Bitcoin has remained under pressure. When BTC weakens, highly volatile altcoins such as ZEC can experience much larger percentage moves.
That is actually one of the main lessons from this trade for me: a good entry doesn't mean I need to hold forever.
My entry was 1,161.03. The market gave me a strong move in my direction, and the position reached +71.60% ROI. I chose to close it while the setup was still working rather than turn a successful trade into a battle against a reversal.
I don't consider the exit a call that ZEC must fall. If ZEC recovers $1,180 and later breaks back above $1,220, the structure could improve again. But that would be a new setup for me, not a reason to keep an old position open.
Trade closed. +71.60% ROI booked.
The next opportunity doesn't need to be forced. If ZEC rebuilds above resistance, I'll study the next long. If $1,100 breaks and sellers remain in control, I'll wait for the market to show where the next real support is.
For me, the best part of this trade wasn't simply getting the direction right. It was knowing when the trade had already done enough.
$ZEC
#AppleEvent #GateMeme #GateLaunchesTrenchesWith0GasFee @GateSquare @Gate_Square
repost-content-media
ZEC+1.31%
BTC+0.02%
BTC XAU
live-replay-cover
869 views09-11 01:54
01:33:24
#GateTop4MainstreamCEX
Gate’s position in the global exchange market is becoming harder to ignore.
The August 2026 numbers tell a bigger story than a simple ranking.
Gate recorded roughly $40 billion in spot trading volume and around $285 billion in futures volume during August, putting its combined trading activity at approximately $325 billion for the month.
But the more interesting part is not the headline volume. It is where that volume is coming from.
Gate’s spot market continues to represent a meaningful part of its activity, while derivatives have become the dominant engine of overall
MrFlower_XingChen
#GateTop4MainstreamCEX
Gate’s position in the global exchange market is becoming harder to ignore.
The August 2026 numbers tell a bigger story than a simple ranking.
Gate recorded roughly $40 billion in spot trading volume and around $285 billion in futures volume during August, putting its combined trading activity at approximately $325 billion for the month.
But the more interesting part is not the headline volume. It is where that volume is coming from.
Gate’s spot market continues to represent a meaningful part of its activity, while derivatives have become the dominant engine of overall trading volume. That tells me the platform is increasingly being used not only by users looking to buy and sell assets, but also by traders actively managing leverage, hedging positions and trading short-term market moves.
This matters because exchange growth is no longer just about listing more tokens.
The real competition between major CEXs is increasingly about liquidity, execution, derivatives depth, product variety, risk controls and the ability to retain traders across different market conditions.
And this is where Gate’s recent trajectory becomes interesting.
A large futures number by itself does not automatically mean an exchange has achieved mainstream status. Sustainable growth requires enough liquidity to support that volume, particularly around major assets where traders care about spreads, slippage and execution quality.
That is why I would pay closer attention to the relationship between volume and liquidity, rather than looking at volume alone.
Another important point is market composition.
Crypto trading has increasingly moved toward derivatives, but spot remains the foundation of the market. An exchange that can maintain substantial activity across both markets has a more diversified trading ecosystem than one relying almost entirely on a single product category.
Gate’s August figures suggest that derivatives are doing the heavy lifting, while spot remains a significant part of the platform’s overall activity.
For traders, this creates an interesting feedback loop.
More trading activity can attract more market makers. Better liquidity can improve execution. Better execution can attract more active traders. And a deeper trading community can support further growth across spot, futures and other products.
But there is also a second side to this equation: scale brings greater responsibility.
As an exchange becomes larger, users will naturally expect stronger infrastructure, reliable execution during volatile markets, transparent risk management, competitive fees and greater confidence in the platform’s ability to handle high-volume periods.
So I don't think the real question is simply:
“Can Gate move from one ranking to another?”
The more important question is whether Gate can turn this level of trading activity into long-term market depth and user retention.
If the August numbers are sustained, Gate is moving beyond the conversation of being simply another crypto exchange. It is increasingly competing for a place among the major global CEX platforms.
And that changes the standard.
At this stage, the next milestone should not just be another volume record.
It should be stronger spot liquidity, deeper derivatives markets, consistent execution and sustainable growth through both bull and bear conditions.
That is what separates a temporary volume spike from a genuinely established exchange.
**August showed the scale.
The next few months will show whether Gate can sustain it.**
#GateMeme #GateTrenchesZeroGas #GateLaunchesTrenchesWith0GasFee #AppleEvent @GateSquare @Gate_Square
repost-content-media
#AppleSeptemberEvent
Apple just opened a new chapter for the iPhone. Now the market has to decide whether that chapter deserves a higher valuation.
The September event was important for one reason: Apple did not simply refresh the existing iPhone formula. It introduced the iPhone Duo, its first foldable iPhone, while simultaneously pushing the Pro lineup further into premium hardware, performance and AI.
That changes the investment conversation around $AAPL.
The iPhone Duo launches at $1,999 and opens into a 7.6-inch display. Apple says it is the thinnest iPhone ever when unfolded, uses a pre
MrFlower_XingChen
#AppleSeptemberEvent
Apple just opened a new chapter for the iPhone. Now the market has to decide whether that chapter deserves a higher valuation.
The September event was important for one reason: Apple did not simply refresh the existing iPhone formula. It introduced the iPhone Duo, its first foldable iPhone, while simultaneously pushing the Pro lineup further into premium hardware, performance and AI.
That changes the investment conversation around $AAPL .
The iPhone Duo launches at $1,999 and opens into a 7.6-inch display. Apple says it is the thinnest iPhone ever when unfolded, uses a precision hinge and dual-battery architecture, and runs on the new A20 Pro chip. Pre-orders begin October 16, with availability from October 23.
At first glance, the $1,999 price looks aggressive.
But I think Apple is making a very deliberate choice: it is not trying to win the foldable market through price. It is trying to redefine the premium end of the category.
That creates both opportunity and risk.
If customers accept the price, Apple has created a completely new premium hardware category that could increase revenue per device and potentially lift the value of its enormous installed base.
But the opposite scenario is equally important.
A $1,999 phone has to deliver a very different level of perceived value. Apple cannot rely purely on the logo and ecosystem forever. Consumers have to believe the foldable format genuinely changes how they use the phone.
That is where the Duo's software strategy becomes important.
Apple has redesigned iOS 27 around the foldable form factor, while integrating Apple Intelligence and Siri AI. The company is effectively selling the combination of hardware + software + ecosystem, rather than treating the foldable screen as the entire product.
Then there is the iPhone 18 Pro.
Apple upgraded the Pro camera system with a 48MP Fusion Main camera and variable aperture, while the A20 Pro chip and new vapor-chamber system are designed to improve sustained performance. Apple also says the 18 Pro Max delivers its largest-ever increase in battery life.
That matters for AAPL because premium pricing only works if customers continue moving toward higher-value models.
The real test is therefore not whether the specifications look impressive on stage.
The real test is whether consumers upgrade.
And this is where I would separate the product story from the stock story.
A successful launch can be great for Apple while still producing a disappointing stock reaction if expectations are already too high.
Markets don't pay companies simply for having good products. They pay for better-than-expected growth.
For AAPL, I would watch four things after the launch:
1. Pre-order demand
This will provide the earliest signal of whether the Duo's $1,999 positioning is being accepted by consumers.
2. Pro mix
If customers continue choosing higher-priced Pro models, Apple can potentially increase average selling prices without needing explosive unit growth.
3. AI-driven upgrades
Apple Intelligence and Siri AI need to become reasons to upgrade, not just features that sound impressive during a keynote. Apple has now put AI directly into the hardware investment case.
4. Margins and guidance
This is ultimately where the story becomes financial. Higher hardware complexity, foldable components and AI infrastructure all have costs. Revenue growth means much more to investors if it translates into sustainable earnings and cash flow.
There is also a bigger strategic point here.
Apple is entering foldables years after Samsung and other manufacturers established the category. That means Apple is not necessarily trying to invent the market from scratch. It can enter after competitors have already educated consumers and exposed many of the category's weaknesses.
Reuters reports that Apple's entry could significantly intensify competition in foldables, while Samsung is already responding publicly to the new challenger.
That is a very different strategy from being first.
Apple often waits until a category is mature enough to understand, then tries to make the experience easier and more mainstream.
If that strategy works again, the Duo could become much more important than one year's iPhone sales.
It could become the beginning of another long product cycle.
But I would not chase AAPL simply because Apple had a big keynote.
The keynote created the narrative.
Now the market needs evidence.
Watch pre-orders. Watch the Pro mix. Watch demand for the Duo. Watch margins. Watch guidance. Most importantly, watch whether customers are actually willing to pay Apple's new premium.
If those numbers confirm the story, Apple's September event could eventually be remembered as more than another iPhone launch.
It could be the moment Apple started expanding the definition of what an iPhone can be.
Apple has delivered the product story.
Now it has to deliver the financial story.
$AAPL ‌
@GateSquare @Gate_Square
#GateMeme #GateTrenchesZeroGas #GateLaunchesTrenchesWith0GasFee
repost-content-media
AAPL+1.71%
#GateUSPartnersWithRQDClearing
Gate is moving the conversation from trading to infrastructure.
The strategic cooperation being explored with RQD Clearing may look like another partnership announcement on the surface, but I think the bigger story is what sits behind it.
Gate brings a large digital-asset trading ecosystem and customer-facing infrastructure.
RQD brings something very different: U.S. market clearing, custody and financial-market infrastructure.
Put those two pieces together and the potential goes beyond simply adding another product.
The most interesting part of this development
MrFlower_XingChen
#GateUSPartnersWithRQDClearing
Gate is moving the conversation from trading to infrastructure.
The strategic cooperation being explored with RQD Clearing may look like another partnership announcement on the surface, but I think the bigger story is what sits behind it.
Gate brings a large digital-asset trading ecosystem and customer-facing infrastructure.
RQD brings something very different: U.S. market clearing, custody and financial-market infrastructure.
Put those two pieces together and the potential goes beyond simply adding another product.
The most interesting part of this development is the possibility of connecting the front end of digital-asset markets with the back end of traditional finance.
Trading gets the attention.
But clearing, custody and settlement are what allow financial markets to operate at scale.
That becomes even more important as tokenized stocks and other real-world assets move from an idea into actual market infrastructure.
RQD is already active in traditional U.S. markets. According to Gate’s reporting on the company’s recent funding round, RQD cleared approximately 69.5 billion shares and 64.8 million options contracts over a seven-month period, representing nearly $2 trillion in equity notional value. The company also raised $74 million, led by Bain Capital Tech Opportunities, to expand its infrastructure and explore digital assets and tokenization.
That gives this cooperation an interesting strategic angle.
Gate does not necessarily need to reinvent every piece of traditional financial infrastructure from the ground up.
Instead, the opportunity could be to connect its digital-asset ecosystem with infrastructure that already understands how traditional U.S. markets operate.
And that brings me to the four areas I would watch most closely.
1. Clearing
If digital and traditional assets increasingly trade through connected ecosystems, efficient clearing becomes a critical layer. The ability to move from execution toward reliable post-trade processing could become a major competitive advantage.
2. Custody
Institutional investors care about more than execution. They need secure asset custody, clear ownership structures, controls and reliable settlement processes.
That makes custody one of the most important pieces of the bridge between crypto markets and traditional finance.
3. Tokenization
This is probably the most interesting long-term opportunity.
If traditional securities become increasingly represented on blockchain infrastructure, the market will need more than token issuance.
It will need a complete lifecycle:
issuance → trading → clearing → settlement → custody.
That is where a Gate + RQD relationship could potentially become much more meaningful.
4. More traditional assets
Gate has already expanded beyond the traditional crypto-only exchange model with products connected to U.S. equities and options.
The bigger question is whether this infrastructure strategy can eventually support a broader multi-asset environment where digital assets and traditional financial instruments can coexist more seamlessly.
That would represent a much bigger shift than simply adding another trading product.
But there is an important point investors and users should keep in mind:
This is still an exploration stage.
Gate and RQD are currently discussing potential cooperation pathways, and the specific scope and architecture are expected to be clarified later. Nothing should be interpreted as an already-completed integration.
Personally, I think tokenization + clearing is the combination worth watching most closely.
Tokenization gets the headlines because putting real-world assets on-chain sounds revolutionary.
But without reliable clearing, custody, compliance and settlement infrastructure behind those assets, the technology alone cannot create a mature financial market.
That is why this cooperation interests me.
The next phase of crypto adoption may not be defined by another meme coin, another exchange listing or another trading pair.
It may be defined by something much less visible:
the infrastructure connecting crypto with the existing financial system.
Gate already has the trading side.
RQD brings experience on the financial infrastructure side.
If the two can successfully connect those layers, the potential opportunity is much larger than a single partnership announcement.
Crypto started by building a new financial system.
The next stage may be about connecting that system to the old one.
And that is the part I’ll be watching.
@GateSquare @Gate_Square
#GateUS与RQDClearing达成战略合作
#GateMeme #GateLaunchesTrenchesWith0GasFee
repost-content-media
#GateLaunchesTrenchesWith0GasFee
Gate Trenches VELO is at the point where the next candle matters more than the last candle.
VELO is around $0.02337, showing a 12.14% gain, with about $146.9K turnover, $1.52M liquidity, and a market cap near $21.39M. The move is interesting because price was compressed for a while around the $0.0233–$0.0234 area before buyers suddenly pushed it toward $0.02351.
That tells me buyers are testing the top of the range, but it is still only a test.
The level I care about most is $0.02350–$0.02355. If VELO can break this zone, stay above it and successfully retest
MrFlower_XingChen
#GateLaunchesTrenchesWith0GasFee
Gate Trenches VELO is at the point where the next candle matters more than the last candle.
VELO is around $0.02337, showing a 12.14% gain, with about $146.9K turnover, $1.52M liquidity, and a market cap near $21.39M. The move is interesting because price was compressed for a while around the $0.0233–$0.0234 area before buyers suddenly pushed it toward $0.02351.
That tells me buyers are testing the top of the range, but it is still only a test.
The level I care about most is $0.02350–$0.02355. If VELO can break this zone, stay above it and successfully retest it, the structure starts looking much healthier. In that case, I would watch $0.02380, then $0.02420, with $0.02480–$0.02500 as the bigger momentum target.
I would not chase the first breakout candle.
The better trade, in my view, is to let the market prove the breakout and then look for a controlled retest around $0.02350–$0.02360. That gives buyers a defined invalidation instead of entering after the price has already expanded.
The short-term support is around $0.02338–$0.02340, while $0.02330–$0.02333 is the more important range floor. The recent low around $0.02329 is the line I would use to judge whether this setup has actually failed.
There is another reason I am cautious: momentum is already hot. RSI(6) is around 83, RSI(12) around 70, while RSI(24) is near 58.5. That is strong short-term buying pressure, but it also means a pullback would not be surprising.
MACD is turning upward as well, supporting the momentum shift. What I want to see next is volume following price. A breakout with no meaningful increase in activity can easily turn into a liquidity sweep.
My bullish plan is simple:
Break and hold $0.02355 → retest → confirmation → continuation.
Entry zone: $0.02350–$0.02360 after confirmation
Invalidation: around $0.02330
TP1: $0.02380
TP2: $0.02420
TP3: $0.02480–$0.02500
At a $0.02355 entry with a $0.02330 stop, the risk is about $0.00025 per token. The potential toward $0.02420 is roughly 2.6R, while $0.02500 offers around 5.8R, before fees and slippage.
On the other side, losing $0.02329 and failing to reclaim it would change the picture. I would then expect the market to revisit lower parts of the recent range rather than assuming the breakout will recover immediately.
This is still a relatively small-cap Gate Trenches token, so liquidity can change quickly. I would keep trade risk around 1–2% of capital and size the position from the stop distance. The closer the stop, the larger the position can be; the wider the stop, the smaller it should be.
My view: neutral-to-bullish, but waiting for confirmation.
$0.02355 is the breakout trigger I am watching.
$0.02329 is the level that invalidates the short-term bullish structure.
VELO has shown the first sign of strength. Now it needs to prove that buyers can hold the breakout, not just create a spike.
#AppleEvent #GateMeme #GateLaunchesTrenchesWith0GasFee @GateSquare @Gate_Square
repost-content-media
#USStocksRecordSixthLargestWeeklyInflowSince2008
The U.S. equity market is showing a divergence that is becoming difficult to ignore.
According to the BofA data highlighted here, U.S. equities attracted around $7 billion in net inflows last week, making it the sixth-largest weekly inflow since 2008.
On the surface, that sounds straightforward: capital is still moving into stocks.
But the more interesting part is where that capital is coming from.
Institutions and hedge funds were buyers for the second consecutive week, with Technology leading the buying activity.
At the same time, retail inve
MrFlower_XingChen
#USStocksRecordSixthLargestWeeklyInflowSince2008
The U.S. equity market is showing a divergence that is becoming difficult to ignore.
According to the BofA data highlighted here, U.S. equities attracted around $7 billion in net inflows last week, making it the sixth-largest weekly inflow since 2008.
On the surface, that sounds straightforward: capital is still moving into stocks.
But the more interesting part is where that capital is coming from.
Institutions and hedge funds were buyers for the second consecutive week, with Technology leading the buying activity.
At the same time, retail investors continued selling for the sixth consecutive week.
So once again, two groups are positioning in opposite directions.
Institutional money is adding exposure while retail investors are becoming more defensive.
I don't think this should simply be labeled as “smart money versus retail.”
Institutional investors can be early, late, or wrong just like everyone else. What makes the data interesting is the persistence of the divergence.
If large investors continue accumulating while retail keeps reducing exposure, the next question is whether that institutional demand can actually support the market when volatility increases.
And right now, the macro environment is giving that question more weight.
U.S. stocks recently came under pressure as Treasury yields moved higher and oil prices surged. On September 10, the S&P 500 fell 0.58%, the Nasdaq lost 0.65%, while Nvidia declined about 2.3%.
That makes Technology and NVDA particularly important.
Tech may be attracting institutional money, but price action still has to confirm that demand.
NVDA is a good example.
The stock fell around 2.26% to $218.36 on September 10, despite Nvidia announcing a new AI partnership with Palantir. The broader weakness in technology and higher Treasury yields outweighed the positive company-specific headline.
For me, that creates a much more interesting setup than simply saying “institutions are buying NVDA.”
I want to see whether NVDA can regain momentum and whether buyers step back in with meaningful volume.
If institutional demand continues and NVDA starts reclaiming important resistance levels, the flow data becomes much more convincing.
But if institutions are supposedly accumulating while NVDA keeps making weaker moves, that tells me the market is not yet validating the bullish thesis.
So my approach would be:
Don't follow the institutions blindly.
Follow the combination of flow + price + volume + market structure.
Institutional buying is the first signal.
Technology strength is the second.
NVDA confirming that strength is where the trade becomes interesting.
The bigger picture is also important: broader equity-flow datasets can sometimes tell a different story depending on what they measure. For example, LSEG Lipper data recently showed U.S. equity funds experiencing significant outflows.
That is why I would treat the BofA figure as a specific client-flow signal, not as proof that every part of the U.S. market is experiencing the same buying pressure.
The real takeaway for me is simple:
Retail is selling. Institutions are buying. Technology is attracting attention.
Now the market has to prove whether the institutional side is actually strong enough to push prices higher.
That is why NVDA remains one of the key stocks I would watch for confirmation.
$NVDA
#AppleEvent #GateMeme #GateLaunchesTrenchesWith0GasFee @GateSquare @Gate_Square
#SKHynixSurges7ToNewHigh
SK hynix: AI memory demand is strong, but the breakout still needs confirmation
SK hynix is in an interesting position right now.
The stock has just gone through a powerful recovery, gaining roughly 12.5% over the last five trading sessions, but price is now sitting directly underneath a resistance zone that has already rejected buyers multiple times.
The latest completed session closed at approximately 1,372.90 USDT equivalent, down 0.16% on the day. The intraday range was roughly 1,341.78–1,400.31 USDT equivalent, with about 4.38M shares traded.
For the seven-day v
MrFlower_XingChen
#SKHynixSurges7ToNewHigh
SK hynix: AI memory demand is strong, but the breakout still needs confirmation
SK hynix is in an interesting position right now.
The stock has just gone through a powerful recovery, gaining roughly 12.5% over the last five trading sessions, but price is now sitting directly underneath a resistance zone that has already rejected buyers multiple times.
The latest completed session closed at approximately 1,372.90 USDT equivalent, down 0.16% on the day. The intraday range was roughly 1,341.78–1,400.31 USDT equivalent, with about 4.38M shares traded.
For the seven-day view, SK hynix closed around 1,220.27 USDT equivalent on September 4. From there, it accelerated to the current level, giving the stock roughly +12.5% over the period.
The market-cap equivalent is approximately 1.00T USDT, based on the reported 1,353.6T KRW valuation and the same FX rate.
The recent price action tells the story better than the percentage gain.
SK hynix jumped about 8.26% on September 7, then pushed toward 1,400 USDT equivalent on September 8 and again on September 10. But despite repeatedly testing that area, buyers have not yet produced a clean daily breakout.
That makes 1,400 USDT the key level on my chart.
This isn't just a psychological number. The underlying KRX price reached ₩1.889M–₩1.890M on multiple sessions, so there is real evidence of supply appearing around this zone. A breakout through it would therefore mean more than simply crossing a round number.
The fundamental backdrop remains supportive.
The biggest driver is still AI memory demand and HBM. SK hynix has been positioning itself around the HBM supercycle, while the latest industry news points to a serious shortage of high-bandwidth memory. Chinese AI-chip companies have reportedly raised prices because HBM availability has become a bottleneck.
That is important for SK hynix because the company is directly exposed to this memory-demand cycle. Its own outlook has highlighted HBM3E and the transition toward HBM4 as major growth areas.
But I don't want to confuse strong fundamentals with an automatic long trade.
The broader semiconductor environment is still sensitive to rates, yields and risk appetite. U.S. markets have been under pressure as oil moved above $100 and Treasury yields climbed, while major technology names also weakened. That can create short-term profit-taking even when the long-term AI memory story remains intact.
The levels I care about
1,400 USDT is the main breakout zone.
A decisive move above this area followed by a successful retest would tell me that the previous sellers have been absorbed. That would be much stronger than simply seeing an intraday wick above resistance.
Below price, 1,342–1,355 USDT is the first important support area, corresponding to the latest session's low and nearby price structure.
If that zone holds during a pullback, the current bullish structure remains intact.
The next important support is around 1,315–1,320 USDT, followed by the much more important 1,220–1,250 USDT region. That lower zone represents the area from which the latest acceleration began, so losing it would seriously weaken the current trend.
Bullish scenario
I would not chase SK hynix directly underneath 1,400 USDT.
The cleaner setup is a confirmed breakout above 1,400, followed by a retest that holds approximately 1,390–1,405 USDT.
A confirmation entry around 1,400–1,410 USDT would make more sense to me than buying into resistance.
My upside map would be:
TP1: 1,450 USDT
TP2: 1,500 USDT
TP3: 1,575 USDT
The invalidation would be a failed breakout followed by a decisive move back below roughly 1,355–1,365 USDT.
Bearish scenario
The bearish setup is different.
I would first want to see 1,342 USDT break, followed by a failed attempt to reclaim that level.
That would suggest the latest rally is losing its immediate support.
The first downside area would be around 1,315–1,320 USDT.
If selling becomes stronger, 1,250 USDT becomes the next major area, with the deeper structural target around 1,220 USDT.
I would not short simply because SK hynix has already rallied 12%+. The better setup is support breakdown + failed reclaim.
Trading strategy
For me, this is currently a breakout-or-pullback trade, not a chase.
The aggressive setup is the confirmed 1,400 breakout.
The more conservative setup is waiting for a pullback into 1,342–1,355 USDT, then watching whether buyers defend that area.
If I were trading it, I would keep the risk per trade around 1–2% of total capital. Position size should come from the stop distance, not from how confident the setup feels. A wider stop means a smaller position.
One important limitation: I could not verify a reliable current open-interest, funding-rate or liquidation dataset for the underlying SK hynix KRX shares, so I am deliberately leaving derivatives positioning out rather than inventing numbers.
Final verdict
My current bias is neutral-to-bullish.
The fundamentals are strong, AI/HBM demand is providing a real catalyst, and the recent price structure shows buyers have taken control.
But the market still needs to prove one thing:
Can SK hynix turn 1,400 USDT from resistance into support?
A confirmed breakout and successful retest above 1,400 USDT would shift my bias clearly bullish.
A breakdown below 1,342 USDT, especially followed by a failed reclaim, would weaken the setup and put 1,315–1,320 USDT and then 1,250 USDT back into focus.
For now, I would rather let SK hynix confirm the breakout than chase the rally.
#AppleEvent #GateMeme #GateLaunchesTrenchesWith0GasFee @GateSquare @Gate_Square
repost-content-media
#USTreasuryToBuyBackUpTo6Billion
U.S. Treasury Just Tripled Its Bond Buyback — But Look at the Yield
The U.S. Treasury announced a buyback of up to $6 billion of 10- to 20-year Treasury bonds on Thursday.
At first glance, $6 billion sounds massive. But the important part is the context: the U.S. Treasury market is worth more than $32 trillion. Against that size, the buyback is still relatively modest.
What makes this more interesting is the change in scale.
The operation is three times the normal size, and the Treasury has committed to conducting future operations of at least $4 billion. That
MrFlower_XingChen
#USTreasuryToBuyBackUpTo6Billion
U.S. Treasury Just Tripled Its Bond Buyback — But Look at the Yield
The U.S. Treasury announced a buyback of up to $6 billion of 10- to 20-year Treasury bonds on Thursday.
At first glance, $6 billion sounds massive. But the important part is the context: the U.S. Treasury market is worth more than $32 trillion. Against that size, the buyback is still relatively modest.
What makes this more interesting is the change in scale.
The operation is three times the normal size, and the Treasury has committed to conducting future operations of at least $4 billion. That tells me the focus is not just on one transaction, but on improving conditions in the longer-duration part of the bond market.
Yet the market is still under pressure.
The 10-year Treasury yield touched 4.84%, its highest level since November 2023. That is the number I would pay more attention to than the headline buyback figure.
A larger buyback can support liquidity and remove some securities from the market, but $6 billion is tiny compared with the overall Treasury market. If yields remain elevated despite the larger operation, it shows that the bigger forces driving bonds are still firmly in control.
And this matters far beyond Treasuries.
Long-term yields influence borrowing costs, valuations and investor risk appetite across global markets. When yields stay high, higher-risk assets have to compete with increasingly attractive returns from government bonds.
So my takeaway is simple: don't trade the $6B headline — watch the 10-year yield.
If 4.84% becomes a level the market can hold above, the pressure on risk assets could become more important. If yields cool back down, the Treasury's liquidity measures may start looking more meaningful.
For now, the headline is big.
The market impact still has to prove it.
repost-content-media
#GateMeme
My main reason for watching PONS is not the hype around the meme coin. It is the combination of high trading activity, extreme volatility, and the possibility of a momentum reset after the recent sell-off.
PONS pushed close to $0.97 earlier this month, but the move has since been heavily retraced. With price around $0.55 and 24-hour volume near $193M, there is still enough activity for the token to make sharp moves in either direction.
That is exactly why I don't want to chase it.
After a move of this size, my first priority is to find out whether the pullback is creating a new base
MrFlower_XingChen
#GateMeme
My main reason for watching PONS is not the hype around the meme coin. It is the combination of high trading activity, extreme volatility, and the possibility of a momentum reset after the recent sell-off.
PONS pushed close to $0.97 earlier this month, but the move has since been heavily retraced. With price around $0.55 and 24-hour volume near $193M, there is still enough activity for the token to make sharp moves in either direction.
That is exactly why I don't want to chase it.
After a move of this size, my first priority is to find out whether the pullback is creating a new base or simply turning into a deeper downtrend. The $0.53–$0.55 zone is the first area I’m watching because it sits close to the current daily low. If buyers repeatedly defend this area while volume returns, the setup becomes much more interesting.
My strategy
I would divide the trade into confirmation stages rather than entering with the full position immediately.
Stage 1 — Watch the support:
I want to see PONS hold around $0.53–$0.55 instead of continuously making lower lows.
Stage 2 — Wait for momentum:
A bounce by itself is not enough. I want to see stronger buying volume accompanying the recovery. That would suggest buyers are actually participating rather than a temporary relief bounce.
Stage 3 — Reclaim resistance:
The $0.65 area becomes an important recovery checkpoint. Above that, $0.72 would be the next major area I would watch. Reclaiming these levels with convincing volume would improve the bullish structure.
Stage 4 — Risk control:
If PONS loses the $0.50 psychological level decisively, I would not keep averaging down simply because the price looks cheaper. The invalidation of the setup is more important than trying to predict the bottom.
My preferred approach here is therefore confirmation over prediction. I would rather enter after the market proves that buyers are returning than buy every red candle on the way down.
PONS has already demonstrated that it can move extremely fast. That creates opportunity, but it also makes position sizing and stop discipline even more important.
The main thing I'm watching isn't whether PONS can pump again. It's whether buyers can build a strong enough base to justify the next move.
No FOMO. No blind dip buying.
Let the price confirm the trade.
$PONS
#GateMeme #GateTrenchesZeroGas #GateLaunchesTrenchesWith0GasFee #AppleEvent @GateSquare @Gate_Square
repost-content-media
PONS-1.02%
#GateGloballyLaunchesStockEventContracts
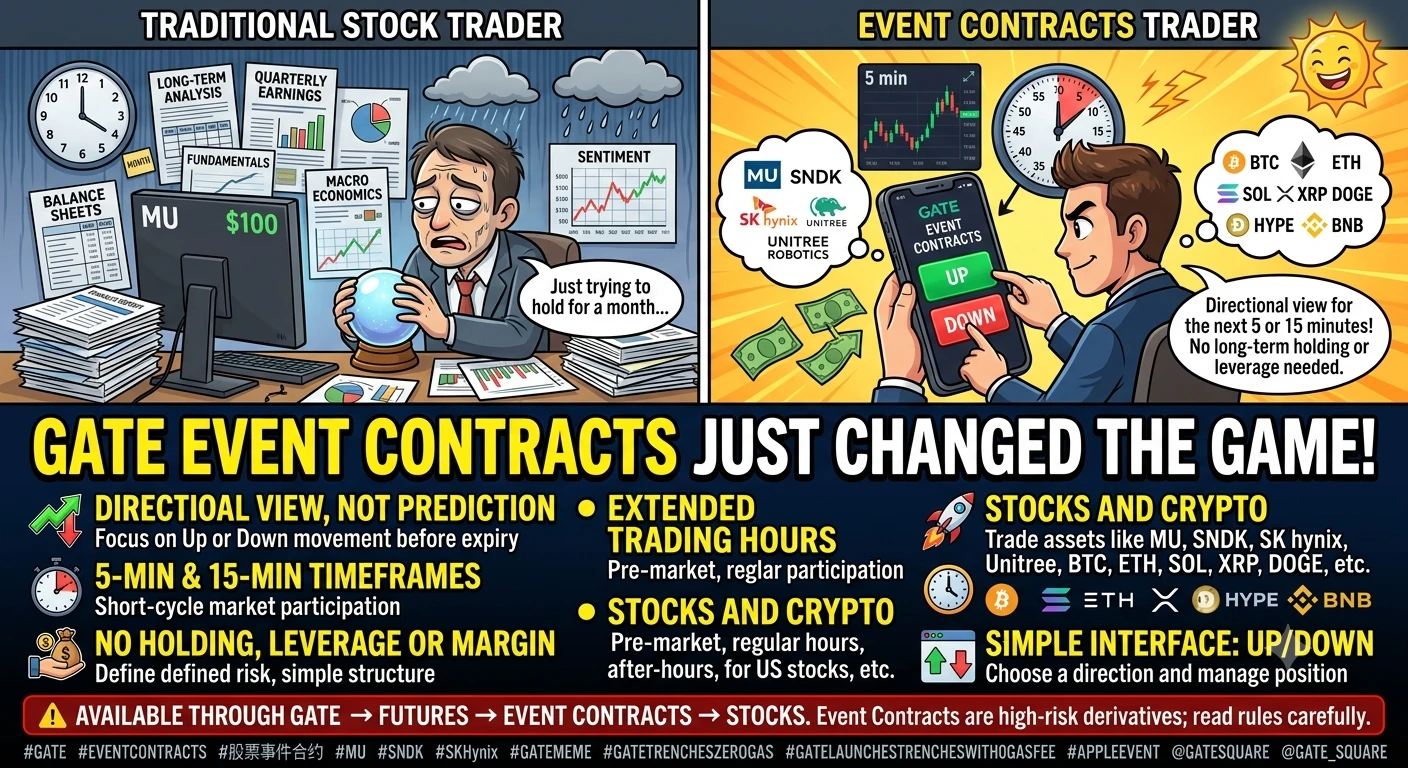
Gate Event Contracts Just Changed the Game for Short-Term Stock Traders
Gate is expanding Event Contracts beyond crypto with a first batch of four stock assets: MU, SNDK, SK hynix, and Unitree Robotics.
What makes this interesting to me is the structure. You don't need to hold the underlying stock or use leverage or margin. Instead, the focus is purely on the short-term direction of price.
The contracts introduce 5-minute and 15-minute Up/Down trading, which creates a completely different style of market participation. You are not trying to predict whe
MrFlower_XingChen
#GateGloballyLaunchesStockEventContracts
Gate Event Contracts Just Changed the Game for Short-Term Stock Traders
Gate is expanding Event Contracts beyond crypto with a first batch of four stock assets: MU, SNDK, SK hynix, and Unitree Robotics.
What makes this interesting to me is the structure. You don't need to hold the underlying stock or use leverage or margin. Instead, the focus is purely on the short-term direction of price.
The contracts introduce 5-minute and 15-minute Up/Down trading, which creates a completely different style of market participation. You are not trying to predict where a stock will be next month. You are making a defined short-cycle view on whether price moves up or down before expiry.
The U.S. stock selection is particularly interesting because MU and SNDK can be traded across pre-market, regular hours, and after-hours. That gives traders more opportunities to react to short-term momentum, volatility and market-moving developments.
My approach would be simple: don't treat a 5-minute contract like a lottery ticket.
Before taking an Up or Down position, I would check the immediate trend, volume, recent high/low, support and resistance, and whether the move is actually gaining momentum. If the setup becomes invalid, the ability to close early and manage take-profit or stop-loss levels independently becomes an important part of the strategy.
The same Event Contracts concept is also available for BTC, ETH, SOL, XRP, DOGE, HYPE and BNB, so traders can apply the same short-term directional framework across both stocks and crypto.
For me, the biggest attraction is the defined structure: choose a direction, set a short time horizon, manage the position, and let the market decide the outcome.
But the short timeframe is also the biggest risk. A 5-minute market can move against you very quickly, so I would keep position size controlled and avoid entering simply because a candle is moving fast.
Short-term trading isn't about predicting every candle. It's about having a clear setup, a defined risk, and the discipline to walk away when the setup isn't there.
Available through Gate → Futures → Event Contracts → Stocks.
Event Contracts are high-risk derivatives; read the rules carefully before participating.
#GateMeme #GateTrenchesZeroGas #GateLaunchesTrenchesWith0GasFee #AppleEvent @GateSquare @Gate_Square
repost-content-media
BTC CRASH
live-replay-cover
557 views09-10 13:17
00:54:23
GOLD BTC
live-replay-cover
909 views09-10 02:02
02:33:43