
Share your thoughts
placeholder
Article
#GateIdleEarnAutoYieldUpTo3% Gate Idle Earn: Put Your Idle Assets to Work with Auto Yield Up to 3%
In crypto, simply holding assets doesn’t have to mean leaving them completely idle. Gate Idle Earn is designed to give users a more convenient way to potentially earn yield on eligible idle assets, with auto yield of up to 3%.
What makes Idle Earn interesting?
The biggest advantage is convenience. Instead of constantly searching for different earning opportunities or manually moving funds between products, Idle Earn aims to make the process more automated. This can be especially useful for user
post-image
  • 1
I only meant to mooch a breakfast, but the market ended up wrapping me in dumplings for half a year.

When the sell-off hit at the open, the whole screen was panic, but I kept my eyes on that low-volume rebound. The weak bounce was one thing, but the sell orders above were pressing down hard— not shorting it would have been a waste of the setup. I entered the short around 0.001152, set my stop-loss, and stopped paying attention.

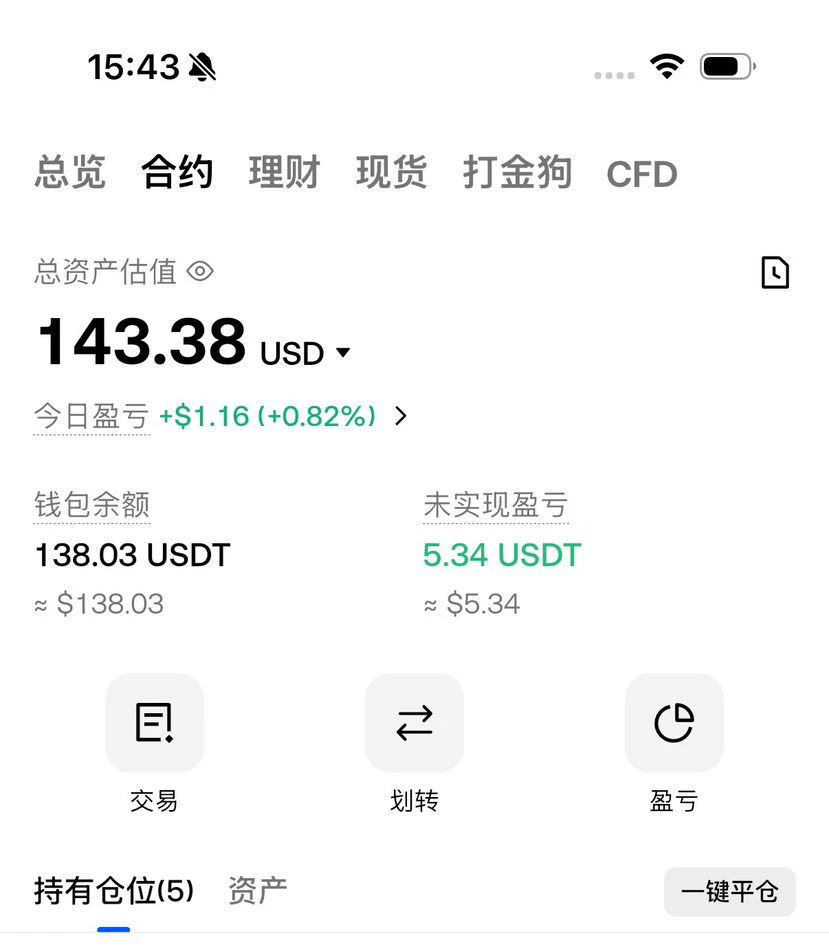
When I came back just now, the current price had already fallen to 0.000718, with unrealized profit at +921.69%. The market gave us the answer—this short was timed
post-image
ADA+0.95%
ETH-0.01%
Smart money is already positioned long $ETH /USDT while retail still hesitates.

$ETH /USDT - LONG

Trade Plan:
Entry: 2493.96 – 2500.94
SL: 2463.91
TP1: 2522.61
TP2: 2539.38
TP3: 2564.53

Why this setup?
Why now? The 1d trend is firmly bullish and the 4h setup gives a 95% confidence read. The 1h RSI at 57.26 shows room to run before overbought, while the 1h ATR of 13.98 tells us volatility is active enough for a clean move. The entry zone sits between 2493.96 and 2500.94, with the exact entry reference at 2497.45 anchoring the position. Targets are stacked at 2522.61 and 2539.38, giving th
ETH-0.01%
Bulls are performing strongly, with the first target in place.
#Gate上线打金狗限时免Gas费 $BTC $ETH $XAU
BTC-0.66%
ETH-0.01%
XAU+0.44%
9/7/BTC‖Prince's strategy‖
Current price is around 79290. After probing the bottom, a recovery rebound has begun, with the price moving above the Bollinger middle band and short-term bullish momentum picking up.
- Overhead resistance: 79800‑80000, the previous high resistance level. Holding above this range would further open up room for a rebound.
​- Downside support: 78750, the Bollinger middle band and today's short-term bull-bear dividing line; holding it would allow the rebound to continue, while breaking below it would bring a return to a weakening range.
Today's price action assessm
post-image
BTC-0.68%
An In-Depth Analysis of BTC’s Short-Term Trend from Dow Theory, Chan Theory, Elliott Wave Theory, Volume-Price Relationships, Order Flow, and Price Action
I. Dow Theory
Primary trend (1-hour timeframe): The primary downtrend since the May 6 all-time high of 82,814 confirmed a trend reversal in mid-August. The price began a strong rebound from the August 14 low of 62,488. After forming a secondary bottom at 63,979 at 03:00 on August 18, the bulls launched an epic rally. The price surged from 63,979 to the August 28 high of 81,346.95, a new stage high, for a cumulative gain of 17,368 (approximat
BTC-0.68%
Precise short entries and profits secured! Stay decisive on the rebound! BTC and ETH outlook for 9.8
The short strategy given yesterday was validated again. Following along, you could easily pocket around a thousand points on BTC and 40–50 points on ETH. There are profits to be made again! Those already in should set a profit-locking stop-loss, while those not in can continue waiting to short the rebound!
The daily chart is still consolidating at elevated levels. The KDJ indicator shows a high-level death cross on all three lines, while MACD also shows a death cross on both lines, with trading
ETH-0.01%
BTC-0.66%
  • 1
$XLM /USDT is about to break range and nobody sees it coming.

$XLM /USDT - SHORT

Trade Plan:
Entry: 0.19249 – 0.19385
SL: 0.19972
TP1: 0.18826
TP2: 0.18498
TP3: 0.18007

Why this setup?
Why now? The daily trend is range, but the 1h price is sitting at 0.19316, the 15m RSI is 52.99, and the 1h ATR is 0.00273, which means the tape is quiet enough for a sharp move once it starts. The entry zone between 0.19249 and 0.19385 aligns perfectly with the 1h level, giving a precise trigger for the short bias. TP1 at 0.18826 and TP2 at 0.18498 offer stacked targets that fit the range structure, while
XLM+3.72%
I originally only wanted to mooch a free breakfast, but the market ended up wrapping me in dumplings for half a year🥟. A few days ago, in the early morning, $BTC /BTC was still grinding around that level, while buying pressure was quietly strengthening. I went straight long without hesitation.

Now the bullish thesis has played out crystal clear, with the price climbing from 78760.0 all the way to 79267, locking in +109.61%. Feeling great, brothers—the harder it grinds beforehand, the more satisfying the breakout.

Taking 75% off first, and placing a cost-basis protection order for the remai
post-image
BTC-0.66%
BNB-0.98%
XRP-0.10%
The core battleground for September is around 77500; the market sees a higher likelihood of a downward retest of that level, while confidence in continuing to rally to 82500 has waned; an actual drop to 75000 is considered a moderately low-probability scenario and is not widely bet on by the market.
post-image
codex is about to reset. Immediately stop your fast unsupervised long-running tasks to prevent your normal quota from being cleared after the reset.
post-image
Crypto Market and Trading Insights
live-cover
LIVE1,543
#PONSDropsOver15% PONS has dropped over 15 percent in the past 24 hours, trading near 0.75 dollars after briefly challenging levels close to 0.97 dollars just days earlier. Market capitalization slipped from nearly 1 billion dollars back toward the 500 to 600 million dollar range while daily volume stayed elevated above 150 million dollars. This pullback follows an extraordinary run that saw the token climb more than 20,000 percent from its July low near 0.0038 dollars.
The move looks like classic profit-taking after extreme overbought conditions. From early September the price advanced roughl
post-image
PONS-2.86%
  • 2
A Brief Analysis of BTC Short-Term Trends from Dow Theory, Chan Theory, Elliott Wave Theory, Volume-Price Relationships, Order Flow, and Price Action (Strategy Recommendations)
Comprehensive Assessment
Dow Theory confirms that the primary trend remains strongly bullish, but the high-volume decline on September 7 broke the consolidation pattern since September 4. Breaking below the 79,000 round-number level is an important bearish signal, and the short-term trend has shifted from bullish to bearish.
Chan Theory shows that the downward stroke from 82,262 had extremely strong momentum (-6,014), w
BTC-0.68%
Most traders will ignore this UNI setup until it is already too late.

$UNI /USDT - LONG

Trade Plan:
Entry: 7.04 – 7.10
SL: 6.77
TP1: 7.30
TP2: 7.45
TP3: 7.67

Why this setup?
Why now? The daily trend is bullish, and the 1h price is holding at 7.07, which is the exact entry reference for the long. The 15m RSI sits at 64.37, showing room to run before overbought exhaustion. The 1h ATR of 0.125289 confirms the current volatility is tight enough for a clean breakout toward the targets. The entry zone between 7.04 and 7.10 aligns with that 1h price, giving a precise risk-defined zone. The firs
UNI+1.07%
Ethereum ETH (1-hour period)

The current chart is converging in a rising wedge, with the breakout window approaching and price nearing previous resistance. The bias is toward a downside break. Wedge upper-bound resistance: 2523
Wedge lower-bound key support: 2472
If 2472 breaks, the wedge will break down, triggering a short-term pullback, with initial targets at 2420 and 2370

A sustained move above 2523 would break through the wedge’s upper boundary and challenge the previous high at 2566 again, opening up further upside.

Short-term trading strategy

The 2515-2523 resistance zone can be
ETH-0.06%
BTC-0.68%
Today's ETH Morning Outlook
Operation:
Short around 2510-2530
First target: 2490-2460
Second target: 2430-2400
Set a stop-loss
ETH has reached the upper-band resistance level, with RSI nearing overbought territory and insufficient short-term upside momentum. Although the red bars remain, their strength is limited, and the longer price consolidates at high levels, the more unfavorable it is for bulls. Subjectively, if it fails to break through effectively, downside pressure will gradually build. Wait for a clear weakening signal before cautiously entering a small short position; do not sell at
post-image
ETH-0.01%
The drop came quickly, but I did not rush in on the first bearish candle. The biggest risk when shorting is chasing near a short-term low, as even a random rebound can easily trigger the stop-loss; without a second breakdown afterward, it is difficult to hold the short position.
So after the price finished its first leg down and rebounded to the lower edge of the previous breakdown platform, the four-hour candle formed a long upper wick, indicating that funds were actively exiting above. Entering at this point was much more comfortable than chasing the first bearish candle.
Partially closing t
post-image
BNB-0.98%
DOGE+1.32%
$1000 to $100,000 Crypto Trade Challenge Today
live-cover
LIVE1,604
$$UAI The data looks off: the 24-hour amplitude is 47%, and trading volume reached $209 million, but the price is stuck at 0.7281, unable to move up or down. The high of 0.7597 was slammed back three times. This is not an ordinary pump—it looks like someone is executing precise price control.
First, the unusual points: the 24-hour low of 0.5152 to the high of 0.7597 means it went from hell to heaven and back to the middle of the mountain, yet trading volume did not explode and instead remained steady. If retail traders were really FOMO-chasing the price, there should have been massive volume a
UAI+16.84%
Load More

Join 40 M users in our growing community

⚡️ Join 40 M users in the crypto craze discussion

💬 Engage with your favorite top creators

👍 See what interests you