
Square
Following
Hot
News
Notifications
Profile
Share your thoughts
placeholder
Article
btc updates
live-cover
LIVE1,058
BTC-0.67%
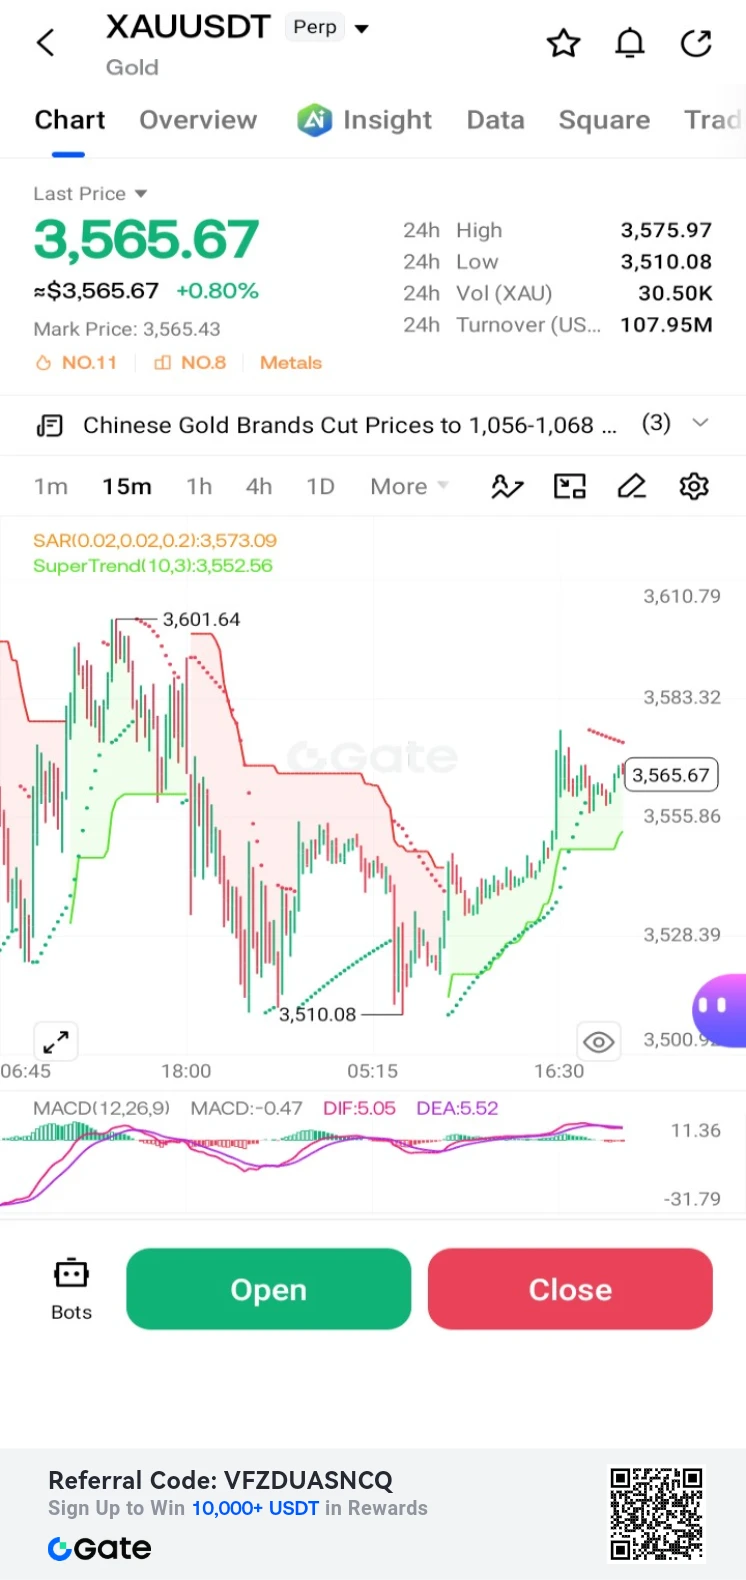
$XAU /USDT Perp – "V-Shape Rebound – Long"**
Trading Plan Long $XAU
Entry: 3,565.67
SL: 3,552.56
TP1: 3,583.32
TP2: 3,601.64
Gold is up +0.80% after a sharp bounce from the 3,510.08 low. MACD is crossing bullish; targeting the 3,583.32 resistance.
post-image
XAU+0.38%
Trenches
PIEVERSE
P
bade
b
PIEVERSE
0x0e...25a9
Market Cap
$.
Change
.
24h Vol
$.
Holders
.
FIONA
F
bade
b
FIONA
B34n...pump
Market Cap
$.
Change
.
24h Vol
$.
Holders
.
IDOL
I
bade
b
IDOL
0x3b...ab07
Market Cap
$.
Change
.
24h Vol
$.
Holders
.
Singularity
S
bade
b
Singularity
7R4M...pump
Market Cap
$.
Change
.
24h Vol
$.
Holders
.
CLAUDIA
C
bade
b
CLAUDIA
2j5S...W2ZM
Market Cap
$.
Change
.
24h Vol
$.
Holders
.
$NVDA This stretch of the move was “leaking” down, not “getting dumped”: it opened a notch lower and closed another notch lower, with not a single bearish candle worth screenshotting for over ten hours. A dump comes with emotion and rebounds; a leak has no emotion and just inches down one tick at a time. Three rebounds, each lower than the last; the second was only half the first. The layer of sell orders overhead went from a wall to a sheet of paper. The bands are tightening. But for individual stock tokens, tightening is an after-hours effect, not structure—so the only real evidence is that
NVDA-13.84%
  • 1
#GateDirectIPOPhase3ANTAllocates92100Shares #ShareWeekly

ANT After the IPO: $200 Billion in Unlocked Liquidity, Massive Share Supply, and What Comes Next?

The end of the $ANT IPO trading period marks the beginning of a much more complicated phase for the market. While the listing attracted enormous attention and generated significant trading activity, the more important question now is not simply how high or low ANT can trade. It is how much liquidity has been released, how much additional supply is approaching, and whether institutional demand can absorb the selling pressure over the comin
post-image
ANT-8.68%
MSCI-2.28%
CRSP+0.82%
MORN-0.38%
NAS100-0.07%
#BTC bitcoin:native
One possibility ...!
post-image
BTC-0.67%
Quickly go short on $PIEVERSE , entering with a sell at 3.4000 or 3.5000. First target: 3.2000; second target: 3.1000; third target: 3.00; final target: 2.9000++. Severely overbought conditions have emerged, and everyone is piling in to short aggressively. RSI has reached 91%
post-image
PIEVERSE+0.58%
#GateRWA永续合约增长领跑行业
NVDA has fallen below $130. One might have expected capital flowing out of the artificial intelligence sector to shift into cryptocurrencies, yet Bitcoin is also declining. Nevertheless, I believe these are the final drops. We will see a very sharp rebound from Bitcoin and altcoins backed by blockchain technology $LUNC will be among them. As for the rest, they will be weeded out... We should steer clear of cryptocurrencies that fail to generate any value.

#LUNC #TerraClassic #Bitcoin #FedMayNeedA50bpRateHike $BTC $LUNC ‌ ‌
post-image
NVDA-13.84%
BTC-0.67%
LUNC-2.74%
$BTC The starting point of this trade wasn’t a call on direction, but positioning. The moment 56,000 was swept through, what was stacked below were other people’s stop losses, not my thesis. I placed my order at the lower edge of the cluster and waited for the market to burn through the fuel itself.

Only after reclaiming the round-number level and retesting without breaking lower was the structure confirmed. Until then, it was just a resting order; after that, it became a trade. The difference matters more than direction.

I barely did anything in the middle. With a high-leverage position, th
BTC-0.65%
ETH-1.23%
SNDK-0.18%
  • 2
[New Streamer] Market Prediction
live-cover
LIVE2,351
BTC-0.67%
Price and EMA20 are showing positive divergence, but the current volume ratio is low; although ATR% is slightly high, MACD remains bullish. $LTC — Long entry price: 40.07 Take-profit 1: 40.47 Take-profit 2: 40.87 Stop-loss: 38.47
post-image
LTC-0.07%
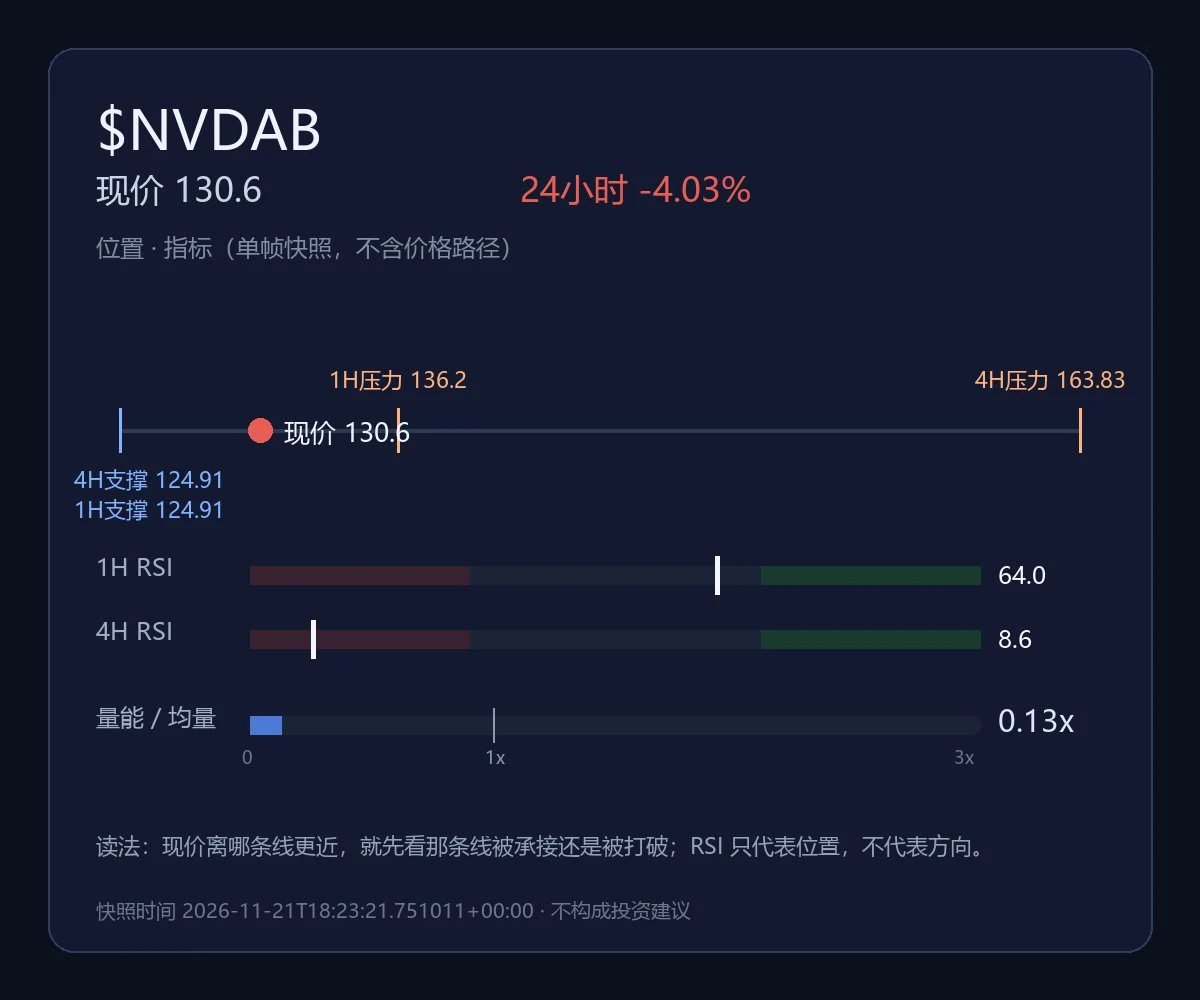
$NVDAB Has Entered Oversold Territory—Why Can’t We Say It Has Bottomed?

$NVDAB is currently trading at 130.6, down 4.027% over 24 hours, with an intraday range of 124.91‑136.77. The 1-hour and 4-hour trends are both considered weak, with the price trading below the 1-hour EMA20 at 130.74 and the 4-hour EMA20 at 139.79. The 1-hour RSI14 is 64, in neutral-to-bullish territory, while the 4-hour RSI14 is just 8.64, deeply oversold. The volume ratio is only 0.13, indicating extremely low recent trading activity. Support on both timeframes converges at 124.91. The price is hovering around that leve
post-image
aptos expands institutional support through bitgo, offering eligible clients custody, staking, and access to decibel’s onchain trading platform. bitgo has also taken a strategic position in $APT .

\#APTOS #INSTITUTIONAL $GATE
post-image
APT-1.51%
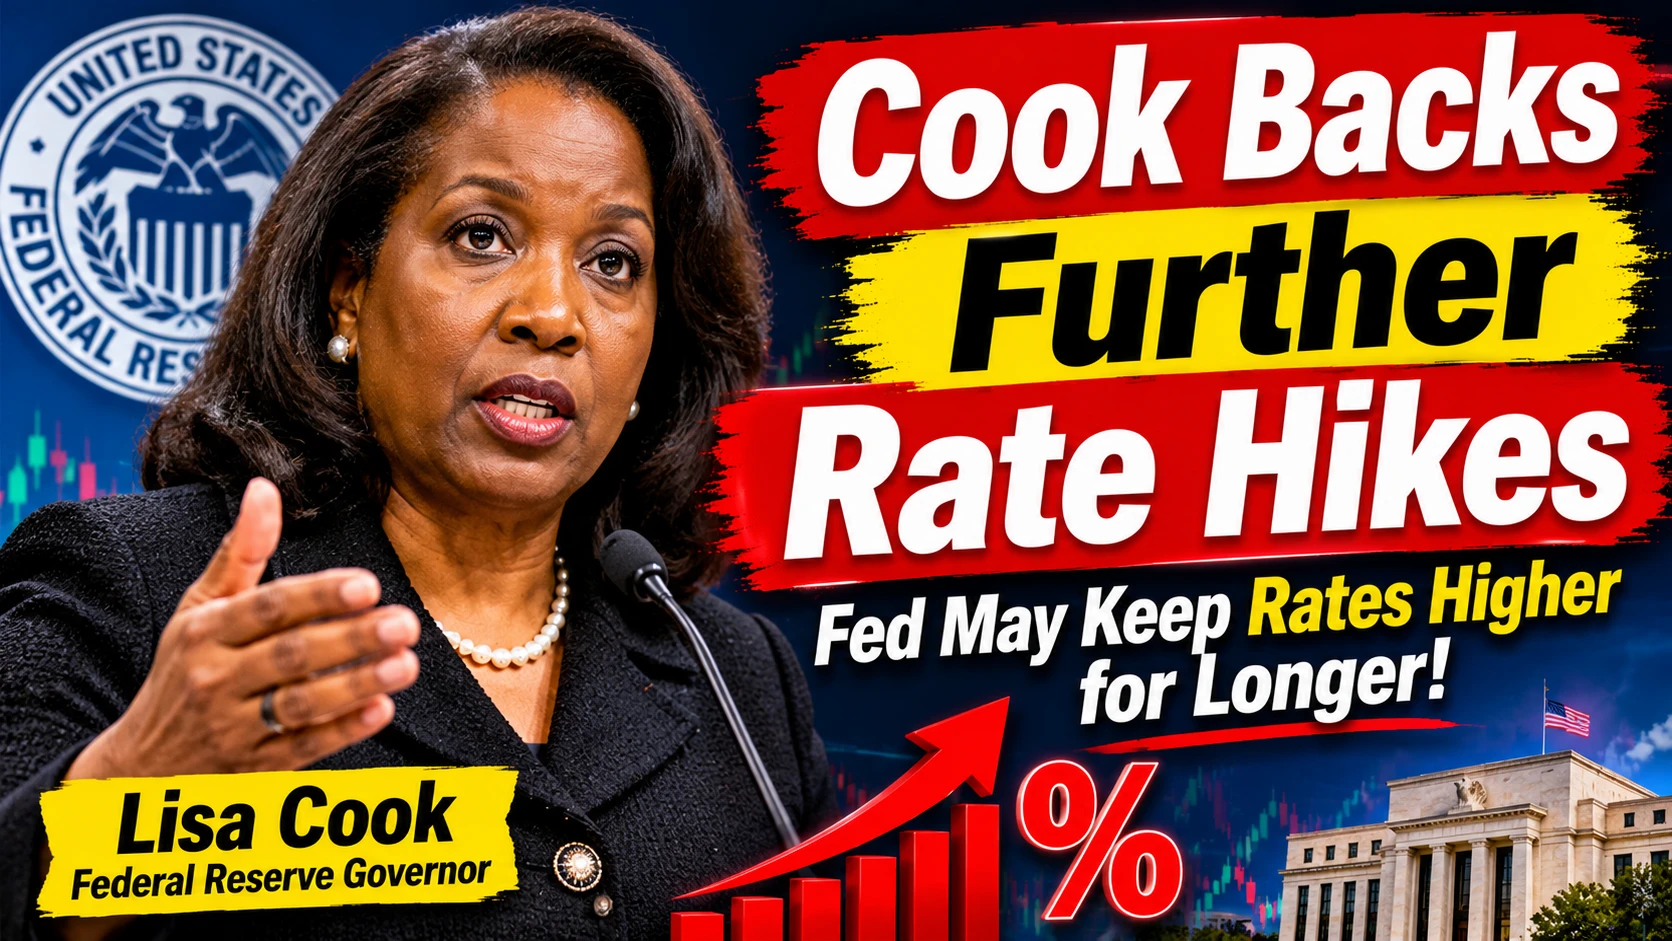
#CookBacksFurtherRateHikes

Federal Reserve Governor Lisa Cook is backing the possibility of further interest-rate hikes, adding another important signal to the ongoing debate over the future direction of U.S. monetary policy.

The prospect of additional rate increases could have major implications for financial markets. Higher rates generally mean tighter financial conditions, which can put pressure on risk assets, equities, technology stocks, and cryptocurrencies while increasing the attractiveness of interest-bearing assets.

For markets, the key issue is not simply whether another hike hap
post-image
BTC-0.67%
$TAO 186.4, up 5.97% over 24 hours. It spiked to 189.8 intraday and then pulled back. The 1h RSI at 74 shows severe short-term overextension, while volume has shrunk to 0.43x the average—this rally is purely a low-volume move. The 4h chart is marked as leaning bullish, but the RSI is only 40 and hasn’t picked up at all. The two timeframes are completely out of sync, which is hard to watch. For now, keep an eye on 189.8: it needs to hold above that level on strong volume before considering 200.8. If the pullback breaks below the 182 EMA, the short-term momentum is broken, so stay on the sidelin
post-image
TAO+0.41%
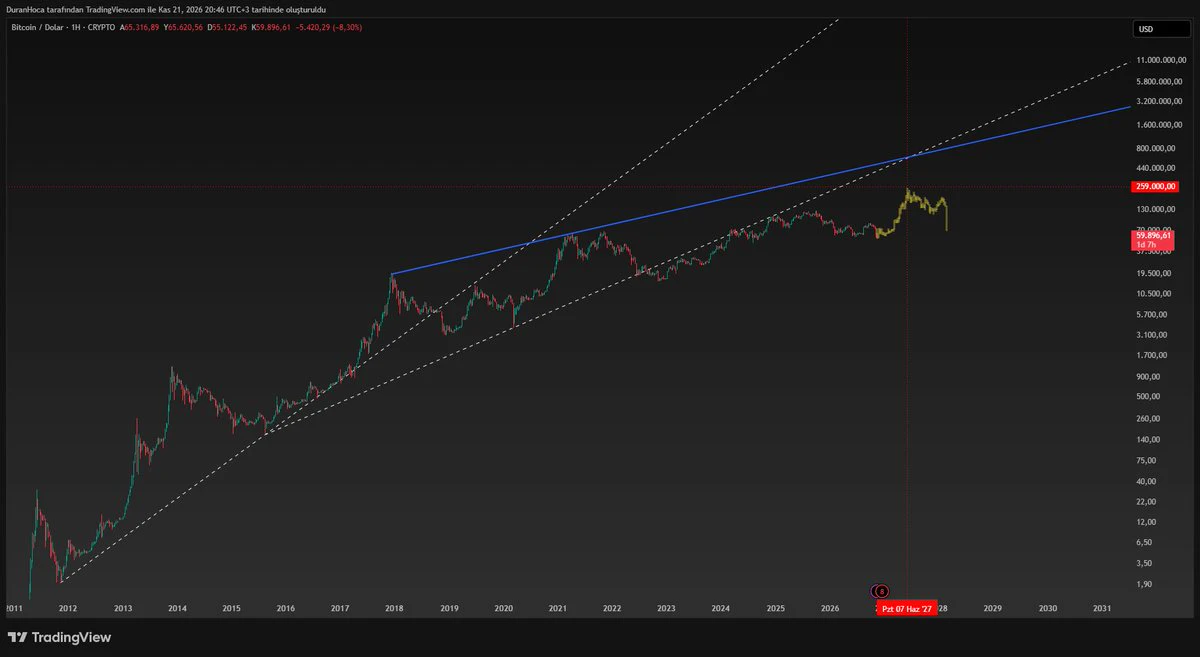
#BTCBreaksBelow60K

Bitcoin has once again entered a critical phase as BTC breaks below the $60,000 level, putting renewed pressure on the broader crypto market. The move below such a widely watched psychological and technical threshold is likely to attract significant attention from traders, investors, and market participants.

A break below $60K can signal that bearish momentum is strengthening, especially if Bitcoin remains below the level instead of quickly reclaiming it. Traders will now be watching price action closely to determine whether this is simply a temporary breakdown or the begi
post-image
BTC-0.65%
#BTC跌至9月以来新低 BTC Under Global Liquidity Withdrawal: After Falling Below the 200-Week Moving Average, Is $57.8k the Bottom or Just a Waystation?

The most painful thing about this decline is not how far prices have fallen, but that it offers no chance to catch your breath. U.S. stocks, gold, silver, copper, and crypto assets have almost all fallen. From November 19 to 20, spot gold briefly dropped to around $3,525 per ounce, its lowest level since September 2025, bringing its cumulative decline this quarter to about 15%; silver fell to $41.25, platinum to $1,299, and LME copper lost nearly 9% f
NVDA-13.84%
🚀 $PIEVERSE Bullish strategy – bulls regain momentum after the pullback… Long entry: 3.300 – 3.350 Take-profit 1: 3.400 Take-profit 2: 3.500 Final take-profit 3: 4.000 Stop-loss: 2.90 Leverage: 10x – 20x Margin: 1% – 3% Risk warning: If take-profit 1 is reached, take partial profits and move the stop-loss to the entry price to protect your principal. Trade here on $PIEVERSE … 👇
post-image
PIEVERSE+0.58%
$SOL and $UNI long positions hit full TP1—the entire move played out as planned. All profits locked in. Another successful trade closed. 👇
post-image
SOL-0.77%
UNI+3.05%
Load More

Join 40 M users in our growing community

⚡️ Join 40 M users in the crypto craze discussion

💬 Engage with your favorite top creators

👍 See what interests you

Trending Topics

BTCBreaksBelow60K

2.1M Views29.9K Discussing

BTC fell below $60,000 on November 20 for the first time since July, alongside a tech stock selloff and broader pressure on risk assets. Will $60K become resistance, or can BTC quickly reclaim it? What price or volume signals would convince you that selling pressure is easing?

GateDirectIPOPhase3ANTAllocates92100Shares

782.8K Views4.9K Discussing

NvidiaDropsNearly14Percent

328K Views7.6K Discussing

View More