





Square
Following
Hot
News
Profile
Share your thoughts
placeholder
Article
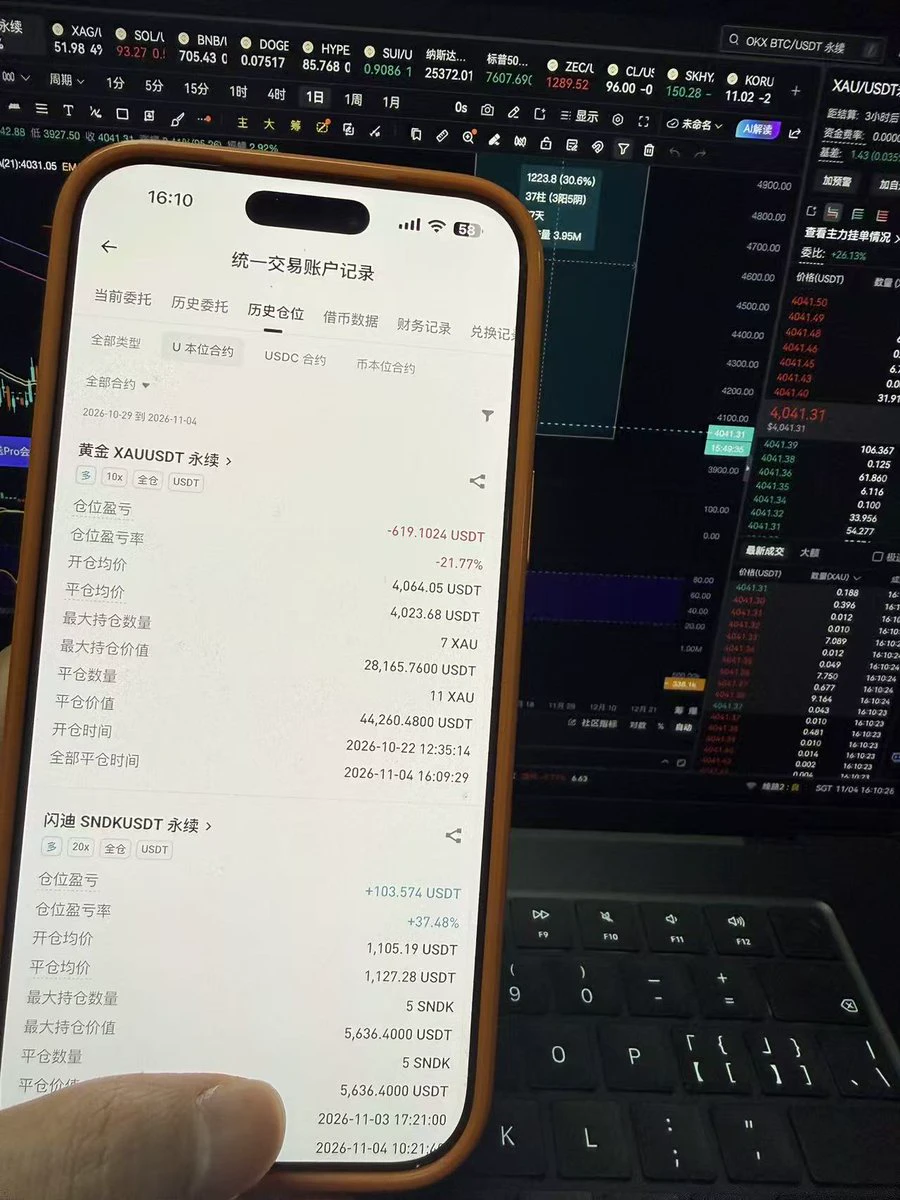
The market was generally bullish this morning, but our short position still gave us nearly $40 of room!
$XAU $SOL #黄金 #BTC打破历届中期选举前看跌走势
XAU+0.38%
SOL-0.74%
I couldn’t hold on to gold any longer and closed this trade at a $600 loss.
That’s what buying the dip is like—it really tests a trader’s mindset. Until your account turns a profit, the market will keep wearing down the conviction you had when you first entered the trade.
I don’t have the energy to hold right now, and the sudden rally caught me off guard. I just want to protect my principal for now. I’ll try again if another good opportunity comes along.
post-image
GLDX-0.40%
PAXG+0.37%
Trenches
ZIG
Z
bade
b
ZIG
0x8c...1145
Market Cap
$.
Change
.
24h Vol
$.
Holders
.
AMD
A
bade
b
AMD
DDmG...pump
Market Cap
$.
Change
.
24h Vol
$.
Holders
.
STONK
S
bade
b
STONK
6GmA...UNgx
Market Cap
$.
Change
.
24h Vol
$.
Holders
.
BTC
B
bade
b
BTC
C5xp...pump
Market Cap
$.
Change
.
24h Vol
$.
Holders
.
AGT
A
bade
b
AGT
0x5d...e274
Market Cap
$.
Change
.
24h Vol
$.
Holders
.
$ETH | Live Trade Review: Successfully Captured a 40-Point Move
Market volatility has increased recently and the pace has been fast. Sometimes there isn't enough time to prepare public strategies right away, so live trading signals will be shared first.
This time, we opened a long position in ETH near 2286 and ultimately took profit at 2246, capturing a 40-point move.
Public analysis is inevitably subject to some delay due to its release time, but trade execution depends more on timing and discipline.
If you missed it, there's no need to rush. There are always opportunities in the market. Kee
post-image
ETH-1.26%
A roadmap should not be just a promise; it should leave verifiable traces. 🌍
Yesterday, we discussed why ONEA chose long-term planning. At the same time, the community raised a very important question:
If a journey is planned to last for years, how can everyone know during that time whether the project has truly made meaningful progress?
Next, we should discuss this question seriously.
A roadmap can tell everyone where a project hopes to go. But a roadmap alone cannot prove that it is moving in the right direction.
True confidence comes from examining what has already happened, staying inform
post-image
The big move is really coming!!!
November 4, 2026
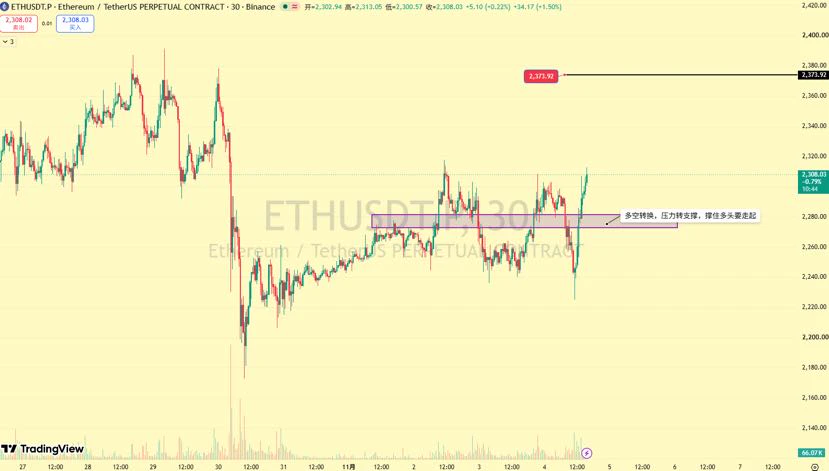
The election results are in, and uncertainty is behind us. A sharp wick was followed by a rebound; I believe BTC at 75k was a short-term bottom, and the rebound is now underway. Same goes for ETH.
1. Positions / Intraday Plan
$ETH Intraday today: Continue to favor buying dips
Long|Hourly breakout in the 2270-80 range, with resistance turning into support; go long on a retest
Short|Two levels: 2342 and 2374. Short-term trade at 2342; watch the charts for a quick short. Focus on a short if price stalls at 2374.
I'll say it again: the big move is
post-image
ETH+1.95%
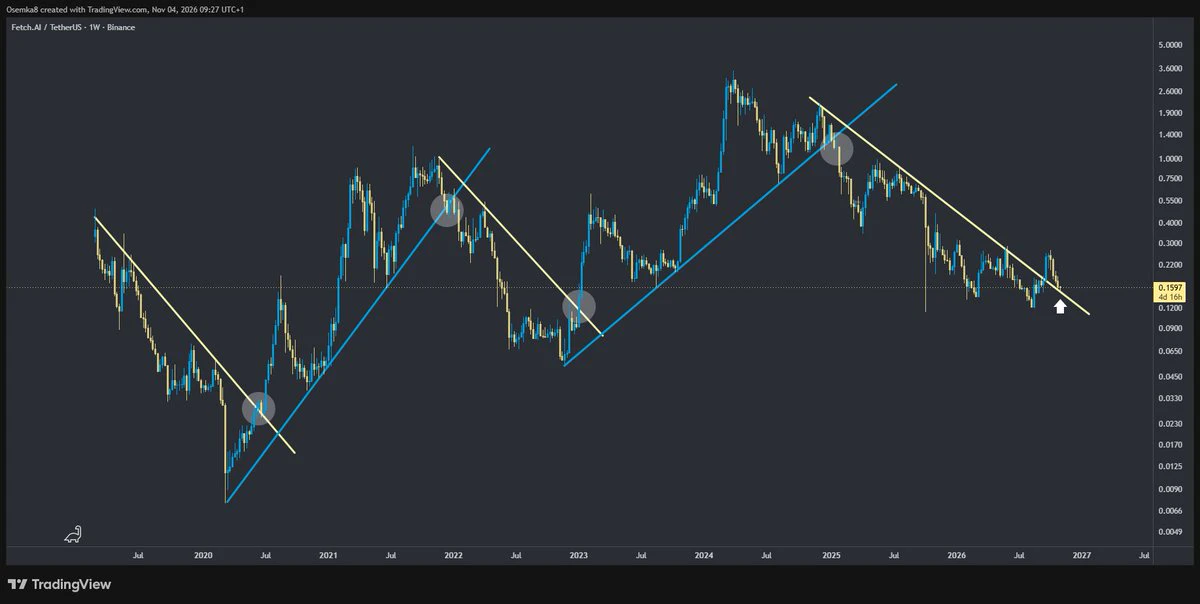
$FET loves diagonals
Retest in progress
post-image
FET-1.52%
11.4BTC
There’s no need to say much about my track record!
The first image shows the follow-up price movement forecast I gave last night, and the next one shows the price action around noon today.
It was basically spot-on, except the drop happened at a slightly different time.
Actually, by noon, I’d already seen Bitcoin at 73,000.
But!! I really didn’t expect such a reversal!
BTC-0.67%
Bullish on $APT
, preparing to enter a long position.
My trading plan is as follows: scale in between 0.6229 and 0.6268; the initial target is 0.6547, with further upside toward 0.6786; set the stop at 0.6042 and exit if it breaks below.
After a decisive V-shaped reversal, $APT is now consolidating above the support zone and building momentum. The pattern is holding up well, and I think it has a chance to make a direct push toward the 0.65 area.
One thing to watch: if support at 0.616 fails, the logic behind this V-shaped rebound will essentially be invalidated. Don’t stubbornly hold on then.
post-image
APT-1.51%
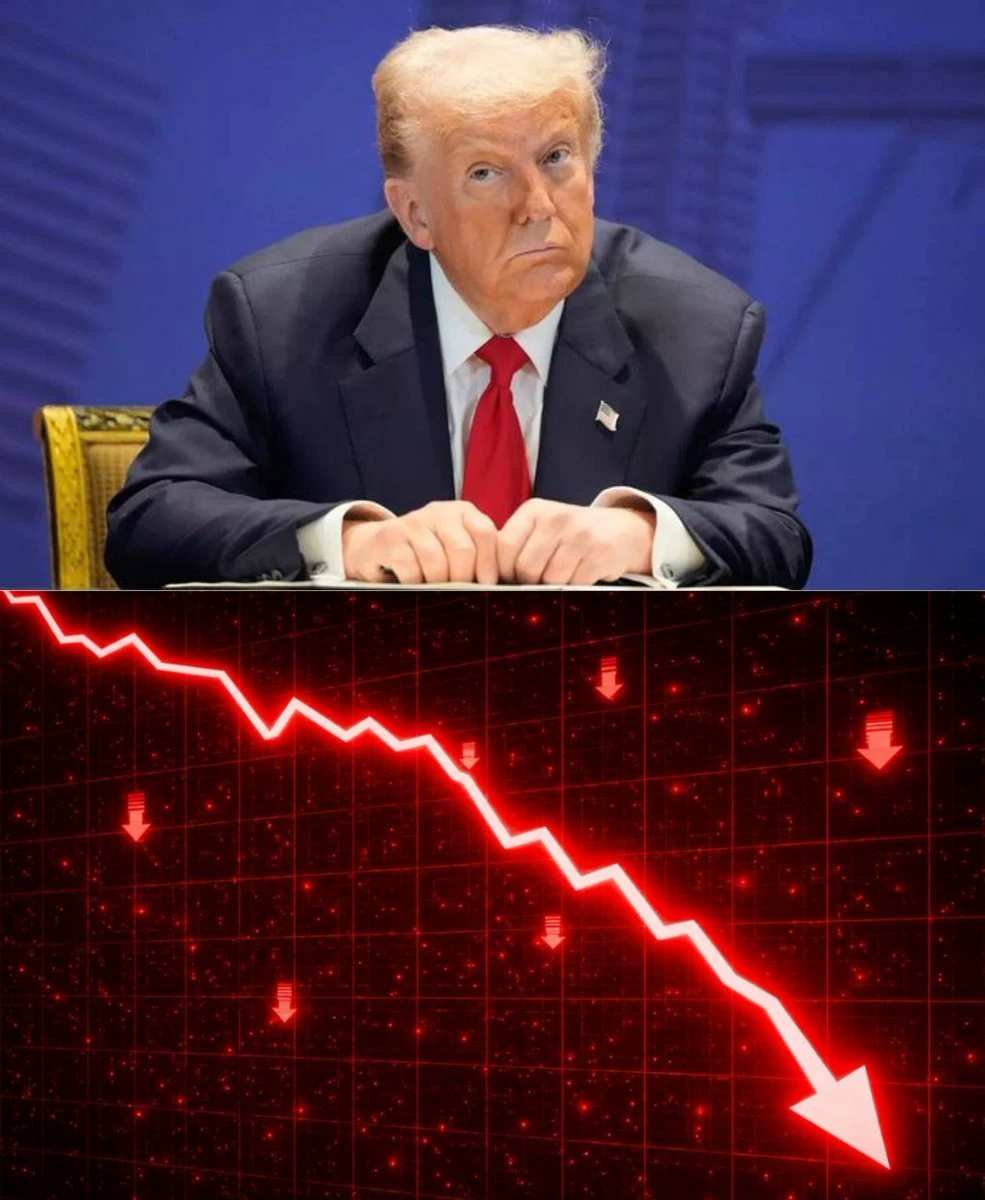
Democrats won.
Bearish for crypto but market is pumping hard right now for no reason, there is no reason for pump, I don't understand, democrats are anti crypto.
Forget clarity act, expecting crypto restrictions and taxes, unrealized gain tax 50% crypto taxes or shit like this Expecting USA to treat crypto just like EU.
If you think Republicans didn't do enough for crypto Democrats will do everything against it.
Crypto era ends.
post-image
Apple earnings beat expectations, but shares fall nearly 2! Strong results, yet no rally—what exactl
live-cover
LIVE2,597
$DOGE ‌
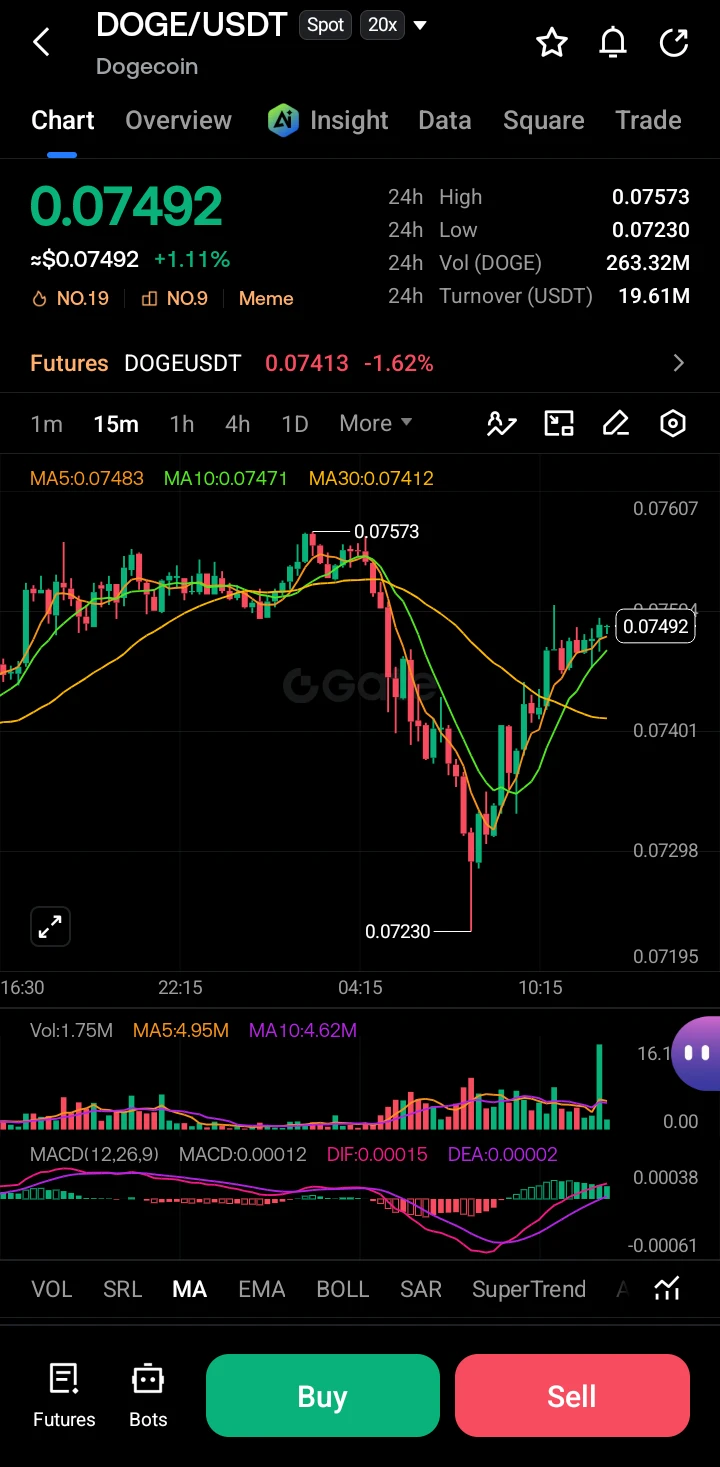
DOGE/USDT is currently trading at $0.07492, showing a +1.11% recovery on the spot market after a sharp sell-off. However, the futures market indicates bearish pressure, trading lower at $0.07413 (-1.62%). The market is in a short-term corrective bounce phase following a significant drop.
· Resistance: $0.07573 (24h high and recent local peak)
· Support: $0.07230 (24h low and recent swing bottom)
On the 15-minute timeframe, the price experienced a steep waterfall drop down to $0.07230. Since then, it has formed a V-shaped recovery, printing consecutive green candles. The price has succ
post-image
DOGE-0.22%
  • 8
  • 2
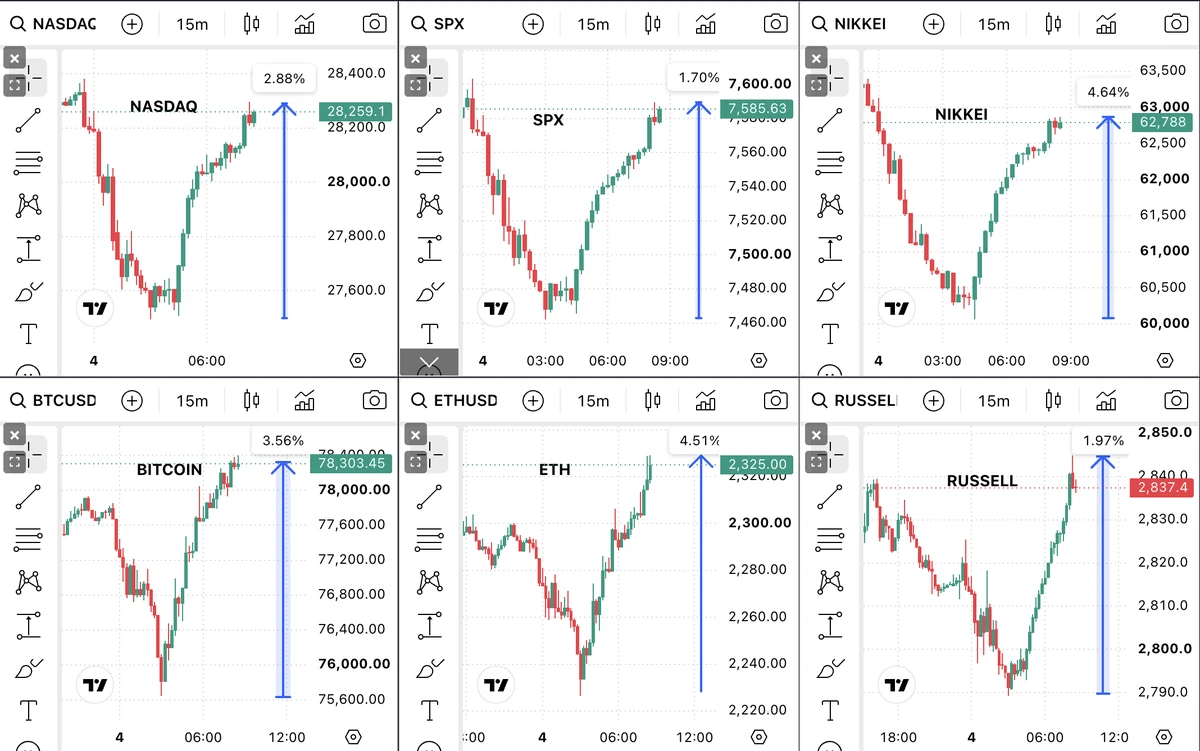
#Booom: Strong recovery across risk assets after the US midterm results.
- Nasdaq futures bounced 2.88% from the low.
- S&P 500 futures recovered 1.70%.
- Nikkei erased losses and bounced 4.64%.
- Russell is up 1.97% from the dip.
- Kospi Erased near 3.30% decline and closed with 0.64% gain
Near $1.3 trillion added in US futures since the day low.
$BTC is back above $78,000, up 3.56% from the low. $ETH is back near $2,325, up 4.51%.
Markets sold the uncertainty and bought the clear outcome. Democrats winning both chambers removed the biggest short-term risk.
post-image
SPX500+0.19%
BTC-0.67%
ETH-1.26%
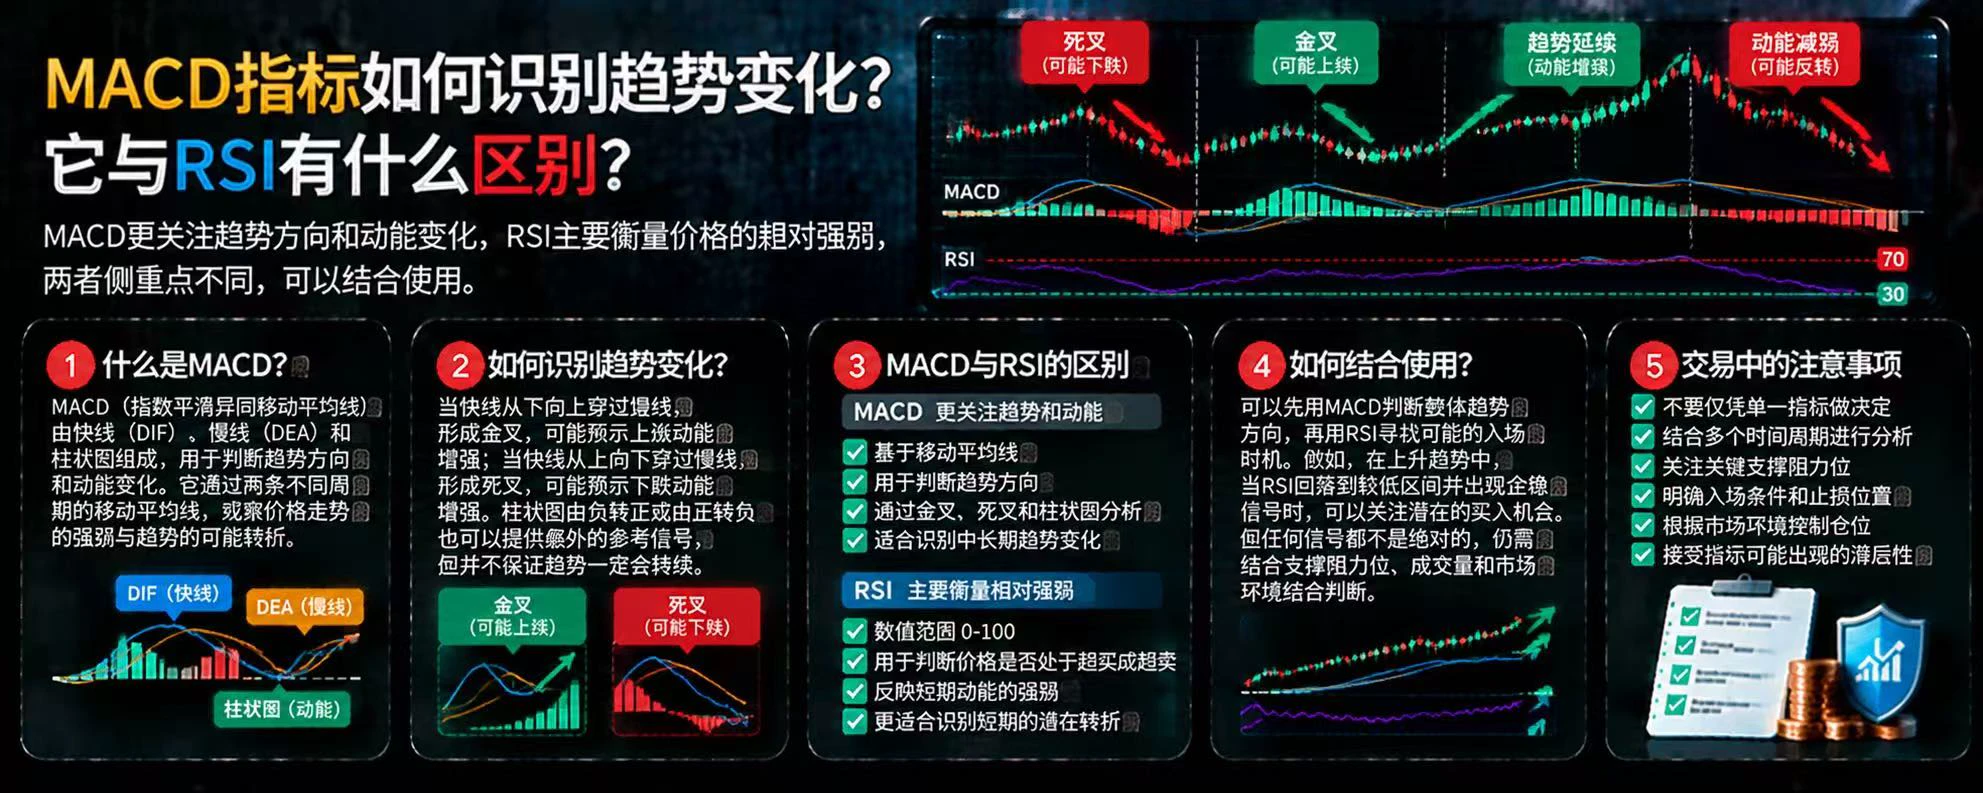
How Does the MACD Indicator Identify Trend Changes? How Is It Different from RSI?
In the crypto market, MACD and RSI are both common technical analysis tools, but they focus on different things. Understanding the difference between them can help traders get a more complete view of trends and price momentum, rather than relying on a single indicator to make decisions.
First, what is MACD?
MACD examines price trends and changes in momentum through the relationship between exponential moving averages over different periods. It typically consists of the DIF line, the DEA line, and a histogram, and
post-image
There's one thing I've never been able to figure out: why do hackers always like converting stolen crypto assets into ETH? $ETH
post-image
ETH-1.26%
Analysis crypto market
live-cover
LIVE2,032
$USELESS $USELESS This trade has had me stuck for so long. The other day, while I was out having fun, I saw it was almost back to breakeven. I didn’t expect it to rally again. It’s really hard to make even a little money off this damn market maker $USELESS
post-image
USELESS-14.68%
🔥 Calling all top lead traders! A 16,000 USDT prize pool + an extra 1% profit-sharing bonus awaits!
✅ Earn from leading trades, then double your rewards on the leaderboard! Climb to the top with your skills!
🥇 Copy Trading Volume Leaderboard: Top 10 finalists can win up to 1,000 USDT
👑 Popularity Champion: One winner takes 1,000 USDT + an extra 1% profit share
🚀 Growth Breakthrough: Top 5 in trading volume growth can win up to 1,500 USDT
👉 Sign up now: https://gate.onelink.me/7pdk/bd0979097f3763fd

CopyTrading
🔥 Calling all top lead traders! A 16,000 USDT prize pool + an extra 1% profit-sharing bonus awaits!
✅ Earn from leading trades, then double your rewards on the leaderboard! Climb to the top with your skills!
🥇 Copy Trading Volume Leaderboard: Top 10 finalists can win up to 1,000 USDT
👑 Popularity Champion: One winner takes 1,000 USDT + an extra 1% profit share
🚀 Growth Breakthrough: Top 5 in trading volume growth can win up to 1,500 USDT
👉 Sign up now: https://gate.onelink.me/7pdk/bd0979097f3763fd

repost-content-media
$HOT Short Trade Idea:
You can enter a short position directly around the current price of 0.0005310; I think there is considerable resistance at this level.
The first target is 0.0004710. Take profits in batches when it gets there. Set the stop at 0.0006000; if it breaks above that level, exit and accept the loss.
HOT has already surged +23.10%, and the rise has been a little too sharp. Be careful chasing longs; I favor betting on a pullback from higher levels.
⚠️ Risk warning: The above is only a personal trading record and does not constitute investment advice. Contract trading carries extr
post-image
$TSLA ‌ Bearish; potential for further decline. Resistance: 400–403. Support: 396, followed by 391–387. The MA5, MA10, and MA30 indicate selling pressure. The MACD remains in negative territory. Scenario: If the 396 level is breached, there is potential for a decline toward 391–387. If the price moves back above 403, there is a possibility of a rebound. Conclusion: TSLA remains bearish in the short term. Selling pressure continues to dominate as long as the price stays below the 400–403 range.
Note: Crypto and stock transactions carry the risk of loss. Please conduct your own research (DYOR)
post-image
TSLA-1.41%
Load More

Join 40 M users in our growing community

⚡️ Join 40 M users in the crypto craze discussion

💬 Engage with your favorite top creators

👍 See what interests you

Trending Topics

GateLaunchesTaiwanStockTrading

2.86k Views122 Discussing

Gate has launched Taiwan stock trading with 19 stocks available for direct $USDT trading, including TSMC (2330) and MediaTek (2454). From U.S. and Hong Kong stocks to Japan, Korea and now Taiwan, Gate is connecting users with more global traditional assets. Which Taiwan stock would you most want to access with $USDT — TSMC, MediaTek, or another AI supply-chain name?

DemocratsWinBothChambers

341 Views243 Discussing

ChipStocksRebound

4.79k Views2.93k Discussing

View More