Square
Following
Hot
News
Profile
Share your thoughts
placeholder
Article
Shill me the best #memecoin to hold before the next pump 🚀
post-image
MEME-4.46%
$BTC Bitcoin’s market rally is over; the altcoin bull market is here.
BTC-1.67%
ripple:native
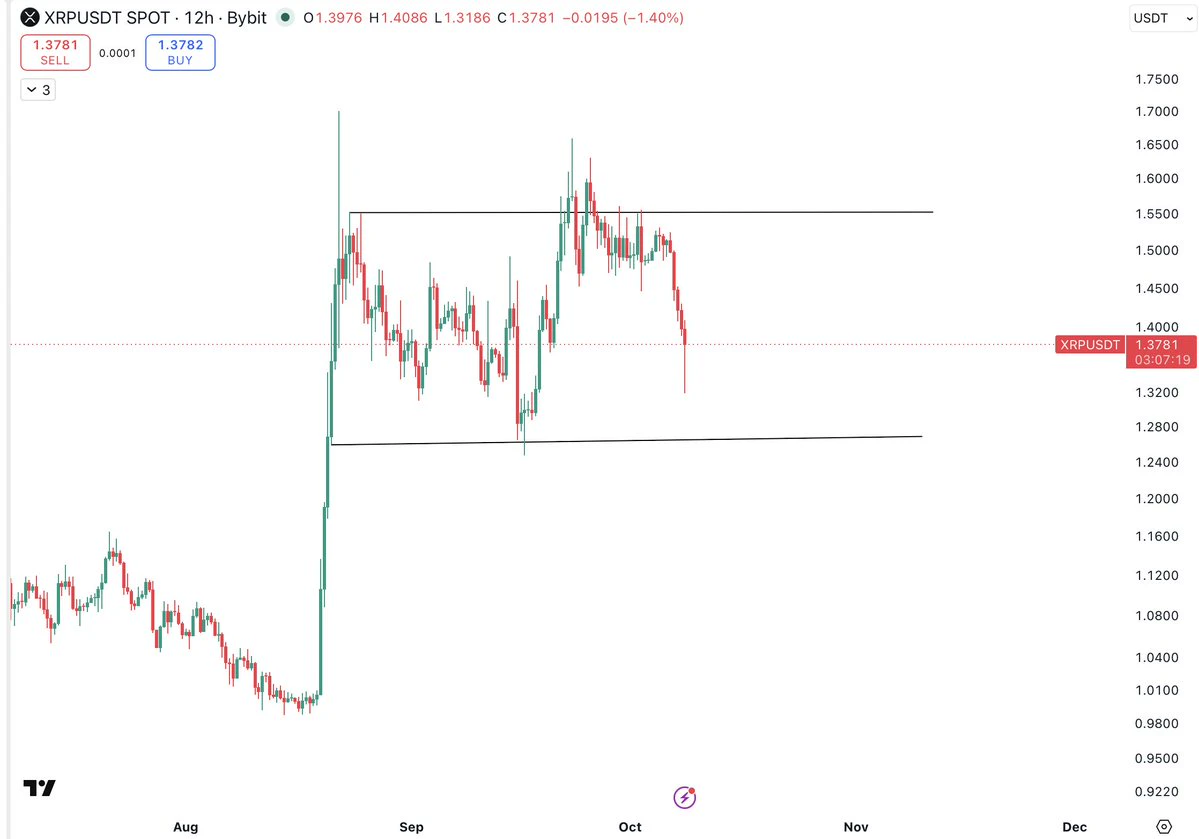
Will be interested in longs at bottom range.
Bounce here to take out late shorts, then steady decline to bottom range before bounce there.
post-image
crypto market update
live-cover
LIVE80
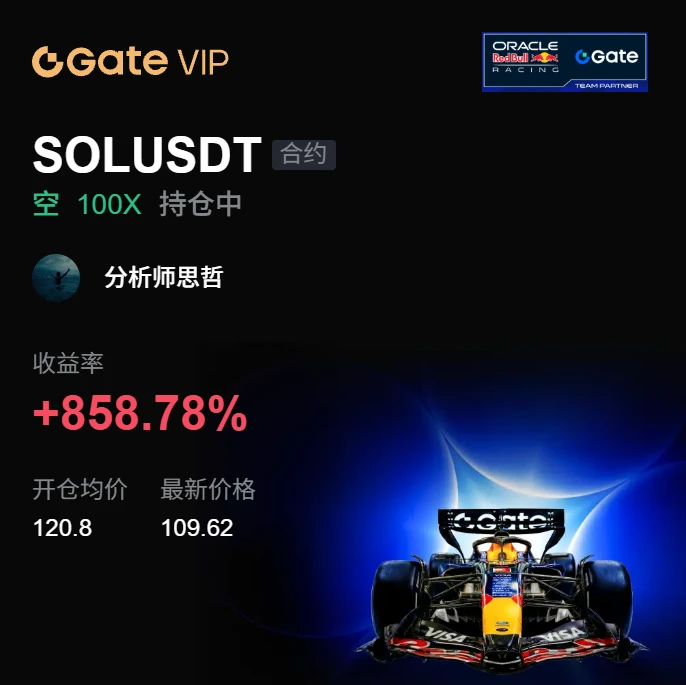
I didn’t do anything—just went to the restroom, and when I came back, that upper wick had already done the work for me. I opened the chart in the morning, and $SOL surged toward the previous high. Every push upward fell just short, with sell orders pressing it down hard, so I laid out my short plan around 120.80. At the time, I said just one thing: under pressure at the highs, volume hasn’t followed—don’t rush to catch a falling knife.

The result: from 120.80 to 109.61, this short trade delivered +860.32%. Those who were on board should have woken up laughing.

I’d rather miss a limit-up m
post-image
SOL-4.75%
ETH-3.69%
XRP-2.64%
What, you foreigners don't use this chat tool????
$US This pullback reminded me again: chasing highs feels good for a moment, but stop-losses keep you alive. Reviewing my recent positions, the lessons are worth more than the profits. #Gate.io 💎 #Gate广场中秋团圆局
US+21.55%
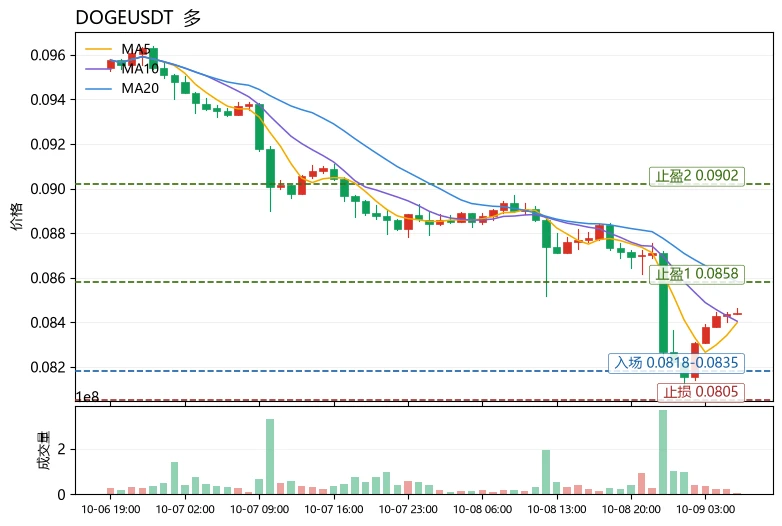
$DOGE Current price: 0.08442. In the short term, key support is the lower Bollinger Band at 0.08142, while resistance above is the MA20 at 0.08582.
Comparing with the mainstream coins in the same sector: $BN is quoted at 736.01, down 4.45% over 24h, with RSI falling to 33.0 and the MACD bearish bar at -1.48, showing more pronounced weakness; $DOGE is down 4.90%, but its RSI of 38.6 remains higher than BNB, while its funding rate of -0.0063% is the most negative among the three, indicating the highest level of short crowding—once sentiment recovers, it may instead have greater short-squeeze
post-image
DOGE-4.86%
BNB-4.46%
HYPE-3.93%
crypto market update sol
live-cover
LIVE12
Bitcoin's bottom range has been supported since the breakout on September 21, then failed again near 87k. Now let's see whether there is some relief... If this can hold, we will once again see some decent conditions. Is this a good rebound/recovery zone...? An accumulation range?? The best buying opportunity??$BT
post-image
BTC-1.67%
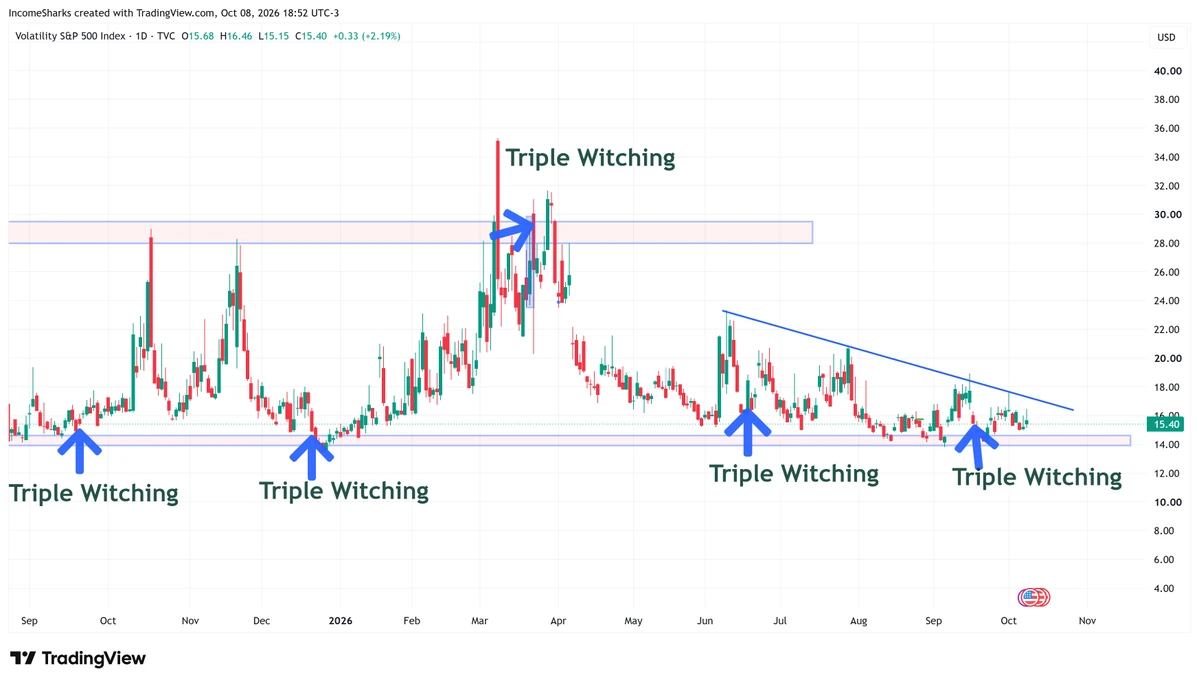
$VIX - The longest stretch in a while without any major spikes. Usually we bottom or top around triple witching, but lately the past few has remained in a range. Market either isn't scared of downside or is preparing for a big move.
post-image
Nailed it, added to my position, rolled over the position, and took profits while ahead
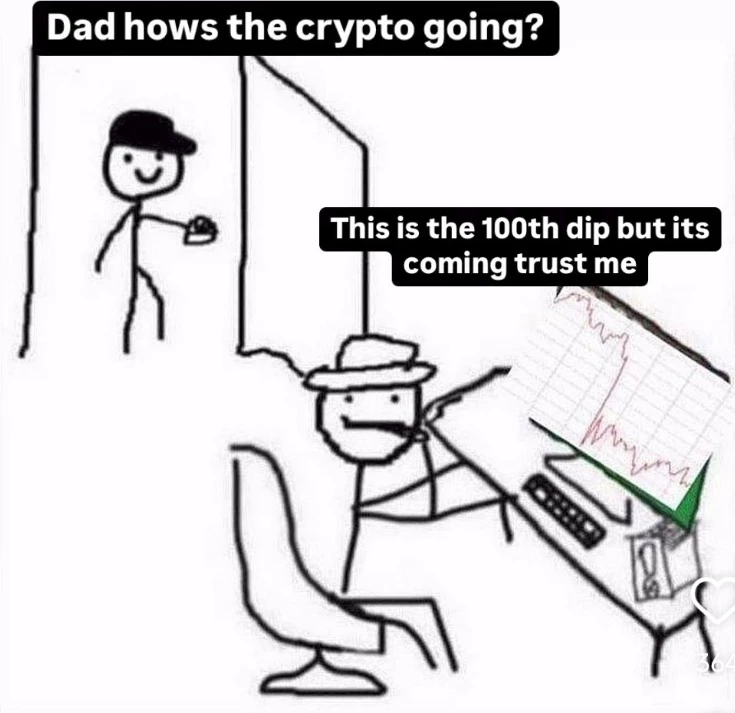
It’s coming trust me.
post-image
$BTC
BTC is grinding along the lower boundary again, and the structure looks a bit weak after being rejected above. A break below 82.7 would send it straight to 80.5; reclaiming 84.3 would be the time to talk about a rebound. Overall bias is bearish, so don't rush to catch the knife. Wait for it to show its own direction—even if your hands are itching to trade, you have to hold back 😏
post-image
BTC-1.67%
Curve backs the Ethereum upgrade, yet $CRV is down 6% in 24h: I’m bullish
$CRV is down 6% in 24h, but Curve spoke out last night in support of Ethereum’s Glamsterdam upgrade, which would expand blockspace and make complex transactions more reliable during congestion. The market didn’t buy it, with the price moving from 0.3401 to 0.3367 after the event. My stance is straightforward—I’m bullish at this level, looking to buy the dip against the trend in a defensive market.

Why am I bullish? First, 24h trading volume is 14139268 USDT, with a volume ratio of 2.892, suggesting buyers are absorbi
CRV-8.97%
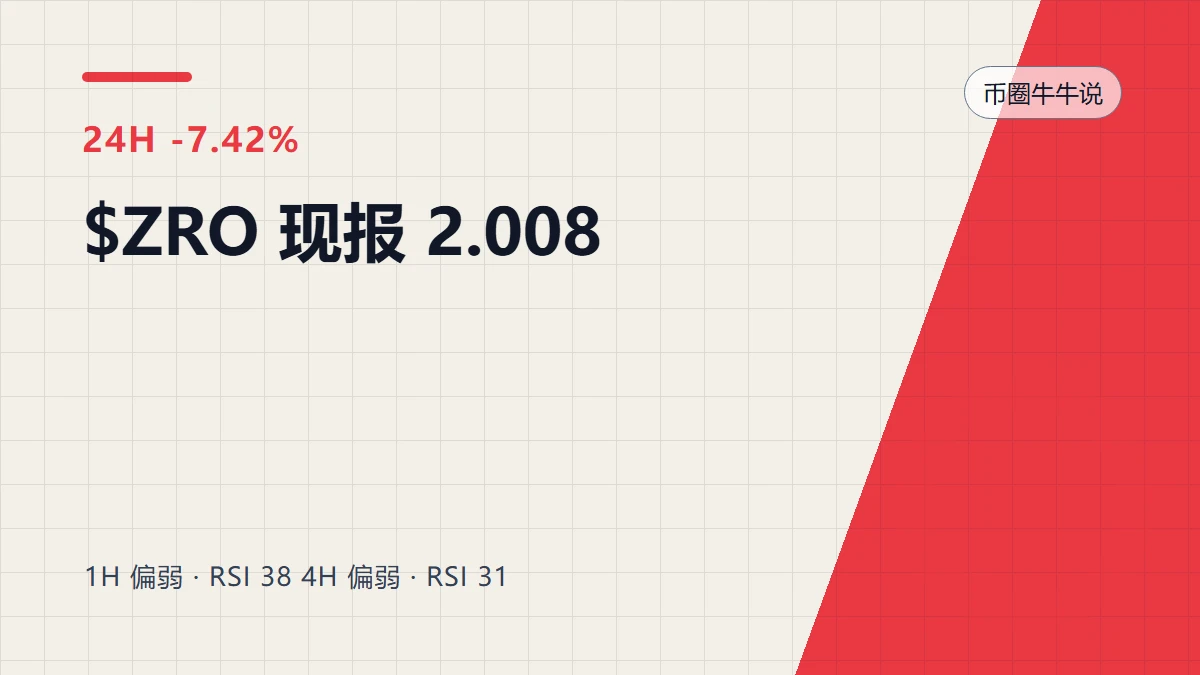
$ZRO ’s direction appears aligned, but its declining volume shows no commitment
$ZRO 24-hour change: -7.42%, current price 2.008. The 1-hour and 4-hour structures are both weak, yet current trading volume is only 0.12 times the average volume of the previous 20 candles. The direction is aligned, but participation has not caught up—this is the point most worth debating right now.
Set emotions aside; the structure provides very specific information. The 1-hour EMA20 is at 2.046, with the current price below it; the 4-hour EMA20 is at 2.079, also with the current price below it. Shorter time frame
post-image
ZRO-10.40%
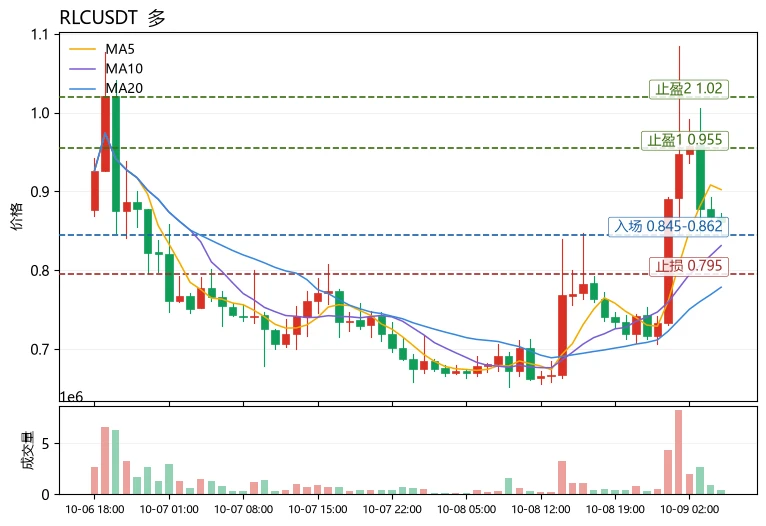
Many people chase after seeing a large bullish candle, and assume there is still room to rise when RSI has not crossed 70—this is a typical misreading of “strength” as “safety.” $RLC is in exactly this situation now.
Technically, $RLC is currently priced at 0.8609. MA5=0.90236 has crossed above MA20=0.778535, confirming a bullish moving-average alignment and a moderately bullish medium-term structure. However, the price has fallen back below MA5, and short-term momentum has weakened somewhat. The MACD histogram remains at +0.01407, with bullish momentum not yet reversed, but caution is warra
post-image
RLC+27.25%
SOL-4.72%
MINA-17.58%
Breaking 🚨 Vitalik Buterin warns: AI-driven mathematics could weaken lattice-based cryptography within two years 🚀. This prediction adds a new AI dimension to the increasingly imminent quantum risk (targeting ECDSA and other signature schemes). Researchers say breakthroughs in algorithmic number theory could render current post-quantum defenses obsolete 🤖. Industry leaders are urged to accelerate migration to alternative primitives. Stay tuned for updates 📈. $OG , $RLC , $OGN
.
post-image
OG-3.57%
RLC+27.50%
OGN+111.24%
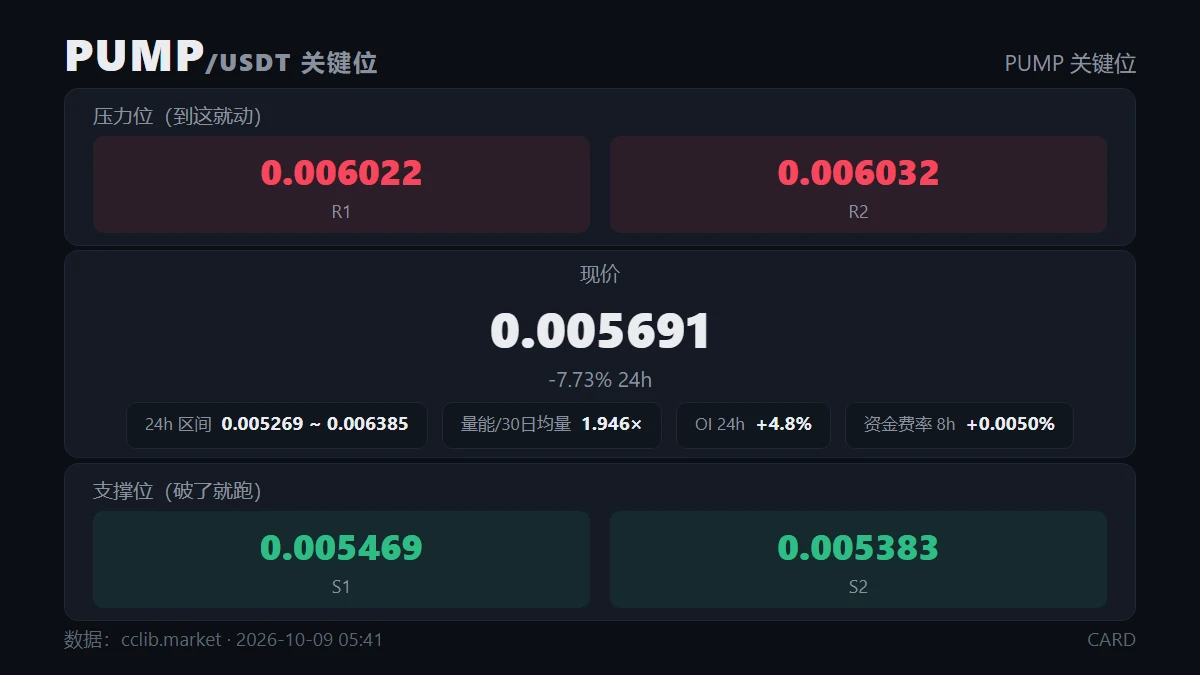
PUMP hit by reverse-engineering access revocation -7.9%, rebounds 2.41%; I’m bullish
$PUMP Its access was revoked following reverse engineering last night. The current price is 0.00568, with 24h performance at -7.9%, yet the chart didn’t collapse: after the incident, it moved from 0.005557 to 0.005691, rebounding +2.41%. I’m bullish at this level.
The daily structure remains intact—RSI 65.2 is strong, MACD has been above the zero line with a bullish crossover for the 11th day, MA7 has stayed above MA30 for the 14th day, and the short-term moving averages remain in a bullish alignment.
Funds
post-image
PUMP-8.28%
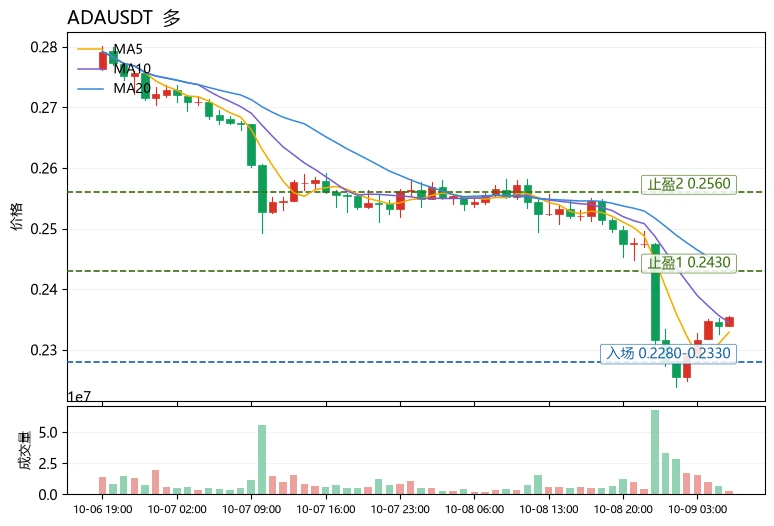
Amid the broad decline across the sector, why is $ADA more worth watching?
The answer lies in relative strength: INJ is down 8.22% over 24h with a 16.82% trading range, while ADA is down 7.43% with a 14.61% range. Both the decline and volatility are more contained, indicating that selling pressure has been relatively well released. However, the technical picture has not yet turned bullish—MA5=0.23292 is below MA20=0.243225, showing a bearish alignment; RSI=36.5 is approaching the oversold zone, the MACD histogram at -0.0006026 remains negative, and the price is near the Bollinger lower band at
post-image
INJ-8.08%
Load More

Join 40 M users in our growing community

⚡️ Join 40 M users in the crypto craze discussion

💬 Engage with your favorite top creators

👍 See what interests you

Trending Topics

Gate Money Officially Launches

3.45k Views12.86k Discussing

Gate officially launches Gate Money, a global integrated financial services app that brings digital assets, fiat, stocks, ETFs, gold, bank accounts, and payments into one Gate App. Users can manage assets, invest, send and receive funds, convert currencies, and make payments — all from a single account. Which use case are you most excited about? [👉 Learn more](https://www.gate.com/announcements/article/102094)

Fed September Minutes Lean Hawkish

64.14k Views2.72k Discussing

Samsung Q3 Operating Profit Surges 782.5%

36.88k Views1.93k Discussing

View More