AlSamad

vip
Active for: 1.2y
Peak Tier 5
Web3 Content Creator Active in Global Crypto Events & Campaigns Airdrops • Trading • Research • Community Growth
Market行情 Analysis
403 views
2026-07-28 11:01
  • Reward
  • Comment
  • Repost
  • Share
#GUSDYieldRisesto3.8%
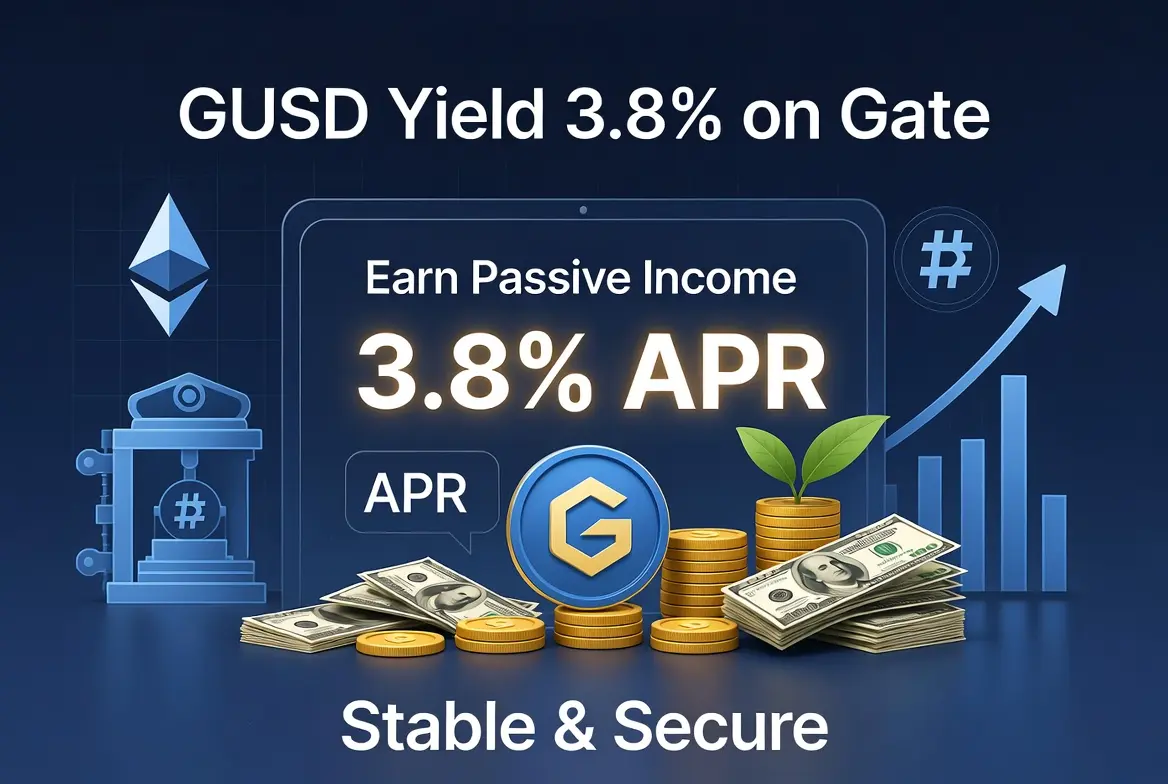
GUSD Yield Rises to 3.8% — A Meaningful Opportunity for Gate Users
The Gemini Dollar, known as GUSD, is a regulated stablecoin issued by Gemini Trust Company, backed one-to-one by United States dollars held in reserve at State Street Bank and Trust Company. GUSD operates on the Ethereum blockchain as an ERC-20 token, pegged at exactly 1.00 USD, making it an ideal asset for users who want to avoid cryptocurrency volatility while still earning passive income through decentralized finance. The recent increase in GUSD yield to 3.8 percent annual percentage rate on Gate repre
GUSD-0.01%
ETH2.15%
BTC0.86%
USDC0.02%
HighAmbition
#GUSDYieldRisesto3.8%
GUSD Yield Rises to 3.8% — A Meaningful Opportunity for Gate Users
The Gemini Dollar, known as GUSD, is a regulated stablecoin issued by Gemini Trust Company, backed one-to-one by United States dollars held in reserve at State Street Bank and Trust Company. GUSD operates on the Ethereum blockchain as an ERC-20 token, pegged at exactly 1.00 USD, making it an ideal asset for users who want to avoid cryptocurrency volatility while still earning passive income through decentralized finance. The recent increase in GUSD yield to 3.8 percent annual percentage rate on Gate represents a significant opportunity for users who hold or stake GUSD through Gate's Earn and Staking programs.
For users holding GUSD on Gate at the current 3.8 percent yield, the earnings potential is substantial. A user with 10,000 GUSD (worth 10,000 USD) would generate approximately 380 USD annually, roughly 31.67 USD per month or 1.05 USD per day. At 50,000 GUSD, the annual return reaches approximately 1,900 USD, which is 158.33 USD monthly and 5.22 USD daily. A larger allocation of 100,000 GUSD yields around 3,800 USD annually, translating to 316.67 USD per month and approximately 10.42 USD per day. These figures demonstrate how the yield increase directly boosts earnings at every investment level, making GUSD staking on Gate attractive compared to traditional savings accounts at conventional banks which typically offer only 0.50 percent to 1.00 percent annual interest on USD deposits.
Gate Earn offers both flexible and fixed-term savings products for GUSD. Flexible savings allow users to withdraw at any time without penalty while earning the advertised yield, whereas fixed-term products lock funds for durations of 7, 14, 30, 60, or 90 days and may offer rates from 3.80 percent to 4.20 percent as a reward for longer commitments. The current 3.8 percent GUSD yield competes favorably against traditional instruments: US Treasury bills yield approximately 4.20 percent to 4.50 percent but require minimum thresholds and brokerages, money market accounts offer 3.50 percent to 4.00 percent but impose withdrawal restrictions and minimum balances, and certificates of deposit offer 3.75 percent to 4.25 percent but lock funds with early withdrawal penalties. Gate's GUSD staking at 3.8 percent with flexible withdrawal stands as a remarkably convenient alternative.
Compared to other major stablecoins, GUSD at 3.8 percent holds its own. USDT, with approximately 83 billion USD market cap, typically yields 1.50 percent to 3.00 percent across platforms. USDC, at roughly 33 billion USD circulation, offers 2.00 percent to 4.00 percent, though the higher rates are usually reserved for institutional deposits or long-term fixed products. DAI, the decentralized stablecoin by MakerDAO with approximately 5 billion USD market cap, has offered a variable Savings Rate fluctuating between 1.00 percent and 3.50 percent. FRAX, a partially algorithmic stablecoin, has offered 2.00 percent to 5.00 percent in certain liquidity pools but carries additional risk from its algorithmic design. GUSD at 3.8 percent through Gate's accessible Earn program positions itself as one of the most straightforward yield opportunities, combining regulatory compliance with competitive returns.
GUSD's risk profile is one of its strongest advantages. Since launch in September 2018, GUSD has consistently maintained its dollar peg without any significant depegging event, unlike USDT which briefly dropped to 0.9550 USD in May 2021, DAI which fell to 0.9300 USD during the March 2020 crash, or USDC which dipped to 0.8700 USD during the March 2023 Silicon Valley Bank crisis before recovering. Regulatory oversight by the New York Department of Financial Services requires regular audits and monthly attestation reports by BPM Audit and Assurance confirming that GUSD reserves equal or exceed the circulating supply. Recent reports show reserves of approximately 33 million USD against roughly 33 million GUSD in circulation, ensuring full backing at a 1.00 ratio. This regulatory framework and transparent attestation process make GUSD one of the safest stablecoins regarding peg stability, meaning users earning 3.8 percent on Gate are doing so on an asset with minimal depegging risk compared to alternatives that may offer slightly higher yields but carry greater stability concerns.
The broader rate environment supports this opportunity. The US Federal Reserve has maintained its benchmark rate at approximately 4.25 percent to 4.50 percent, following aggressive hikes in 2022-2023 to combat inflation that peaked at 9.10 percent in June 2022. As inflation declined toward the 2.00 percent target, adjustments became more measured. Stablecoin yields correlate with this environment because issuers' underlying dollar reserves earn interest at near-Federal Reserve rates, and platforms like Gate pass a portion to users. Should the Federal Reserve begin cutting rates in future quarters, stablecoin yields including GUSD would likely decline, making the current 3.8 percent rate a timely opportunity worth capitalizing on before potential reductions.
Comparing GUSD to other Gate Earn products reinforces its appeal. Gate BTC Earn products yield 0.50 percent to 2.00 percent, lower because Bitcoin's volatility makes lending demand variable. Gate ETH Earn offers 1.00 percent to 3.50 percent, with base staking yields of 3.20 percent to 3.50 percent, though ETH carries significant price volatility. Gate SOL Earn yields approximately 5.00 percent to 7.00 percent through validator staking, but SOL's price fluctuates dramatically, making effective USD returns unpredictable. For users prioritizing capital preservation and predictable dollar returns, GUSD at 3.8 percent remains one of the most compelling options because the underlying asset stays constant at 1.00 USD regardless of market conditions, ensuring earned yield is true dollar income rather than variable returns subject to price swings.
The compounding effect over time amplifies the benefit. Starting with 1,000 GUSD at 3.8 percent yields approximately 38 USD in the first year, reaching 1,038 GUSD. In the second year at the same rate, earnings grow to approximately 39.44 USD, totaling 1,077.44 GUSD. Over three years, cumulative earnings reach approximately 118.76 USD without additional deposits. A user adding 500 GUSD monthly starting from 1,000 GUSD would reach approximately 7,095 GUSD after 12 months including accumulated yield. With 25,000 GUSD, annual yield at 3.8 percent generates approximately 950 USD, enough to cover monthly digital service subscriptions while the principal remains fully intact and withdrawable through flexible savings.
Gate continues expanding its Earn offerings as part of its strategy to be the most comprehensive platform for digital asset yield generation. The 3.8 percent GUSD yield reflects this commitment to competitive, reliable dollar-denominated returns without the complexity of decentralized finance protocols. Users should regularly check Gate Earn for updated rates and product availability, as yields can fluctuate based on market conditions and lending demand. Subscribing to flexible savings while monitoring for higher fixed-term rates balances liquidity with yield optimization. The current 3.8 percent rate on GUSD through Gate stands as a strong opportunity combining regulatory-backed stability, competitive returns, platform reliability, and user-friendly access — a compelling choice for passive income generation in today's financial environment.@Gate_Square #SummerCreationCamp
repost-content-media
  • Reward
  • 2
  • Repost
  • Share
Yusfirah:
LFG 🔥
View More
#EventContractsLive
Gate Event Contracts have arrived, and they are reshaping the way traders engage with short-term crypto market movements. If you have been looking for a product that strips away the complexity of margin, leverage, and liquidation while giving you direct exposure to Bitcoin and Ethereum price direction, this is exactly what you need. Gate has built a product where the entire trading logic is centered on one simple question: will the price go up, or will it go down? That is all you need to decide. No complicated formulas, no risk of margin calls, no overnight funding fees ea
BTC0.85%
ETH2.16%
HighAmbition
#EventContractsLive
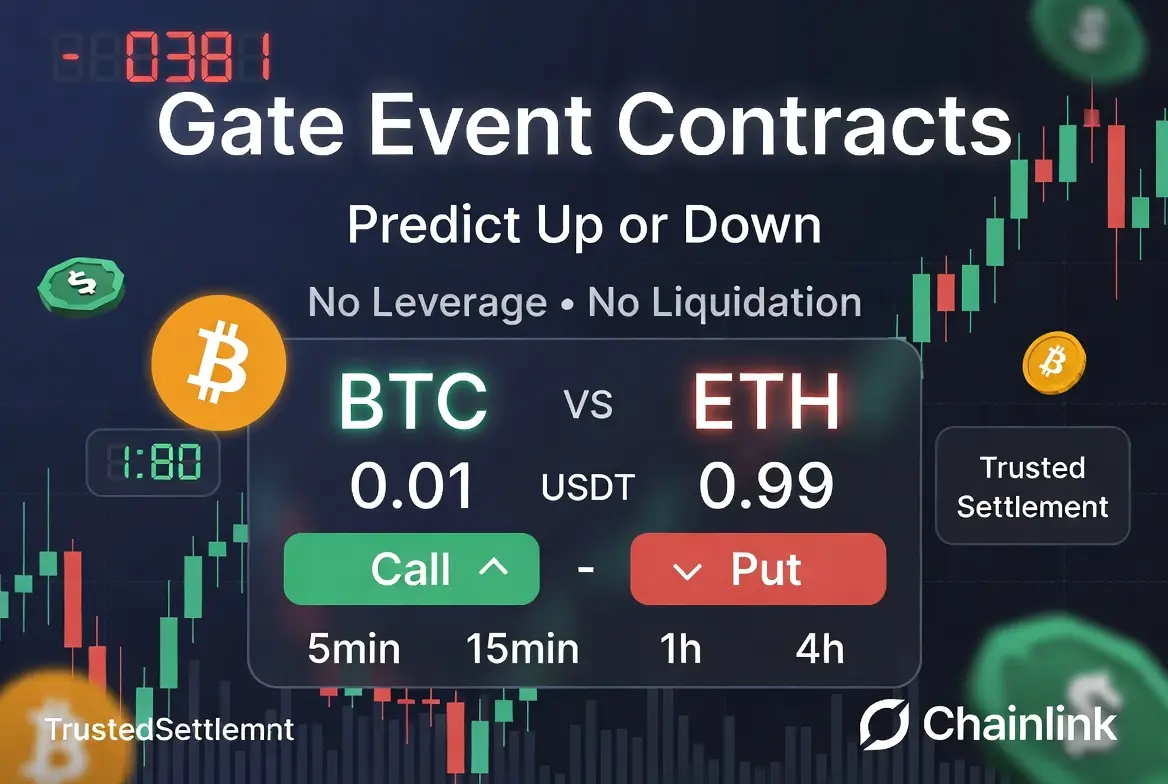
Gate Event Contracts have arrived, and they are reshaping the way traders engage with short-term crypto market movements. If you have been looking for a product that strips away the complexity of margin, leverage, and liquidation while giving you direct exposure to Bitcoin and Ethereum price direction, this is exactly what you need. Gate has built a product where the entire trading logic is centered on one simple question: will the price go up, or will it go down? That is all you need to decide. No complicated formulas, no risk of margin calls, no overnight funding fees eating into your capital. Just pure, transparent direction-based trading on the two most important assets in the crypto market.
The mechanics are straightforward and intentionally designed for accessibility. Each event contract is priced between 0.01 and 0.99 USDT, and this price reflects the real-time probability that the market assigns to a given outcome. You can start trading with as little as 1.5 USDT, and the minimum order is just 6 contract shares. When you open a position, you are either buying Call contracts if you believe the asset price will be higher at the end of the cycle, or Put contracts if you believe it will be lower. The cycle options cover 5-minute, 15-minute, 1-hour, and 4-hour windows, giving you flexibility whether you are a scalper looking for ultra-short momentum plays or a more strategic trader reading hourly trend shifts. These four timeframes are tailored to different trading rhythms, so you can pick the one that matches your style and market reading.
Settlement is where Gate Event Contracts truly stand apart from other products. When the event cycle ends, the system automatically settles your position based on the actual price outcome sourced from Chainlink, one of the most trusted and authoritative data providers in the blockchain industry. There is no manual intervention, no ambiguity, and no room for dispute. If your prediction is correct, each winning contract pays out exactly 1 USDT with zero settlement fee. If your prediction is wrong, the contract value goes to zero, and your loss is strictly limited to what you paid when you bought the contract. There are no hidden charges, no surprise deductions, and no cascading losses that exceed your initial investment. This fixed payout structure means you always know your maximum potential profit and maximum potential loss before you even place the order. That level of clarity is rare in crypto trading products, and it gives you genuine control over your risk exposure.
The ability to close your position early adds another dimension of strategic flexibility. Before the event cycle expires, you can sell your holdings through the Order Book at any time. This means you can lock in profits if the market is moving in your direction sooner than expected, or cut losses if the trend reverses against your prediction. You are never locked into waiting for expiration. Early close functionality gives you the power to manage your trades actively, implementing take-profit or stop-loss logic on your own terms without relying on automated triggers. This hands-on control is something that many traditional derivatives products do not offer in such a clean and direct way.
Fee transparency is another area where Gate Event Contracts deliver a better experience. Trading fees apply only when you open and close positions, and they follow a dynamic curve rate model that starts as low as 0.02 percent. There are no holding fees, no overnight charges, no funding rate fees, and absolutely zero delivery fees at contract expiration. Every fee detail is traceable in your fund flow records, so you always know exactly what you are paying and why. This simplicity in the fee structure ensures that your trading costs remain predictable and minimal, especially for high-frequency traders who operate across multiple short cycles throughout the day.
The product currently supports BTC and ETH as the underlying assets, and these two assets alone represent the core of the crypto market. Bitcoin remains the benchmark for the entire industry, and Ethereum continues to drive the DeFi and smart contract ecosystem. By focusing on these flagship assets, Gate ensures that every event contract has deep liquidity, high market interest, and reliable price data. The 24-hour cyclical market structure means trading never stops. Events roll continuously around the clock, so whether you are trading during Asian market hours, European sessions, or North American timeframes, there is always an active event available. This nonstop operation is critical for crypto traders who operate across global time zones and need access to short-term directional opportunities at any hour.
For anyone who has been hesitant to enter derivatives trading because of the complexity of leverage, margin management, and liquidation risk, Gate Event Contracts remove those barriers entirely. You trade in USDT directly, no conversion or wrapping needed. You predict direction, pick your timeframe, choose your price in the Order Book, enter quantity, and submit. The process takes seconds, and the outcome is determined by real market data verified by Chainlink. This combination of simplicity, transparency, and authoritative settlement is what makes Gate Event Contracts a genuinely different product in the exchange landscape. It is built for traders who want focused, short-cycle exposure to major crypto assets without the overhead and risk baggage that comes with traditional leveraged products.
Gate continues to prove why it stands among the best exchanges in the industry. From product innovation to data integrity, from fee fairness to user accessibility, every element of Event Contracts reflects a platform that understands what traders actually need. The low entry threshold of 1.5 USDT means that even newcomers can participate and learn directional trading without committing large capital. The fixed payout and loss structure ensures that risk is always bounded and visible. The 24-hour rolling events and multiple timeframe choices mean there is always an opportunity aligned with your schedule and strategy. And the Chainlink-verified automatic settlement guarantees that every result is trustworthy and tamper-proof.
Whether you are an experienced trader looking for a clean short-cycle product, or a beginner who wants to start with something simple and well-defined, Gate Event Contracts are worth your attention. The product is live, the markets are rolling, and the opportunity to trade BTC and ETH direction with full transparency and controlled risk is available right now. Open your Gate App, navigate to the Futures page, switch to Events, and start trading today. The next 5-minute BTC event could be your next winning call.
Start trading now: https://www.gate.com/announcements/article/100686
@Gate_Square #SummerCreationCamp
repost-content-media
  • Reward
  • 1
  • Repost
  • Share
Yusfirah:
Diamond Hands 💎
#ETHBreaks1900
ETH has officially broken above the $1900 resistance level and is now trading at $1936. This is a significant technical and psychological milestone for Ethereum.
1. Why Breaking $1900 Matters
The $1900 level was not just a random number on the chart. It served as a strong psychological and technical resistance zone for ETH over several weeks. Multiple attempts to cross this level failed, creating what technicians call a "rejection zone." When price finally sustains above such a heavily tested resistance, it signals that the sellers who were defending that level have been overwh
HighAmbition
#ETHBreaks1900
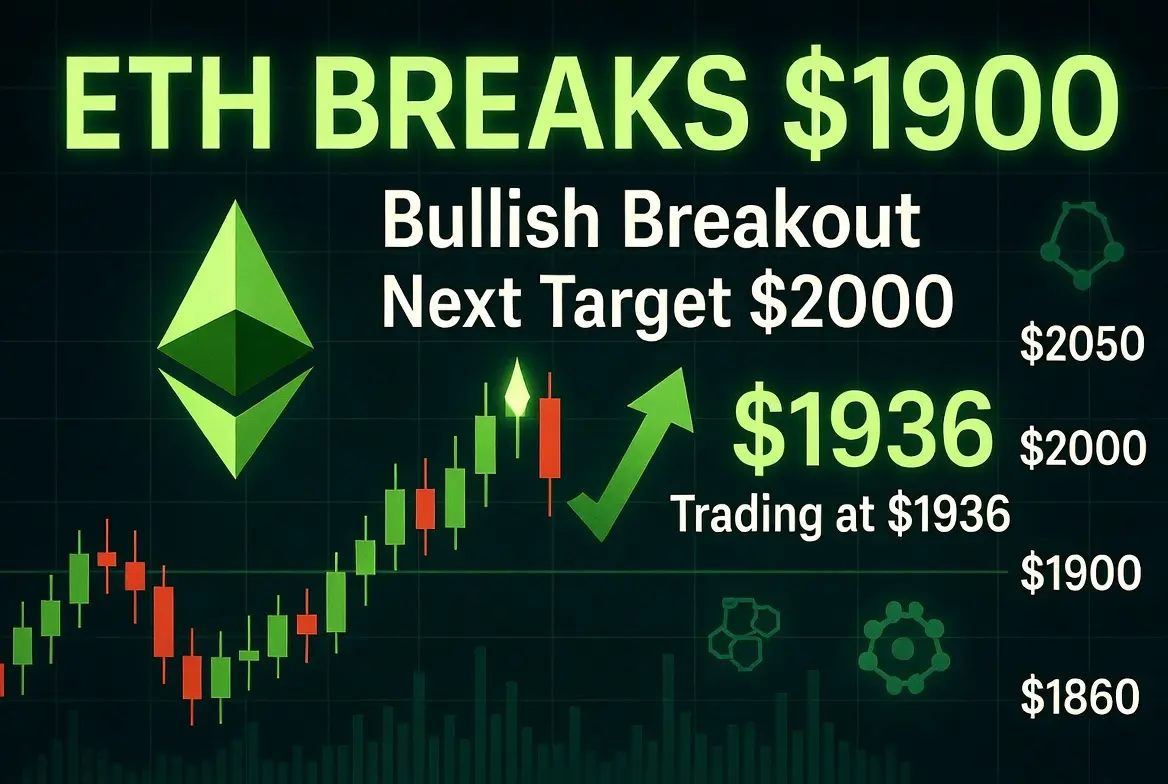
ETH has officially broken above the $1900 resistance level and is now trading at $1936. This is a significant technical and psychological milestone for Ethereum.
1. Why Breaking $1900 Matters
The $1900 level was not just a random number on the chart. It served as a strong psychological and technical resistance zone for ETH over several weeks. Multiple attempts to cross this level failed, creating what technicians call a "rejection zone." When price finally sustains above such a heavily tested resistance, it signals that the sellers who were defending that level have been overwhelmed by buyer demand. This breakout confirms that bullish momentum is real and not a temporary spike. The fact that ETH is holding at $1936 and not immediately falling back below $1900 gives confidence that this breakout has legitimacy.
---
2. Breakout Confirmation — Is It Real or False
A breakout is only trustworthy when it is confirmed by two factors: price closing above resistance on a relevant timeframe, and strong trading volume accompanying the move. At $1936, ETH has cleared $1900 by approximately $36, which is a decent buffer. If the daily candle closes above $1900, this breakout is confirmed. However, traders should watch for a "false breakout" scenario where price spikes above $1900 for a few hours but then falls back below it. A false breakout often leads to a sharp drop as trapped buyers panic sell. The current $36 cushion above $1900 reduces the risk of a false breakout, but vigilance is still required in the next 24 to 48 hours.
---
3. Key Support Levels Below
Now that $1900 has been broken, it transforms from resistance into support. This is one of the most important concepts in technical analysis — old resistance becomes new support. The key support levels traders should monitor are:
$1900 — the former resistance now acting as first line of support. If price retests this level and bounces, it strengthens the bullish case.
$1860 — a secondary support zone where buying interest previously emerged.
$1830 — a deeper support level that served as a floor during recent corrections.
$1780 — the major structural support below which the bullish narrative would be seriously damaged.
Traders should place stop-loss orders relative to these levels depending on their risk tolerance. A conservative stop would be below $1860, while an aggressive one could be placed just below $1900.
---
4. Key Resistance Levels Above
With $1900 conquered, the next resistance targets come into focus. These are the levels where sellers may re-emerge and create hurdles for further upward movement:
$1960 — the immediate minor resistance. Price may pause here briefly before attempting higher levels.
$2000 — the next major psychological resistance. Round numbers like $2000 always attract significant seller interest and media attention. Breaking $2000 would be another major milestone comparable to the $1900 breakout.
$2050 — a technical resistance zone identified from previous price action where ETH faced rejection.
$2100 to $2150 — the next cluster of resistance that would need strong volume and sentiment to overcome.
Each of these levels should be approached with realistic expectations. Price rarely moves straight from one level to the next without pullbacks and consolidation.
---
5. Current Market Sentiment
Market sentiment around ETH is currently leaning bullish, driven by several factors. The breakout above $1900 has generated positive social media discussion and renewed interest from traders who were sitting on the sidelines waiting for confirmation. Ethereum's fundamental narrative continues to strengthen with ongoing network upgrades, growing DeFi activity, and increasing institutional interest in smart contract platforms. The broader crypto market sentiment is also supportive, with Bitcoin showing stability and altcoins gaining momentum. However, sentiment can shift quickly. Any macro negative event such as unexpected regulatory action, poor economic data, or a Bitcoin sharp drop could reverse sentiment overnight. Traders should track sentiment indicators including social volume, long/short ratios on exchanges, and funding rates in perpetual futures to gauge real-time crowd positioning.
---
6. Trader Psychology — What Smart Traders Are Thinking
Experienced traders are approaching this breakout with a mix of optimism and caution. Here is what different categories of traders are likely thinking:
Short-term momentum traders are looking to ride the breakout momentum toward $2000 with tight risk management. They enter quickly and exit just before major resistance levels.
Swing traders are waiting for a pullback to $1900 or slightly below to enter at a better price. They believe that breakout pullbacks offer the highest probability entries with the lowest risk.
Long-term holders are not overly excited by a single breakout. They view $1900 as one step in a longer journey and are focused on whether ETH can sustain above $2000 and eventually challenge higher targets.
Skeptical traders are watching for signs of exhaustion. They worry that the breakout may have happened too fast without sufficient consolidation, which could mean the move lacks durability.
The key takeaway is that the best trading decisions come from understanding which camp you belong to and acting accordingly rather than chasing someone else's strategy.
---
7. Forecast — Where Can ETH Go Next
Based on the current breakout structure and market conditions, here is a reasonable forecast framework:
Short-term target: $1960 to $2000 range within the next few days. Reaching $2000 is the natural next goal after clearing $1900, but price may consolidate between $1930 and $2000 first.
Medium-term target: If $2000 is broken with volume, the $2050 to $2150 zone becomes achievable within one to two weeks. This range represents the next leg of the bullish move.
Extended target: In a strong bullish scenario with favorable macro conditions, ETH could target $2200 to $2400 over the coming weeks. However, this requires sustained buying pressure and no major negative catalysts.
Downside risk: If the breakout fails and price falls back below $1900 with volume, a drop toward $1830 or even $1780 is possible. This would invalidate the bullish setup temporarily.
No forecast is guaranteed. These are probability-based scenarios, and traders should adjust their positions as new data emerges rather than committing entirely to one outcome.
---
8. Trading Strategy For Different Risk Profiles
Conservative Strategy: Enter on a pullback to the $1900 to $1920 zone after confirming that price holds above $1900. Set a stop-loss below $1860. Target $2000 for the first profit take and $2050 for the second. Risk-reward ratio approximately 1:2.5. This approach sacrifices some potential upside but offers high probability with limited risk.
Moderate Strategy: Enter at current price around $1936 with a stop-loss below $1890. Target $1960 for partial profit exit of 30 percent of position, $2000 for another 30 percent exit, and let the remaining 40 percent ride toward $2050 or higher with a trailing stop. Risk-reward ratio approximately 1:3. This balances aggressiveness with protection.
Aggressive Strategy: Enter at $1936 with a tight stop-loss below $1910. Use slightly higher position size. Target $2000 as first exit and hold remainder for $2100 or beyond with a trailing stop that moves up with each resistance break. Risk-reward ratio approximately 1:4 but with higher probability of being stopped out on minor pullbacks. This approach is only suitable for experienced traders with strict discipline.
---
9. Risk Management Rules That Every Trader Must Follow
Regardless of which strategy you choose, these risk management principles are non-negotiable:
Never risk more than 2 to 5 percent of your total trading capital on a single ETH position. This ensures that even a worst-case stop-out does not cripple your portfolio.
Always set a stop-loss before entering. Do not rely on mental stops because emotions override logic during live market volatility.
Scale into positions rather than entering with full size at one price. For example, enter 50 percent at current price and add 50 percent on a pullback to $1900 support. This averages your entry price and reduces timing risk.
Take partial profits at each resistance level. Do not wait for the absolute top because you will likely miss it. Selling 30 to 40 percent at $2000 locks in gains while still leaving exposure for further upside.
Monitor Bitcoin's price simultaneously. ETH rarely moves independently. If BTC drops sharply, ETH will likely follow regardless of its own technical setup.
Stay updated on macro events. Interest rate decisions, inflation data releases, and regulatory announcements can override all technical analysis within minutes.
---
10. Final Summary — Action Plan For Traders And Investors
ETH breaking $1900 and holding at $1936 is a positive development that opens the path toward $2000 and potentially higher. The breakout appears genuine based on current price action, but the next 24 to 48 hours are critical for full confirmation. Traders should watch for a daily close above $1900 and healthy volume to validate the move. The $1900 level now becomes the most important support to defend — if it holds on retests, the bullish structure remains intact. The immediate upside target is $2000, and beyond that $2050 to $2150 represents the next significant zone. Risk management is paramount regardless of conviction level. Enter with proper position sizing, pre-defined stop-losses, and a clear profit-taking plan. Do not let excitement from a breakout push you into overleveraged positions. Markets reward discipline and punish greed consistently. For investors with a longer time horizon, this breakout adds confidence to the bullish thesis, but patience is still required. Major moves take time to develop, and the best results come from staying positioned rather than constantly adjusting. Stay focused, stay disciplined, and trade what the market shows you — not what you hope it will show.
@Gate_Square #SummerCreationCamp
repost-content-media
  • Reward
  • 1
  • Repost
  • Share
Yusfirah:
To The Moon 🌕
#SummerCreationCamp
#XAU
XAU GOLD — COMPREHENSIVE MARKET ANALYSIS (July 22, 2026)
Gold is currently trading around $4,054 per ounce, placing the precious metal at one of the most important technical and psychological crossroads of 2026. After experiencing one of the strongest rallies in modern history during late 2025 and early 2026, gold reached a record intraday high near $5,589 before entering a deep correction that surprised both retail and institutional investors. Although the market has recovered modestly from its late-June lows, the broader trend remains a battle between long-term str
HighAmbition
#SummerCreationCamp
#XAU
XAU GOLD — COMPREHENSIVE MARKET ANALYSIS (July 22, 2026)
Gold is currently trading around $4,054 per ounce, placing the precious metal at one of the most important technical and psychological crossroads of 2026. After experiencing one of the strongest rallies in modern history during late 2025 and early 2026, gold reached a record intraday high near $5,589 before entering a deep correction that surprised both retail and institutional investors. Although the market has recovered modestly from its late-June lows, the broader trend remains a battle between long-term structural bullish forces and short-term macroeconomic headwinds. The coming months are likely to determine whether gold resumes its historic bull market toward new highs or continues consolidating before another major move.
During the first half of 2026, gold experienced extraordinary volatility. Prices surged as geopolitical tensions intensified, central banks continued record purchases, and investors sought protection against inflation and currency uncertainty. However, sentiment changed dramatically after the Federal Reserve adopted a more hawkish tone, U.S. Treasury yields climbed, and the U.S. dollar strengthened. The combination of higher real interest rates and improving geopolitical optimism caused investors to reduce safe-haven exposure, triggering an aggressive correction of approximately 29% from the January peak. Despite this decline, gold remains almost 20% higher than one year ago, demonstrating that the long-term structural uptrend has not been completely broken.
The recovery from late June has been encouraging but remains incomplete. Gold briefly fell below the psychologically important $4,000 level before buyers stepped back into the market around $3,960, creating an important technical support zone. Since then, prices have recovered several percentage points, indicating that institutional investors continue viewing lower prices as attractive accumulation opportunities. Nevertheless, bulls have repeatedly failed to sustain momentum above the $4,200 resistance region, showing that sellers remain active whenever prices approach higher levels.
One of the biggest questions investors are asking is whether gold can realistically reach $4,500 during the remainder of 2026. From current prices, such a move would require an advance of roughly 11%, which is certainly achievable considering gold's historical volatility. However, achieving this target depends almost entirely on macroeconomic developments. If inflation continues easing, the Federal Reserve begins signaling future rate cuts, the U.S. dollar weakens, or geopolitical risks intensify again, gold could attract substantial investment flows. Without those catalysts, the market may continue trading sideways between support and resistance for several more months.
Institutional forecasts remain remarkably divided, highlighting the uncertainty surrounding the macroeconomic environment. Goldman Sachs, HSBC, Deutsche Bank, J.P. Morgan, Wells Fargo, UBS, StoneX, and several other major financial institutions all agree that gold remains strategically important, yet their year-end targets differ significantly. The most bearish projections expect prices near $4,000, while the most optimistic forecasts suggest gold could eventually revisit $6,000 or even higher if monetary policy becomes significantly more accommodative. The majority of institutional estimates cluster around $4,900 to $5,000, implying moderate upside rather than an immediate return to record highs.
Central bank demand continues to provide one of the strongest long-term foundations for gold. Over the past several years, global central banks have consistently accumulated approximately 1,000 tonnes annually, representing the strongest purchasing cycle in decades. Many emerging-market central banks are actively diversifying reserves away from the U.S. dollar, increasing allocations to physical gold instead. This demand is fundamentally different from speculative investment flows because central banks generally purchase with multi-year strategic objectives rather than short-term trading intentions. Their continued buying significantly reduces downside risks during periods of market weakness.
Physical investment demand also remains exceptionally resilient despite historically elevated prices. Demand for gold bars and coins has increased substantially compared with last year, while Chinese and Indian consumers continue purchasing physical bullion even after enormous price appreciation. This demonstrates that long-term investors continue viewing gold primarily as a store of value rather than simply a speculative asset. Such strong physical demand has helped absorb selling pressure generated by futures traders and exchange-traded funds during recent corrections.
Exchange-traded funds represent another important indicator to monitor throughout the second half of the year. ETF inflows generally indicate increasing institutional confidence, while persistent outflows often signal weakening investor sentiment. During the correction from January highs, several major ETFs experienced net outflows as investors shifted toward higher-yielding assets. A sustained return of ETF inflows would likely confirm renewed institutional confidence and could provide additional momentum for prices to challenge higher resistance levels.
The Federal Reserve remains the single most important driver of gold prices. Gold does not generate interest or dividends, meaning its attractiveness often declines when interest rates rise because investors can earn higher returns from government bonds and other fixed-income investments. Current market expectations continue reflecting uncertainty regarding future Federal Reserve decisions. Any indication that policymakers are becoming less aggressive could immediately improve sentiment toward precious metals, while further tightening would likely create additional downward pressure.
The U.S. dollar also plays a decisive role because gold is priced internationally in dollars. A stronger dollar makes gold more expensive for international buyers, often reducing demand and pressuring prices lower. Conversely, a weaker dollar usually supports gold by making it relatively cheaper for foreign investors. Throughout much of 2026, dollar strength has remained an important obstacle preventing gold from extending its recovery despite strong underlying physical demand.
Inflation expectations continue influencing market psychology. Gold has historically performed well during periods of persistent inflation because investors increasingly seek assets capable of preserving purchasing power. Although headline inflation has moderated compared with previous peaks, uncertainty regarding future price pressures remains elevated. Unexpected increases in inflation could quickly revive safe-haven demand, while continued disinflation may reduce urgency for defensive allocations.
Geopolitical developments remain another critical variable. Earlier this year, tensions involving the Middle East significantly increased gold's safe-haven appeal. More recently, improving diplomatic conditions reduced some of that risk premium, contributing to the market correction. Nevertheless, geopolitical uncertainty remains elevated globally, meaning unexpected developments could rapidly restore investor demand for defensive assets. Gold has historically responded strongly whenever financial markets become concerned about military conflicts, trade disputes, or political instability.
From a technical perspective, gold currently appears trapped inside a broad consolidation range. The $4,000 area has emerged as the most important psychological support because repeated buying has prevented sustained declines below this level. Below that, $3,960, $3,840, and ultimately $3,300–3,400 represent progressively stronger technical support zones. On the upside, resistance initially appears near $4,100, followed by $4,140, $4,214, $4,300, and eventually $4,700. Only a decisive breakout above these resistance levels would confirm that bulls have regained long-term control.
Momentum indicators currently present a mixed picture. Relative Strength Index readings suggest the market is no longer deeply oversold but has not yet entered overbought territory either. Moving averages continue reflecting consolidation rather than a strong directional trend, while declining volatility compared with January suggests the market is preparing for its next major move. Traders should closely monitor volume because any breakout supported by increasing participation would carry significantly greater credibility than a low-volume move.
Market sentiment remains divided between short-term traders and long-term investors. Many short-term traders continue favoring range-trading strategies because prices have repeatedly reversed near well-defined support and resistance levels. Long-term investors, however, increasingly argue that the correction represents an attractive opportunity to accumulate positions before the next structural advance. This difference in positioning explains why the market continues oscillating rather than establishing a decisive trend.
For CFD traders, discipline remains more important than prediction. Buying near established support while maintaining strict stop-loss protection offers favorable risk-reward characteristics if the range continues holding. Likewise, selling near strong resistance may remain effective until a confirmed breakout occurs. Traders should avoid excessive leverage because current volatility remains significantly higher than historical averages, increasing the probability of sudden price swings capable of triggering unnecessary losses.
Looking ahead, the most probable scenario involves continued consolidation during the summer before macroeconomic developments determine the next major trend. If the Federal Reserve becomes less hawkish, the U.S. dollar weakens, and central bank demand remains strong, gold could gradually recover toward $4,500 and eventually $4,900–5,000.
Alternatively, if inflation accelerates, interest rates continue rising, and the dollar strengthens further, another test of $4,000 or even lower support levels cannot be ruled out.
Final Outlook: Gold remains one of the world's most strategically important assets despite experiencing a significant correction from record highs. Long-term structural drivers—including central bank accumulation, reserve diversification, persistent geopolitical uncertainty, and investor demand for portfolio protection—remain largely intact. However, short-term price direction continues depending primarily on Federal Reserve policy, U.S. dollar strength, and real interest rates. Until the market breaks decisively above $4,214 or below $4,000, traders should expect continued range-bound price action while preparing for a potentially powerful breakout later in 2026.@Gate_Square
repost-content-media
  • Reward
  • 1
  • Repost
  • Share
Yusfirah:
To The Moon 🌕
#BTCBreaks66000
Bitcoin Breaks Above $66,000 – Is the 2026 Bull Market Returning or Is This Another Bull Trap?
Bitcoin has officially reclaimed the $66,000 psychological resistance, currently trading around $66,230, and this breakout is one of the most significant technical developments the cryptocurrency market has witnessed in 2026.
After spending weeks struggling below this barrier, BTC has finally forced a decisive breakout, completely changing short-term market structure. The recovery has been nothing short of remarkable. From the July 2 low near $57,750 to today's price around $66,230,
HighAmbition
#BTCBreaks66000
Bitcoin Breaks Above $66,000 – Is the 2026 Bull Market Returning or Is This Another Bull Trap?
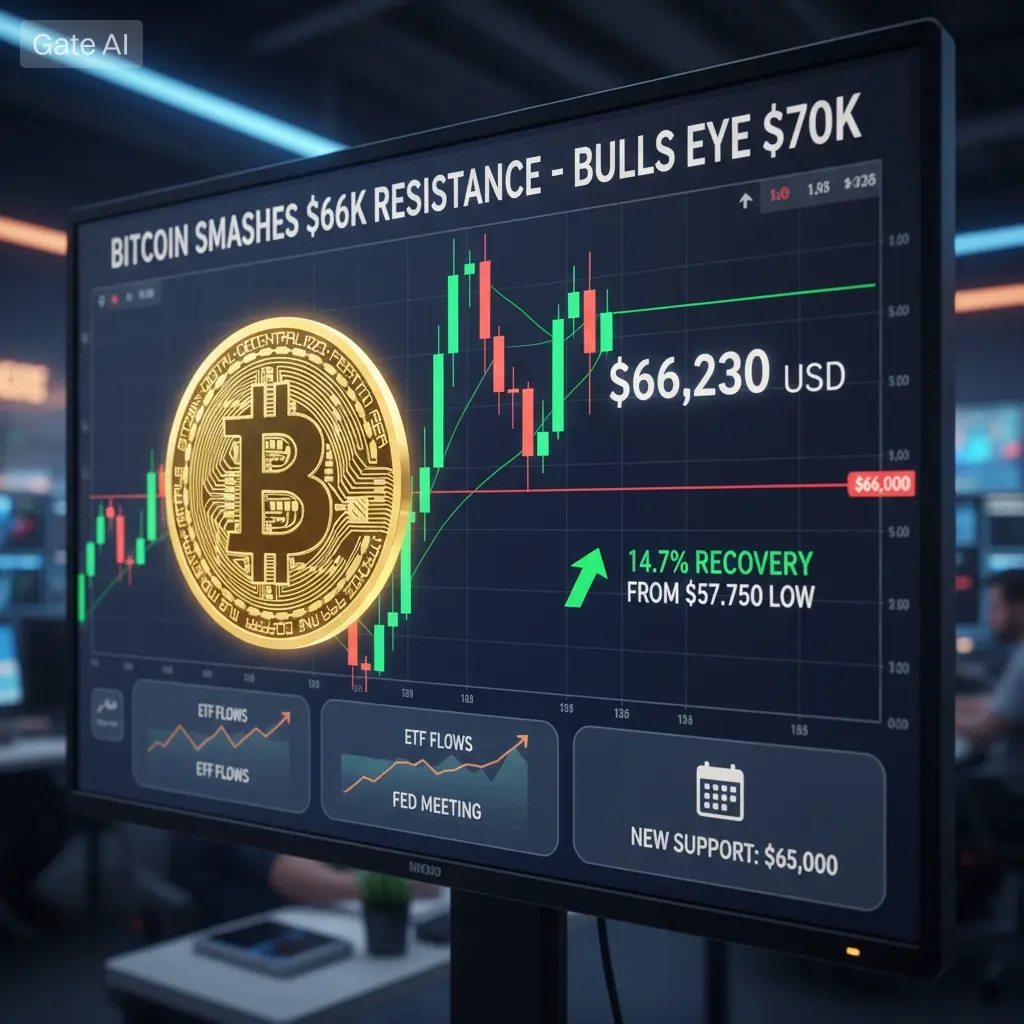
Bitcoin has officially reclaimed the $66,000 psychological resistance, currently trading around $66,230, and this breakout is one of the most significant technical developments the cryptocurrency market has witnessed in 2026.
After spending weeks struggling below this barrier, BTC has finally forced a decisive breakout, completely changing short-term market structure. The recovery has been nothing short of remarkable. From the July 2 low near $57,750 to today's price around $66,230, Bitcoin has gained approximately 14.7% in less than three weeks. Compared with the June closing price near $58,558, BTC has climbed more than 13.1%, while remaining nearly 47% below the October 2025 all-time high around $126,000, reminding investors that despite this impressive rally, Bitcoin still has significant room before revisiting historical highs.
The speed of this recovery surprised almost everyone. During the first week of July, bearish sentiment dominated the market as analysts openly discussed the possibility of Bitcoin falling toward $50,000 or even $40,000 before another sustainable bull market could begin. Instead, buyers stepped in aggressively. More than $450 million worth of short positions were liquidated when Bitcoin reclaimed $62,000, creating a powerful short squeeze. As BTC continued climbing through $63,000, $64,000, $65,000, and eventually $66,000, additional forced liquidations accelerated upside momentum.
Every percentage gain forced more short sellers to buy back Bitcoin, creating a chain reaction that strengthened the rally and dramatically shifted market psychology from fear toward cautious optimism.
Technically, the breakout above $66,000 is extremely important because this level had acted as one of Bitcoin's strongest resistance zones throughout July. Multiple rallies failed beneath this area, reinforcing sellers' confidence. Now that buyers have successfully pushed above it, market structure has changed. The former resistance around $65,000 is attempting to transform into new support, one of the strongest bullish confirmations technicians watch for after a breakout. If Bitcoin successfully holds above $65,000 during the coming sessions, the probability of continuing toward $68,000, $69,000, and even $70,000 increases substantially. A successful support flip usually signals that institutional buyers are willing to defend higher prices rather than simply chasing momentum.
The significance of this rally becomes even clearer when viewed within Bitcoin's broader 2026 performance. Bitcoin entered 2026 above $93,000, before suffering one of the sharpest corrections of the ETF era. During June alone, Spot Bitcoin ETFs experienced approximately $4.5 billion in net outflows, marking their worst monthly performance on record. Bitcoin finished June around $58,558, representing a decline of almost 37% from the beginning of the year and over 53% below the October 2025 peak. Fear dominated the market, leverage was flushed out, retail participation collapsed, and institutional confidence weakened considerably. Yet within only a few weeks, Bitcoin recovered nearly 15%, proving once again that crypto markets can reverse direction faster than traditional financial assets.
Several powerful macroeconomic catalysts have supported this recovery. June US employment data showed only 57,000 new jobs, significantly below expectations, increasing hopes that the Federal Reserve will avoid further interest rate hikes. Lower employment growth reduces inflationary pressure, encouraging expectations for a more accommodative monetary policy later this year. Softer inflation readings also weakened the US Dollar Index, improving conditions for risk assets such as Bitcoin, Ethereum, and technology stocks. Historically, periods of dollar weakness have frequently coincided with stronger cryptocurrency performance because investors become more willing to move capital into higher-risk assets offering greater long-term growth potential.
Crypto-specific developments have been equally supportive. After June's record ETF outflows, institutional selling pressure appears to be easing. Early July has seen ETF flows stabilize, with several sessions returning to positive territory. Although inflows remain far below the record levels witnessed during 2024, even moderate institutional demand has been sufficient to absorb available selling pressure while Bitcoin trades above $64,000. Confidence has also improved after BlackRock CEO Larry Fink reiterated that he remains constructive on Bitcoin and digital assets over the coming twelve months. BlackRock's Rick Rieder additionally highlighted that trillions of dollars could eventually rotate into higher-yielding investment opportunities if macroeconomic conditions improve, further strengthening long-term optimism surrounding digital assets.
On-chain data also supports the recovery narrative. Exchange reserves continue declining as investors withdraw Bitcoin into private wallets rather than leaving coins available for immediate sale. The Exchange Whale Ratio has fallen steadily after reaching elevated levels during June's selloff, indicating reduced selling activity from large holders. Wallet addresses containing Bitcoin continue increasing despite recent volatility, suggesting long-term accumulation rather than distribution. Historically, shrinking exchange balances combined with expanding wallet growth have frequently preceded sustained bullish trends because available supply becomes increasingly constrained while long-term ownership expands.
Chart patterns further strengthen the bullish argument. Many analysts believe Bitcoin is forming a large Inverse Head and Shoulders pattern on the daily timeframe. The left shoulder developed around $58,000, the head formed near the $57,750 July bottom, while the right shoulder emerged during the recovery through $63,000-$64,000. The neckline sits close to $66,000, meaning today's breakout potentially activates one of technical analysis' strongest reversal formations. If confirmed through several daily closes above the neckline, measured move projections suggest significantly higher upside targets over the coming weeks.
Support and resistance levels have now become critically important. Immediate support lies at $65,000, followed by $64,000, where Bitcoin consolidated before accelerating higher. Stronger structural support extends between $60,000-$62,000, aligning with Fibonacci retracement levels, previous consolidation zones, and major psychological support. Below this region, $58,000 and the $57,750 July low represent the final defensive line for bulls. Losing those levels would invalidate the recovery and reopen downside risks toward $50,000 or even $40,000.
On the upside, Bitcoin has already cleared $66,000, making $68,000 the next important resistance. Above that sits the major $69,000-$70,000 zone where several technical indicators converge. Daily RSI would approach 70, historically signaling overbought conditions where profit-taking often accelerates. Kitco's technical analysis also identifies this region as an important exit zone for short-term traders. Beyond $70,000, attention shifts toward $76,327, followed by $80,000-$80,123, representing approximately 21% upside from current prices. Additional long-term resistance appears near $86,500, while reclaiming the previous all-time high near $126,000 would require another rally exceeding 90% from current levels.
Market sentiment has improved dramatically but remains divided. Many investors who experienced June's collapse remain cautious, preferring confirmation above $65,000 before committing additional capital. Others believe Bitcoin has already established a major cycle bottom, citing improving macroeconomic conditions, stabilizing ETF flows, declining exchange reserves, increasing wallet growth, and strengthening technical structures as evidence that accumulation has begun.
Institutional participation appears to be gradually returning, although far more slowly than during previous bullish phases.
Looking ahead, three realistic scenarios remain possible. The base case expects Bitcoin to consolidate between $64,000-$70,000 while awaiting the Federal Reserve meeting later this month. A bullish scenario sees Bitcoin maintaining support above $65,000, breaking $68,000, reclaiming $70,000, and potentially extending toward $80,000, representing an additional 20% gain from current prices.
Continued ETF inflows and improving macroeconomic conditions could later support moves toward $90,000-$100,000, representing gains of approximately 36%-51% from today's level. More optimistic analysts project $120,000-$170,000, while some extremely bullish forecasts even discuss $189,000-$250,000, although those outcomes require exceptional macroeconomic and institutional support.
The bearish scenario remains equally important to monitor. Failure to defend $65,000 would weaken bullish momentum significantly. A decline below $64,000 could reopen downside toward $62,000, followed by $60,000, and potentially a full retest of $58,000-$57,750. Renewed ETF outflows, unexpectedly hawkish Federal Reserve decisions, stronger US dollar performance, worsening geopolitical tensions, or another major crypto-specific shock could quickly reverse current optimism.
For traders, disciplined risk management remains essential. Conservative investors may consider accumulating gradually during pullbacks toward $64,000-$65,000, while protecting positions below $60,000 depending on individual risk tolerance. Existing long positions may benefit from partial profit-taking between $68,000-$70,000, allowing investors to lock in gains while maintaining exposure if momentum continues. Short sellers should remain patient, waiting for clear exhaustion signals near major resistance rather than fighting strong bullish momentum prematurely.
Overall, Bitcoin's recovery above $66,000 represents far more than another daily price increase. It reflects improving macroeconomic conditions, stabilizing institutional demand, strengthening on-chain fundamentals, healthier technical structure, and gradually rebuilding investor confidence. The coming weeks—particularly Bitcoin's ability to defend $65,000 and the outcome of the upcoming Federal Reserve meeting—will determine whether this rally evolves into a genuine trend reversal or proves to be another temporary recovery within a broader correction. For now, however, momentum clearly favors the bulls, and Bitcoin has once again reminded the market why it remains the world's leading digital asset.@Gate_Square #SummerCreationCamp

repost-content-media
  • Reward
  • 2
  • Repost
  • Share
Yusfirah:
LFG 🔥
View More
#EsportsTradingSeason
🎮 Gate's eSports Peak Trading Season Has Officially Begun!
The excitement surrounding global eSports has reached an entirely new level as Gate officially launches its "eSports Peak Trading Season," combining the thrill of competitive gaming with the fast-growing world of prediction markets.
Whether you are a passionate esports fan, an experienced prediction market trader, or someone looking to explore a completely new way of participating in major tournaments, this campaign provides a unique opportunity to transform your knowledge of competitive gaming into trading opp
ESPORTS-5.52%
HighAmbition
#EsportsTradingSeason
🎮 Gate's eSports Peak Trading Season Has Officially Begun!
The excitement surrounding global eSports has reached an entirely new level as Gate officially launches its "eSports Peak Trading Season," combining the thrill of competitive gaming with the fast-growing world of prediction markets.
Whether you are a passionate esports fan, an experienced prediction market trader, or someone looking to explore a completely new way of participating in major tournaments, this campaign provides a unique opportunity to transform your knowledge of competitive gaming into trading opportunities while competing for an impressive 200,000 USDT prize pool.
This year's eSports calendar is packed with some of the biggest tournaments in the industry. The Esports World Cup (EWC), League of Legends Pro League (LPL), League of Legends Champions Korea (LCK), Counter-Strike championships, Dota 2 international competitions, and Valorant global events are all taking place during the campaign period.
Millions of viewers from around the world are following every match, every strategy, every roster change, and every championship battle, creating one of the most exciting seasons the competitive gaming industry has ever experienced. Every series, every map, and every final now becomes more engaging because traders can actively participate through prediction markets instead of simply watching the action unfold.
Through Gate Polymarket's eSports Prediction Market, participants can predict match winners, tournament outcomes, championship winners, and many other event-based scenarios using market-driven prediction mechanisms. Rather than relying purely on luck, successful prediction trading rewards users who carefully analyze team performance, player form, historical statistics, drafting strategies, head-to-head records, tournament momentum, and overall market sentiment before making their predictions. This creates an experience where research, timing, and strategic thinking become valuable advantages.
One of the biggest highlights of this campaign is the generous 200,000 USDT reward pool, designed to reward both active traders and newcomers. Users who complete the weekly prediction trading missions can unlock up to 200 USDT worth of Prediction Market Experience Vouchers, allowing them to participate in additional prediction activities while expanding their trading experience. These weekly missions encourage consistent participation throughout the event instead of focusing on only a single day, giving every participant multiple opportunities to earn rewards.
Competitive traders can also battle for a place on the Trading Volume Leaderboard, where the Top 100 users will collectively share an impressive 50,000 USDT in rewards. Every completed prediction contributes toward climbing the rankings, making consistency, strategy, and active participation the keys to securing a higher position. As trading activity increases throughout the campaign, competition for leaderboard positions is expected to become increasingly intense, making every prediction potentially valuable.
Gate has also prepared exclusive incentives for newcomers who have never participated in eSports prediction markets before. New users who complete their very first eligible prediction task will receive additional exclusive newcomer rewards, making this one of the best opportunities for beginners to explore prediction trading without feeling left behind by experienced participants. Whether you are completely new to prediction markets or already familiar with market-based forecasting, the campaign provides incentives suitable for every level of experience.
The diversity of available prediction markets makes this campaign especially exciting. Instead of predicting only final tournament winners, participants can engage with a wide variety of markets covering individual match results, playoff advancement, championship destinations, tournament performance, and many other competitive outcomes. Every prediction represents an opportunity to apply your understanding of the professional gaming scene while competing against market expectations generated by thousands of participants worldwide.
As esports continues to expand into one of the fastest-growing entertainment industries globally, prediction markets are becoming an increasingly popular way for fans to interact with tournaments beyond traditional viewing experiences. By combining competitive gaming with blockchain-powered prediction markets, Gate continues expanding innovative opportunities where entertainment, market analysis, and community participation come together within a single ecosystem.
📅 Event Period: July 20, 2026, 16:00 – August 10, 2026, 16:00 (UTC+8)
🎯 Whether you support your favorite League of Legends, Dota 2, Counter-Strike, or Valorant teams, now is the perfect time to turn your esports knowledge into prediction opportunities, complete weekly missions, compete for leaderboard rewards, and claim your share of the 200,000 USDT prize pool. Every prediction matters, every match creates new opportunities, and every successful decision could move you closer to the top of the rankings during Gate's biggest eSports prediction event of the season.
#Gate #EsportsTradingSeason #EWC #SummerCreationCamp
@Gate_Square
repost-content-media
  • Reward
  • 1
  • Repost
  • Share
Yusfirah:
To The Moon 🌕
#VIPExclusive4%APY
Gate VIP Exclusive 4% APY — The Ultimate Complete Guide to Maximizing Your USDT Passive Income Through Gate VIP Benefits, Simple Earn, GT Holdings, and Wealth Hub
Gate has consistently positioned itself as one of the world's leading cryptocurrency exchanges by building an ecosystem where users are rewarded not only for trading but also for holding assets, participating in platform activities, and utilizing long-term wealth management products. Instead of leaving idle USDT sitting inside a Spot account where it earns no return, Gate provides the VIP Exclusive 4% APY campaign
HighAmbition
#VIPExclusive4%APY
Gate VIP Exclusive 4% APY — The Ultimate Complete Guide to Maximizing Your USDT Passive Income Through Gate VIP Benefits, Simple Earn, GT Holdings, and Wealth Hub
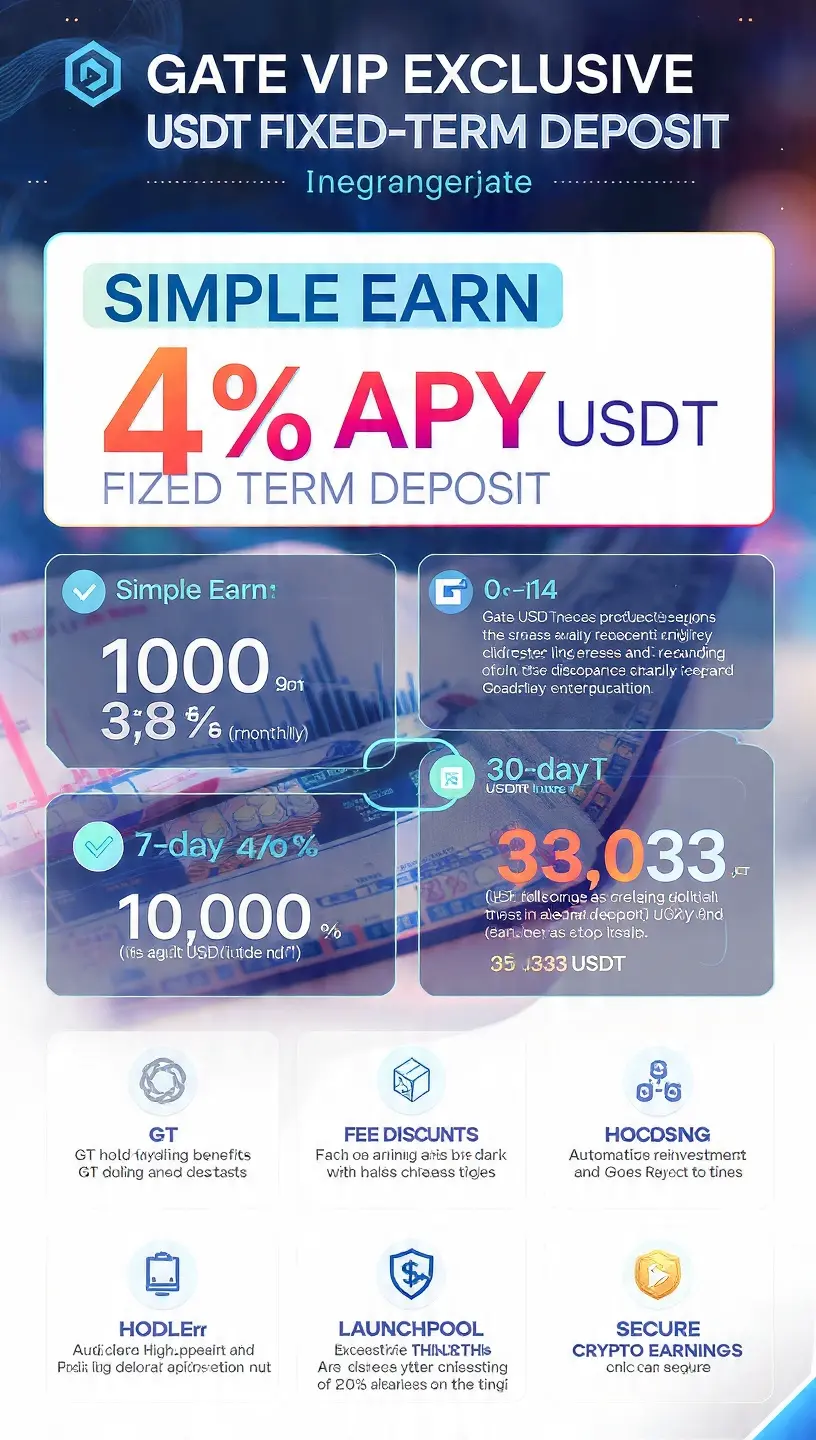
Gate has consistently positioned itself as one of the world's leading cryptocurrency exchanges by building an ecosystem where users are rewarded not only for trading but also for holding assets, participating in platform activities, and utilizing long-term wealth management products. Instead of leaving idle USDT sitting inside a Spot account where it earns no return, Gate provides the VIP Exclusive 4% APY campaign through Simple Earn, allowing eligible VIP users to transform unused stablecoins into a reliable source of passive income. This promotion demonstrates how long-term platform participation can unlock higher annual yields, lower trading fees, premium investment products, and additional ecosystem rewards. Whether you hold 5,000 USDT or manage a six-figure portfolio, understanding how every component of the VIP ecosystem works can significantly improve your overall capital efficiency.
The VIP Exclusive 4% APY campaign is a limited-time USDT Fixed-Term Simple Earn product available exclusively to eligible VIP users. Unlike speculative trading, where profits depend entirely on market direction, this product offers a predetermined Annual Percentage Yield (APY), allowing investors to estimate earnings before subscribing. Gate currently offers both 7-Day and 30-Day Fixed-Term USDT products, with returns increasing according to VIP level. Entry-level VIP users generally receive around 2.0% APY, while VIP 12 through VIP 14 can earn approximately 4.0% APY, effectively doubling passive income without increasing investment capital.
The financial impact becomes much clearer when viewed through practical examples.
Depositing 10,000 USDT into the 30-Day product at 4.0% APY generates approximately 33.33 USDT during one monthly cycle while preserving the original principal. A balance of 25,000 USDT earns roughly 83.33 USDT each month, 50,000 USDT produces around 166.67 USDT, and 100,000 USDT can generate approximately 333.33 USDT every month. Over an entire year, assuming continuous reinvestment, total earnings become even higher through compound growth. Rather than allowing stablecoins to remain idle, investors create a predictable stream of passive income while maintaining liquidity for future trading opportunities.
Gate applies different APY rates according to VIP status. VIP 0 through VIP 4 generally receive approximately 2.0% APY, producing around 3.84 USDT every seven days for each 10,000 USDT subscribed. VIP 5 increases the return to roughly 2.2%, generating approximately 4.22 USDT weekly. VIP 6 reaches about 2.4%, VIP 7 approximately 2.6%, VIP 8 around 2.8%, VIP 9 about 3.0%, VIP 10 approximately 3.2%, VIP 11 around 3.6%, while VIP 12, VIP 13, and VIP 14 receive the maximum annualized yield of approximately 4.0%, producing nearly 7.69 USDT every week on each 10,000 USDT invested. The difference becomes substantial for investors managing large stablecoin portfolios throughout the year.
Simple Earn functions as one of Gate's core wealth management services. Idle digital assets are matched with borrowing demand inside the platform's secured lending ecosystem, allowing deposited USDT to generate interest instead of remaining inactive. Gate manages collateral requirements, borrower matching, automated settlement, interest distribution, and principal repayment. Investors do not negotiate directly with borrowers or monitor loan repayments because the entire process is handled automatically by the platform's infrastructure.
Flexible Earn products allow deposits and withdrawals almost any time, providing greater liquidity but generally offering lower yields. Fixed-Term products require funds to remain locked for predefined periods such as seven or thirty days in exchange for significantly higher annualized returns. The VIP Exclusive campaign belongs to this Fixed-Term category, making it particularly attractive for users who already intend to hold USDT before deploying capital elsewhere.
Interest calculation begins at 00:00 UTC on the day following successful subscription. Throughout the investment period, accumulated earnings can be monitored directly through the Gate application or website. Upon maturity, both principal and earned interest are automatically transferred back into the Spot account, usually within one hour, allowing immediate access for trading, transfers, or another investment cycle.
One of the strongest features of Simple Earn is Auto-Renew. Instead of manually subscribing every time a product matures, users can activate automatic reinvestment so that principal and earned interest are subscribed into the next available Fixed-Term product whenever quota remains available. Every new investment cycle begins with a slightly larger balance, creating compound growth. Over twelve months, this strategy increases total earnings beyond simple interest because future returns are calculated on previously accumulated profits.
Participation is straightforward. Users first complete Gate account registration and mandatory KYC verification, transfer USDT into the Spot Wallet, navigate to the Simple Earn section, select the VIP Exclusive USDT Fixed-Term product, choose either the 7-Day or 30-Day option, enter the subscription amount, review estimated earnings, confirm participation, and allow interest accumulation to begin on the following day. Throughout the investment period, earnings remain visible within the platform, while maturity automatically returns principal and interest without requiring manual redemption.
Gate provides three independent methods for achieving VIP status. The first is maintaining sufficient account assets above the required threshold. The second is holding the required average amount of GT over the previous fourteen days. Eligible GT includes Spot balances, GT placed in open orders, GT held inside supported financial products, and GT transferred into Margin accounts, while borrowed GT obtained through leverage is excluded. The third qualification method depends upon thirty-day trading volume, combining Spot and Futures activity using Gate's weighting formula. Satisfying any one of these requirements is sufficient for VIP qualification.
GT Token serves as the backbone of the Gate ecosystem and delivers benefits extending well beyond VIP qualification. GT holders receive trading fee discounts through GT Debit, reducing transaction costs below standard VIP rates. Active traders executing substantial monthly volume can save hundreds or even thousands of USDT annually through lower fees. GT also unlocks HODLer Airdrops, providing access to free token distributions from newly launched blockchain projects. Participation limits increase alongside VIP level, with the highest tiers enjoying significantly larger allocations. GT holders additionally receive access to Launchpool opportunities, allowing them to stake tokens before official exchange listings and earn newly issued assets that may appreciate following public trading.
Wealth Hub further expands passive income opportunities by bringing together multiple financial products inside one integrated dashboard. Users can compare Flexible Earn, Fixed-Term Earn, staking products, structured investments, and promotional campaigns while monitoring portfolio performance from a single interface. Instead of managing multiple services independently, Wealth Hub centralizes investment opportunities, making capital allocation significantly more efficient.
Compared with traditional banking products, a 4.0% annualized return on USDT is highly competitive. Many conventional savings accounts continue offering between 0.1% and 1.0% annually, while higher-yield banking products often require lengthy lock-up periods, large minimum deposits, or complicated application procedures. Gate enables investors to maintain exposure to a digital dollar asset while earning competitive returns and preserving the ability to redeploy capital into cryptocurrency markets immediately after maturity.
Security remains one of the most important considerations for passive income products. Gate employs multiple institutional-grade protection mechanisms, including overcollateralized lending, multi-signature wallet architecture, separation of cold and hot wallets, automated liquidation procedures, continuous monitoring systems, compliance controls, and real-time risk management. These measures are designed to strengthen platform stability while protecting user assets throughout the lending cycle.
Experienced investors often maximize returns by preparing USDT balances before subscription windows open because premium Fixed-Term quotas frequently become fully subscribed within a short period. Activating Auto-Renew minimizes idle capital, while comparing the additional benefits of upgrading to the next VIP tier helps determine whether increased APY, lower trading fees, larger Launchpool allocations, and expanded HODLer Airdrop eligibility justify additional GT holdings or trading activity. Many users also diversify between 7-Day and 30-Day products, maintaining short-term liquidity while maximizing annualized returns on long-term holdings.
Another effective strategy involves combining several Gate ecosystem products simultaneously. Investors may hold GT to qualify for higher VIP levels, reduce trading fees using GT Debit, subscribe idle USDT into Fixed-Term Simple Earn, participate in Launchpool before new token listings, claim HODLer Airdrops whenever available, and utilize Wealth Hub to monitor all investments from one location. Instead of relying on a single income source, this diversified approach creates multiple streams of passive returns while improving overall portfolio efficiency.
Ultimately, the Gate VIP Exclusive 4% APY campaign represents much more than a temporary promotional event. It reflects Gate's long-term strategy of rewarding loyal users through higher passive income, premium financial products, reduced trading expenses, exclusive investment opportunities, and a continuously expanding ecosystem. Every increase in VIP level directly improves earning potential, making the progression from approximately 2.0% APY to approximately 4.0% APY financially meaningful for investors holding significant USDT balances. By combining GT holdings, VIP benefits, Simple Earn, Auto-Renew, Wealth Hub, Launchpool participation, HODLer Airdrops, and disciplined capital management, users can transform idle stablecoins into a consistent long-term source of passive income while keeping funds positioned for future opportunities across the cryptocurrency market.
repost-content-media
  • Reward
  • 1
  • Repost
  • Share
Yusfirah:
To The Moon 🌕
#AnthropicTapsSamsungForAIchips
ANTHROPIC TAPS SAMSUNG FOR AI CHIPS — THE AI HARDWARE RACE JUST ENTERED A NEW PHASE
The artificial intelligence industry is no longer competing only through better models—it is now fighting for the computing power that makes those models possible. Reports that Anthropic is turning to Samsung for AI chip manufacturing highlight a major shift in the global AI ecosystem. This isn't just another business partnership; it reflects how access to advanced semiconductor production has become one of the most valuable strategic assets in the technology world.
For years,
2In1
#AnthropicTapsSamsungForAIchips
ANTHROPIC TAPS SAMSUNG FOR AI CHIPS — THE AI HARDWARE RACE JUST ENTERED A NEW PHASE
The artificial intelligence industry is no longer competing only through better models—it is now fighting for the computing power that makes those models possible. Reports that Anthropic is turning to Samsung for AI chip manufacturing highlight a major shift in the global AI ecosystem. This isn't just another business partnership; it reflects how access to advanced semiconductor production has become one of the most valuable strategic assets in the technology world.
For years, AI development was measured by the quality of algorithms and research breakthroughs. Today, the conversation has changed. The biggest challenge is securing enough high-performance chips to train and deploy increasingly sophisticated AI systems. Every new generation of large language models demands exponentially more computational power, making chip manufacturing capacity one of the industry's biggest competitive advantages.
Samsung's role in this partnership is particularly significant. As one of the world's leading semiconductor manufacturers, the company brings advanced fabrication capabilities that could help Anthropic expand its AI infrastructure while reducing dependence on limited manufacturing capacity elsewhere. Diversifying production is becoming a strategic necessity as demand for AI accelerators continues to outpace global supply.
This move also reflects a broader trend across the AI industry. Leading AI companies are investing heavily in custom hardware rather than relying solely on off-the-shelf solutions. Purpose-built AI chips can improve efficiency, reduce operating costs, and optimize performance for increasingly complex workloads. Hardware is rapidly becoming as important as software in determining who leads the next generation of artificial intelligence.
The partnership could also reshape competition across the semiconductor sector. Every major technology company is racing to secure reliable chip production, while manufacturers are expanding advanced fabrication capabilities to meet unprecedented demand. The AI boom is creating opportunities not only for software developers but also for the companies building the physical infrastructure behind modern computing.
For investors and market observers, this development reinforces an important reality: the AI revolution extends far beyond chatbots and applications. Semiconductor manufacturing, cloud infrastructure, memory technology, and supply chain resilience are becoming critical pillars of the digital economy. Companies that control these layers may hold long-term strategic advantages as AI adoption continues to accelerate.
At the same time, partnerships like this demonstrate how interconnected the global technology ecosystem has become. Innovation now depends on collaboration between AI developers, chip designers, foundries, cloud providers, and enterprise customers. No single company can dominate every layer of the AI stack alone.
As AI continues evolving, the race will no longer be won solely by the smartest models—it will also be won by those with the strongest infrastructure. The future of artificial intelligence will be shaped not only by brilliant software engineers but also by the silicon, factories, and manufacturing partnerships powering the next generation of intelligent systems.
The next chapter of AI leadership isn't just about intelligence—it's about who controls the hardware that makes intelligence possible.
repost-content-media
  • Reward
  • 2
  • Repost
  • Share
Yusfirah:
LFG 🔥
View More
#Get2SharesOfSKHynixAtZeroCost
𝗛𝗼𝘄 𝗦𝗞 𝗛𝘆𝗻𝗶𝘅 𝗜𝘀 𝗕𝗲𝗻𝗲𝗳𝗶𝘁𝗶𝗻𝗴 𝗙𝗿𝗼𝗺 𝗧𝗵𝗲 𝗚𝗿𝗼𝘄𝗶𝗻𝗴 𝗔𝗜 𝗥𝗲𝘃𝗼𝗹𝘂𝘁𝗶𝗼𝗻 𝗔𝗻𝗱 𝗪𝗵𝘆 𝗔𝗱𝘃𝗮𝗻𝗰𝗲𝗱 𝗠𝗲𝗺𝗼𝗿𝘆 𝗧𝗲𝗰𝗵𝗻𝗼𝗹𝗼𝗴𝘆 𝗜𝘀 𝗕𝗲𝗰𝗼𝗺𝗶𝗻𝗴 𝗢𝗻𝗲 𝗢𝗳 𝗧𝗵𝗲 𝗠𝗼𝘀𝘁 𝗜𝗺𝗽𝗼𝗿𝘁𝗮𝗻𝘁 𝗣𝗮𝗿𝘁𝘀 𝗢𝗳 𝗧𝗵𝗲 𝗚𝗹𝗼𝗯𝗮𝗹 𝗧𝗲𝗰𝗵 𝗜𝗻𝗱𝘂𝘀𝘁𝗿𝘆
Artificial Intelligence is changing almost every part of the technology world. From chatbots and smart assistants to self-driving systems and scientific research, AI needs powerful hardware to process huge amounts of information. Behind every advanced AI model is a
EagleEye
#Get2SharesOfSKHynixAtZeroCost
𝗛𝗼𝘄 𝗦𝗞 𝗛𝘆𝗻𝗶𝘅 𝗜𝘀 𝗕𝗲𝗻𝗲𝗳𝗶𝘁𝗶𝗻𝗴 𝗙𝗿𝗼𝗺 𝗧𝗵𝗲 𝗚𝗿𝗼𝘄𝗶𝗻𝗴 𝗔𝗜 𝗥𝗲𝘃𝗼𝗹𝘂𝘁𝗶𝗼𝗻 𝗔𝗻𝗱 𝗪𝗵𝘆 𝗔𝗱𝘃𝗮𝗻𝗰𝗲𝗱 𝗠𝗲𝗺𝗼𝗿𝘆 𝗧𝗲𝗰𝗵𝗻𝗼𝗹𝗼𝗴𝘆 𝗜𝘀 𝗕𝗲𝗰𝗼𝗺𝗶𝗻𝗴 𝗢𝗻𝗲 𝗢𝗳 𝗧𝗵𝗲 𝗠𝗼𝘀𝘁 𝗜𝗺𝗽𝗼𝗿𝘁𝗮𝗻𝘁 𝗣𝗮𝗿𝘁𝘀 𝗢𝗳 𝗧𝗵𝗲 𝗚𝗹𝗼𝗯𝗮𝗹 𝗧𝗲𝗰𝗵 𝗜𝗻𝗱𝘂𝘀𝘁𝗿𝘆
Artificial Intelligence is changing almost every part of the technology world. From chatbots and smart assistants to self-driving systems and scientific research, AI needs powerful hardware to process huge amounts of information. Behind every advanced AI model is a combination of processors, storage, and memory working together. This is why semiconductor companies are receiving more attention than ever before.
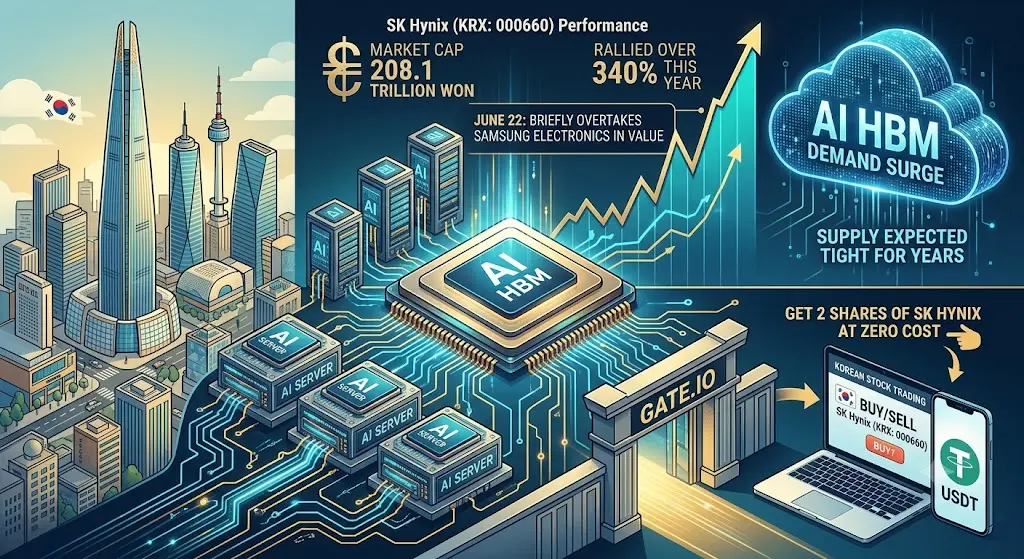
One company that has benefited from this trend is SK Hynix. As demand for AI hardware continues to increase, the company has become one of the leading suppliers of advanced memory solutions. Investors have started paying close attention because memory is no longer just another computer component—it has become a key part of modern AI infrastructure.
𝗪𝗵𝗮𝘁 𝗜𝘀 𝗛𝗶𝗴𝗵 𝗕𝗮𝗻𝗱𝘄𝗶𝗱𝘁𝗵 𝗠𝗲𝗺𝗼𝗿𝘆?
High Bandwidth Memory, often called HBM, is designed to move data much faster than traditional memory. AI models constantly process enormous datasets, and that requires memory that can deliver information quickly and efficiently. Faster memory allows powerful processors to work at their best without waiting for data.
As AI applications continue to grow, the demand for HBM is expected to remain strong. Building this technology is complex, so supply cannot always increase as quickly as demand. This balance between supply and demand has made HBM one of the most important technologies in today's semiconductor industry.
𝗪𝗵𝘆 𝗦𝗞 𝗛𝘆𝗻𝗶𝘅 𝗜𝘀 𝗚𝗮𝗶𝗻𝗶𝗻𝗴 𝗔𝘁𝘁𝗲𝗻𝘁𝗶𝗼𝗻
SK Hynix has invested heavily in advanced memory technology over the years. Those investments are now becoming more valuable as AI companies require better hardware for training and running large AI models. Strong demand has helped improve the company's market position and attracted interest from investors around the world.
This also shows how quickly industries can change. A few years ago, many people focused mainly on software companies. Today, hardware manufacturers that provide essential technology for AI are becoming equally important.
𝗧𝗵𝗲 𝗕𝗶𝗴𝗴𝗲𝗿 𝗣𝗶𝗰𝘁𝘂𝗿𝗲
The growth of AI is creating opportunities across the entire technology ecosystem. Chip designers, memory manufacturers, cloud service providers, networking companies, and data center operators all benefit when AI adoption increases.
Instead of looking at only one company, it is often helpful to understand how the entire industry works. Companies supporting different parts of the AI supply chain may all experience growth as businesses continue investing in artificial intelligence.
𝗠𝘆 𝗜𝗻𝘀𝗶𝗴𝗵𝘁
One of the biggest lessons from the AI boom is that innovation creates opportunities in unexpected places. While many people focus on AI applications, the companies building the hardware behind those applications are just as important.
Learning about semiconductors, memory technology, and AI infrastructure helps investors and technology enthusiasts better understand why certain companies attract so much attention during periods of rapid innovation.
𝗜𝗻𝘃𝗲𝘀𝘁𝗶𝗻𝗴 𝗪𝗶𝘁𝗵 𝗔 𝗟𝗼𝗻𝗴-𝗧𝗲𝗿𝗺 𝗠𝗶𝗻𝗱𝘀𝗲𝘁
Strong share price performance often creates excitement, but successful investing should always be based on research rather than emotion. Understanding a company's products, financial health, competitive advantages, and future growth opportunities is more important than simply following market trends.
Diversification and patience remain valuable principles. Markets can move up and down, but informed decisions are usually built on knowledge instead of short-term excitement.
𝗚𝗹𝗼𝗯𝗮𝗹 𝗔𝗰𝗰𝗲𝘀𝘀 𝗧𝗼 𝗡𝗲𝘄 𝗠𝗮𝗿𝗸𝗲𝘁𝘀
As investment platforms continue expanding, more people can explore companies listed in international markets. This gives investors an opportunity to learn about businesses outside their home countries and understand how different economies contribute to global technological progress.
Access to international stocks also encourages people to study industries such as semiconductors, robotics, renewable energy, and artificial intelligence from a broader perspective.
𝗙𝗶𝗻𝗮𝗹 𝗧𝗵𝗼𝘂𝗴𝗵𝘁𝘀
Artificial intelligence is still developing, and its future will depend on both software and hardware. Companies that produce advanced memory and semiconductor technology play a critical role in making AI faster, smarter, and more efficient.
Whether you are interested in technology or investing, following developments in the semiconductor industry can provide valuable knowledge about where innovation is heading. The most successful learners and investors are often those who stay curious, continue researching, and make decisions based on facts instead of market hype.
repost-content-media
  • Reward
  • 2
  • Repost
  • Share
ybaser:
2026 GOGOGO 👊
View More
#PredictionMarketsHitRecordVolume
Prediction Markets Hit Record Volume: Gate Leads the Next Generation of Event Markets
Prediction markets have rapidly evolved into one of the fastest-growing sectors of the digital asset industry. What was once a niche blockchain application focused on election forecasts has expanded into a global ecosystem covering sports, cryptocurrencies, financial markets, macroeconomic events, technology, artificial intelligence, entertainment, and major world events. As adoption continues to accelerate, these markets have become an important source of real-time sentimen
BTC0.86%
ETH2.15%
HighAmbition
#PredictionMarketsHitRecordVolume
Prediction Markets Hit Record Volume: Gate Leads the Next Generation of Event Markets
Prediction markets have rapidly evolved into one of the fastest-growing sectors of the digital asset industry. What was once a niche blockchain application focused on election forecasts has expanded into a global ecosystem covering sports, cryptocurrencies, financial markets, macroeconomic events, technology, artificial intelligence, entertainment, and major world events. As adoption continues to accelerate, these markets have become an important source of real-time sentiment and probability discovery.
According to multiple industry reports, prediction market activity reached record levels during the first quarter of 2026. Monthly trading activity climbed to approximately $25.7 billion in March 2026, representing an increase of 10.6% from February. Other industry datasets reported activity near $23.7 billion, compared with roughly $1.9 billion during the same period in 2025, highlighting more than 12x year-over-year growth.
Industry momentum continues to strengthen. Following approximately $64 billion in activity during 2025, several market analysts estimate that annual prediction market volume could exceed $300 billion during 2026 if current trends continue. Longer-term forecasts from industry research suggest the sector has the potential to approach $1 trillion in annual activity over the coming years as institutional participation, AI-powered analytics, and broader adoption expand.
One of the biggest catalysts has been the 2026 FIFA World Cup. Global football events have generated exceptionally high engagement, with markets covering match results, tournament progression, goal totals, player performance, and championship outcomes. Public market data indicates that sports-related prediction activity exceeded $7 billion during the tournament's opening stages, while weekly industry activity climbed to approximately $10.8 billion, setting new records for event-based markets.
Digital asset markets continue to contribute significantly to industry growth. Bitcoin-related prediction markets attracted hundreds of thousands of participants and generated more than $5.4 billion in reported activity during the first quarter of 2026. Ethereum-related markets exceeded $1.1 billion, while growing interest in AI, macroeconomics, technology, and financial events continues to expand the overall market.
Amid this rapid growth, Gate has continued enhancing its prediction market ecosystem by integrating Polymarket into its platform. The integration simplifies access for eligible users, allowing them to explore prediction markets through a familiar exchange interface using supported digital assets.
Gate has also introduced a wide range of platform improvements designed to enhance market discovery and user experience. Intelligent search, personalized recommendations, trending event categories, comprehensive portfolio management, transaction history, and improved market navigation help users follow developments across sports, crypto, finance, and technology more efficiently.
One of the platform's standout additions is the Smart Money analytics system. Public market data, historical performance metrics, portfolio allocation insights, and market activity indicators provide users with additional analytical tools for understanding market behavior. AI-generated summaries, probability analytics, market sentiment indicators, and detailed event statistics further strengthen the research experience.
The trading interface has also been upgraded with improved order execution, enhanced sports event pages, tournament navigation, live event monitoring, professional charting tools, and integrated analytics. Prediction Market Live brings together liquidity trends, market activity, and analytical insights into a unified dashboard, giving users a clearer view of changing market conditions.
For users who prefer on-chain participation, Gate also offers a DEX Prediction Market built on Polygon infrastructure. The platform supports self-custodial access, transparent settlement, advanced charting, professional order books, and analytical tools while maintaining compatibility with the broader prediction market ecosystem.
Supporting these developments is Gate Research, which regularly publishes reports exploring prediction market structure, AI-assisted forecasting models, liquidity dynamics, digital asset trends, and the long-term evolution of event markets. These reports examine how artificial intelligence and blockchain technology are reshaping information discovery across global markets.
Looking ahead, the outlook for prediction markets remains strong. Continued innovation, expanding institutional participation, growing retail interest, improvements in AI-powered analytics, and increasing integration across digital finance are expected to support further growth throughout 2026 and beyond.
With ongoing investment in platform development, analytics, research, user experience, and market infrastructure, Gate continues to strengthen its position within the evolving prediction market ecosystem. As event-based markets continue expanding across sports, digital assets, technology, and global events, the platform remains focused on delivering accessible tools and innovative solutions for users around the world.
repost-content-media
  • Reward
  • 2
  • Repost
  • Share
Yusfirah:
To The Moon 🌕
View More
#USMayPCEInflationRisesTo4.1%HighestIn3Years
The United States Personal Consumption Expenditures (PCE) Price Index, the Federal Reserve's preferred inflation gauge, accelerated to 4.1% year-over-year in May 2026, rising from 3.8% in April and marking the highest inflation reading in more than three years. The stronger-than-expected report immediately changed market expectations for future monetary policy, as investors now anticipate interest rates remaining higher for longer. This shift has strengthened the U.S. dollar, pushed Treasury yields sharply higher, tightened global liquidity conditi
HighAmbition
#USMayPCEInflationRisesTo4.1%HighestIn3Years
The United States Personal Consumption Expenditures (PCE) Price Index, the Federal Reserve's preferred inflation gauge, accelerated to 4.1% year-over-year in May 2026, rising from 3.8% in April and marking the highest inflation reading in more than three years. The stronger-than-expected report immediately changed market expectations for future monetary policy, as investors now anticipate interest rates remaining higher for longer. This shift has strengthened the U.S. dollar, pushed Treasury yields sharply higher, tightened global liquidity conditions, and triggered broad-based selling across cryptocurrencies, while defensive assets such as gold continued attracting capital.
Unlike previous inflation surprises, this report arrived when cryptocurrency markets were already experiencing weakening momentum, declining institutional demand, and persistent ETF outflows. As a result, the inflation data accelerated an already fragile market structure, increasing volatility and forcing traders to reassess both short-term positioning and long-term portfolio allocation.
Understanding the Inflation Data
Headline PCE inflation increased to 4.1%, compared with 3.8% in April, while monthly inflation rose 0.3%. At the same time, Core PCE, which excludes food and energy prices and is closely monitored by Federal Reserve policymakers, climbed to 3.4% from 3.3%, representing its highest level since October 2023. These figures confirm that inflation remains significantly above the Federal Reserve's long-term 2% target, making immediate monetary easing increasingly unlikely.
For financial markets, persistent inflation is not simply an economic statistic—it directly influences borrowing costs, liquidity availability, investor confidence, and overall risk appetite.
Every additional month of elevated inflation increases the probability that interest rates will remain restrictive, limiting the flow of capital into speculative assets such as cryptocurrencies while improving the attractiveness of government bonds and other yield-generating investments.
Current Market Performance
The inflation surprise produced an immediate reaction across global financial markets. Bitcoin traded between $59,547 and $60,895, recording a 24-hour decline of 2.8%, a 7-day loss of 8.4%, a 30-day decline of 14.7%, and a 90-day correction of 26.3%, leaving the world's largest cryptocurrency approximately 68% below its all-time high near $108,000. Ethereum underperformed even further, trading between $1,556 and $1,572, falling 4.1% in 24 hours, 12.6% over seven days, 21.3% during the last month, and 38.7% over the previous ninety days, remaining almost 92% below its historical peak of $4,878.
While cryptocurrencies weakened, Gold climbed to approximately $4,005 per ounce, after touching an intraday high of $4,067, gaining 0.9% in 24 hours, 2.4% in one week, 6.8% over thirty days, and 18.4% over ninety days, reflecting continued investor demand for traditional inflation hedges. Meanwhile, WTI crude oil traded near $69.45 per barrel and Brent crude near $74.02, both extending recent declines as easing geopolitical tensions reduced supply concerns. U.S. Treasury yields also moved sharply higher, with the 10-Year yield reaching 4.412%, up 11 basis points following the PCE release, while the 2-Year yield stood at 4.148%, reinforcing expectations of tighter financial conditions.
Liquidity, Trading Volume and Institutional Positioning
One of the most important developments following the inflation report was the significant deterioration in cryptocurrency market liquidity.
Bitcoin's 24-hour spot trading volume surged to approximately $48.7 billion, representing a 58% increase above its thirty-day average, while the seven-day average daily volume reached $41.2 billion, up 47%. However, despite stronger trading activity, Bitcoin futures open interest declined to $31.4 billion, falling 17.34% during the previous month, indicating that much of the increased volume resulted from liquidation and position reduction rather than fresh bullish capital entering the market.
Market liquidity also weakened considerably. Bid-ask spreads on major exchanges widened by 42% around the critical $60,000 price level, while buy-side market depth across the ten largest exchanges declined by 26% within 2% of spot price. This combination of higher trading volume and lower market depth suggests that relatively modest sell orders are now capable of producing significantly larger price movements, increasing the probability of sharp intraday volatility and flash crashes during periods of negative macroeconomic news.
Ethereum displayed even greater weakness.
Spot trading volume climbed to $28.9 billion, approximately 71% above average, while the seven-day average reached $24.6 billion, increasing 64%. Despite higher activity, Ethereum futures open interest fell to $14.8 billion, declining 19.7% over the last month, while long liquidations totaled approximately $1.12 billion during the previous seven days, representing nearly 78% of all cryptocurrency liquidations. Across the broader digital asset market, total 24-hour trading volume expanded to roughly $118 billion, increasing 52% after the PCE release, whereas the overall crypto market capitalization declined to approximately $2.18 trillion, falling 9.4% during the previous month.
Bitcoin dominance remained stable at 52.8%, indicating that investors continued rotating capital away from higher-risk altcoins toward relatively safer large-cap assets.
Institutional positioning also remained weak.
Bitcoin Spot ETFs recorded cumulative outflows of approximately $6.39 billion, with 26 of the previous 30 trading sessions showing net withdrawals, while Ethereum ETFs experienced nearly $412 million in outflows during the last fourteen days. Persistent ETF redemptions suggest that institutional investors remain cautious and continue reducing exposure until inflation shows a convincing downward trend.
Bitcoin and Ethereum Technical Outlook
From a technical perspective, Bitcoin remains under heavy pressure near the psychologically important $60,000 level. Immediate support is located between $60,000 and $59,500, followed by stronger structural support between $57,000 and $58,000, while the broader long-term support zone extends between $50,000 and $55,000. On the upside, major resistance remains at $63,100, followed by $65,000, $67,200-$67,500, while the 200-week moving average currently stands near $62,457.
Momentum indicators continue favoring sellers, with the Daily RSI at 39, Weekly RSI at 34, and Monthly RSI at 41, while the MACD remains bearish across both daily and weekly timeframes. Retail positioning also shows approximately 70.5% of traders remaining long, historically acting as a contrarian bearish signal whenever excessive optimism persists during declining markets.
Ethereum continues exhibiting even higher volatility because of its greater sensitivity to risk sentiment. The $1,500 level represents the primary psychological and technical support, followed by additional support between $1,400 and $1,450, while a deeper correction could extend toward $1,200-$1,300. Resistance remains near $1,600, followed by $1,708 and $1,750, with Ethereum needing to reclaim and hold above $1,750 before a sustainable recovery can be considered technically credible.
Market Outlook and Investment Strategy
If inflation remains above 4% and upcoming economic reports continue surprising to the upside, the Federal Reserve may maintain restrictive monetary policy for longer than markets currently expect. Under this bearish scenario, Bitcoin could revisit the $50,000-$55,000 region, while Ethereum could decline toward $1,200-$1,400 as institutional investors continue reducing exposure and liquidity conditions remain weak. A more neutral outcome would likely keep Bitcoin trading between $55,000 and $65,000 and Ethereum between $1,400 and $1,800, allowing markets to consolidate while waiting for additional inflation data. A bullish recovery would require a significantly softer June PCE report, renewed ETF inflows, improving liquidity, and growing expectations that the Federal Reserve may eventually begin easing monetary policy, potentially allowing Bitcoin to recover above $67,000 while Ethereum advances toward $2,000.
For investors, disciplined risk management remains essential. Long-term participants may continue gradual Dollar-Cost Averaging while reducing position sizes until a confirmed market bottom develops. Short-term traders should prioritize high-liquidity support and resistance zones, avoid excessive leverage, and maintain strict stop-loss strategies because thinner liquidity can produce unusually sharp price swings. Maintaining portfolio diversification, including a 10-20% allocation to gold as an inflation hedge together with adequate cash reserves, may help reduce overall portfolio volatility during this uncertain macroeconomic environment.
The 4.1% PCE inflation reading has clearly reinforced the bearish short-term outlook for cryptocurrency markets. Rising trading volumes accompanied by declining futures open interest, persistent ETF outflows, weakening market depth, and reduced institutional participation collectively suggest that investors remain defensive despite periodic relief rallies. Although the long-term fundamentals supporting Bitcoin and Ethereum adoption remain intact, current price action continues to be driven primarily by macroeconomic conditions rather than blockchain-specific developments.
The next major catalyst will be the June 2026 PCE report, scheduled for release in late July. A meaningful decline below 3.8% could improve market confidence, weaken the U.S. dollar, reduce Treasury yields, and encourage renewed institutional participation. However, another elevated inflation reading would likely strengthen expectations for prolonged monetary tightening, intensify selling pressure across digital assets, and extend the current correction. Until inflation shows a sustained path toward the Federal Reserve's 2% objective, investors should prioritize capital preservation, disciplined portfolio management, and careful risk control while preparing for continued volatility across Bitcoin, Ethereum, gold, oil, and the broader global financial markets.@Gate_Square
repost-content-media
  • Reward
  • 3
  • Repost
  • Share
Yusfirah:
To The Moon 🌕
View More
#Get2SharesOfSKHynixAtZeroCost
SK Hynix stands as one of the most compelling semiconductor investments in the current market environment. Trading at approximately 1772 USDT, this South Korean memory chip giant has captured significant attention from institutional and retail traders alike. The company currently holds the position as the world's second-largest memory chip manufacturer and has emerged as a critical supplier to the booming artificial intelligence industry.
Current Market Position and Price Action
SK Hynix has demonstrated remarkable strength in recent trading sessions. The stock
HighAmbition
#Get2SharesOfSKHynixAtZeroCost
SK Hynix stands as one of the most compelling semiconductor investments in the current market environment. Trading at approximately 1772 USDT, this South Korean memory chip giant has captured significant attention from institutional and retail traders alike. The company currently holds the position as the world's second-largest memory chip manufacturer and has emerged as a critical supplier to the booming artificial intelligence industry.
Current Market Position and Price Action
SK Hynix has demonstrated remarkable strength in recent trading sessions. The stock gained 0.98 percent on the last trading day, rising from 1772 USDT to 1790 USDT. Over the past two weeks, the price has surged by an impressive 25.98 percent, with gains recorded in nine out of the last ten trading days. This momentum reflects the market's growing confidence in the company's AI-driven growth trajectory.
The stock has experienced notable volatility, with intraday fluctuations reaching 10.19 percent, ranging from a day low of 1680 USDT to a high of 1850 USDT. Such volatility presents both opportunities and risks for traders, requiring careful position management and risk control measures.
Fundamental Analysis and Growth Drivers
The primary catalyst driving SK Hynix's valuation remains its dominant position in High Bandwidth Memory (HBM) production. As AI applications expand exponentially, demand for HBM chips has outpaced supply, creating a favorable pricing environment. SK Hynix has secured major supply contracts with leading AI chip manufacturers, ensuring revenue visibility through multi-year agreements.
The company recently unveiled its AIN (AI NAND) Family strategy at the 2025 OCP Global Summit, targeting rapidly growing AI inference workloads with NAND solutions optimized for performance, bandwidth, and density. Additionally, SK Hynix has completed development of HBM4, the next-generation high-bandwidth memory for ultra-high performance AI applications, featuring industry-leading speed and power efficiency.
Analyst sentiment remains overwhelmingly positive. Wall Street analysts have raised their average one-year price target for SK Hynix to 1772 USDT, with high forecasts reaching 2900 USDT. Goldman Sachs maintains a buy rating with a target of 2400 USDT, representing approximately 35 percent upside potential. Nomura has set an even more bullish target of 2700 USDT, suggesting 52 percent upside from current levels. Hanwha recently raised their price target to 2900 USDT, arguing the company has evolved beyond pure cyclical memory plays thanks to long-term agreements and HBM leadership.
Technical Analysis and Key Levels
From a technical perspective, SK Hynix presents mixed signals. The short-term moving average currently indicates a sell signal, while the long-term moving average provides a buy signal. Since the short-term average remains above the long-term average, the overall technical outlook remains constructive.
Critical support levels to monitor include the 1680 USDT zone, which has recently acted as a floor during volatile sessions. A more significant structural support zone exists between 1050 and 1060 USDT, representing a potential accumulation area on deeper pullbacks.
Resistance levels are forming around the recent high of 1850 USDT. A sustained breakout above this level could open the path toward the 2100 USDT psychological barrier and eventually the analyst consensus target zone of 2400 to 2900 USDT.
According to short-term trend analysis, the stock shows potential for substantial appreciation over the next three months, with projections suggesting possible gains of 190.33 percent. Statistical models indicate a 90 percent probability of the price holding between 4500 USDT and 5800 USDT by the end of this three-month period, though traders should treat such projections with appropriate caution.
Market Sentiment and Trader Psychology
Social media sentiment on platforms like X reflects broadly constructive views on SK Hynix's prospects. Traders and analysts emphasize the AI infrastructure story, with reports indicating HBM capacity is sold out into next year. The company's planned US Nasdaq ADR listing around July 10 has generated additional excitement, expected to boost visibility and liquidity among global investors.
However, some traders have expressed caution following recent sharp intraday drops triggered by Korean regulatory crackdowns on leveraged ETFs. These mechanical selling events created temporary pressure but do not reflect underlying fundamental weakness. Korea's June export data, showing growth exceeding 85 percent year-over-year, supports the bullish case for upcoming earnings strength.
Risk Factors and Bearish Considerations
Despite the positive outlook, several risks warrant attention. Competition from Samsung in HBM4 market share could pressure margins and prompt modest de-rating. The company's market cap briefly surpassed Samsung for the first time since 2000, which some technical analysts interpret as a potential overheating signal.
Broader macroeconomic factors including US dollar strength and potential rotation away from technology stocks could weigh on the shares. The semiconductor industry remains cyclical, and any slowdown in AI capital expenditure could impact demand expectations.
Trading Strategy Recommendations
For conservative investors, accumulating positions on dips toward the 1680 to 1720 USDT support zone offers a favorable risk-reward profile. Stop-losses should be placed below 1650 USDT to protect against deeper corrections.
For active traders, the current volatility environment supports range-trading strategies between 1680 and 1850 USDT until a clear directional breakout emerges. Breakout traders should watch for sustained moves above 1850 USDT with volume confirmation as a signal to initiate long positions targeting 2100 USDT initially.
Risk management remains paramount given the stock's demonstrated volatility. Position sizing should reflect individual risk tolerance, with appropriate diversification across sectors and asset classes.
Gate Get2Shares Promotion Details
Gate Exchange is currently running an exceptional promotion that allows users to receive up to 2 shares of SK Hynix at zero cost. This represents approximately 3400 USDT in value based on current prices.
The promotion runs from June 23, 2026, at 09:00 UTC through June 30, 2026, at 16:00 UTC. Participation requires trading within the Gate Stocks section, specifically focusing on Korean stocks including SK Hynix and Samsung Electronics.
To qualify for the maximum reward of 2 SK Hynix shares, users must achieve cumulative trading volume of 10000 USDT across eligible stocks. For every 10000 USDT in trading volume, participants receive random SK Hynix airdrops ranging from 0.01 to 0.5 shares equivalent. The total prize pool consists of 200 shares distributed by trading volume ranking.
New users who have never traded stocks before can participate in the registration prize pool, with the first 2000 registrants sharing 3400 USDT equivalent in SK Hynix fractional shares. Additionally, first-time traders of SK Hynix and Samsung Electronics who reach 500 USDT cumulative trading volume receive 5 to 17 USDT equivalent in SK Hynix rewards.
To participate, users must click the Register Now button on the event page. On the web platform, navigate to Stocks then Korean Stocks section. On the mobile application version 8.25.0 or higher, access through TradFi, then Stocks, then Markets, then Korean Stocks.
Rewards are credited within 14 business days after the event concludes. The minimum fractional share unit is 0.01 shares, with any smaller amounts distributed as USDT instead.
Conclusion and Outlook
SK Hynix represents a compelling investment opportunity driven by the structural AI memory demand supercycle. The company's technological leadership in HBM, combined with long-term supply agreements and expanding AI applications, supports a bullish multi-year outlook.
Near-term volatility from leveraged ETF flows and competitive dynamics may create entry opportunities for patient investors. The current price around 1772 USDT offers exposure to a transformative technology trend with substantial upside potential toward analyst targets of 2400 to 2900 USDT.
Traders should maintain disciplined risk management while positioning for the continued AI infrastructure buildout. The Gate Get2Shares promotion provides an excellent opportunity to acquire SK Hynix exposure at zero cost through active trading participation.
For those seeking exposure to the AI revolution through a leading memory chip manufacturer with demonstrated technological superiority and strong earnings momentum, SK Hynix warrants serious consideration. The combination of fundamental strength, technical setup, and promotional incentives creates a favorable environment for both short-term traders and long-term investors.
@Gate_Square #Get2SharesOfSKHynixAtZeroCost
repost-content-media
  • Reward
  • 3
  • Repost
  • Share
Yusfirah:
2026 GOGOGO 👊
View More
#MicronOvertakesMetaInMarketValue
Micron Technology is one of the world's leading semiconductor companies, headquartered in Boise, Idaho, United States. Founded in 1978, Micron specializes in designing and manufacturing memory and storage solutions, including DRAM (Dynamic Random Access Memory), NAND flash, and HBM (High Bandwidth Memory) chips. These components are essential building blocks for computers, smartphones, data centers, automotive systems, and increasingly, artificial intelligence infrastructure. Micron operates globally with manufacturing facilities in the United States, Japan,
HighAmbition
#MicronOvertakesMetaInMarketValue
Micron Technology is one of the world's leading semiconductor companies, headquartered in Boise, Idaho, United States. Founded in 1978, Micron specializes in designing and manufacturing memory and storage solutions, including DRAM (Dynamic Random Access Memory), NAND flash, and HBM (High Bandwidth Memory) chips. These components are essential building blocks for computers, smartphones, data centers, automotive systems, and increasingly, artificial intelligence infrastructure. Micron operates globally with manufacturing facilities in the United States, Japan, Singapore, and other regions, employing thousands of engineers and technicians. The company trades on NASDAQ under the ticker symbol MU and has transformed from a traditional cyclical memory chip manufacturer into one of the most strategically valuable companies in the AI era, commanding market positions that were once reserved for software and platform giants.
On June 25, 2026, Micron Technology achieved a historic milestone by overtaking Meta Platforms in market capitalization for the first time ever. Micron's stock surged approximately 18.4% to reach $1,236 per share, pushing its market value to roughly $1.398 trillion. Meta Platforms, meanwhile, held a market capitalization of approximately $1.392 trillion. The difference between the two stood at around $6 billion, a narrow but symbolically powerful gap that signaled a fundamental shift in how investors value technology companies in the AI era. Micron even briefly surpassed Tesla's market value of $1.4 trillion during the same trading session, further underscoring the magnitude of this achievement.
Market value, also known as market capitalization, refers to the total monetary worth of a publicly traded company, calculated by multiplying the current share price by the total number of outstanding shares. When Micron's share price rose dramatically, the multiplication effect caused its overall valuation to leap past Meta's, even though Meta has far more diversified revenue streams and billions of users across its platforms. This crossover demonstrates that investor sentiment and strategic positioning in emerging technology sectors can rapidly reshape market hierarchies.
The primary driver behind Micron's extraordinary ascent has been the explosive demand for HBM chips used in AI data centers. Every advanced AI accelerator, including those produced by Nvidia, requires HBM stacks positioned alongside the processing units to handle the massive data throughput that AI models demand. Micron's HBM3E and upcoming HBM4 products have become critical components in this supply chain, making the company an indispensable partner for the world's largest technology corporations building AI infrastructure.
Micron's fiscal third-quarter earnings report, released on June 24, 2026, provided the immediate catalyst for the stock surge. Revenue reached $41.46 billion, representing a more than fourfold increase from $9.3 billion in the same quarter one year earlier. This 346% revenue growth rate is among the highest ever recorded by a major American technology company, reflecting how dramatically the AI boom has expanded Micron's business. The company forecast fourth-quarter revenue of approximately $50 billion, compared to just $11.3 billion in the prior year period, indicating that growth momentum continues to accelerate rather than plateau.
The most remarkable financial metric was Micron's gross margin expansion. Gross margins climbed to 84.9%, more than doubling from 39% in the same quarter a year ago. This figure surpassed Nvidia's gross margin of 75% and Meta's gross margin of 81.9%, making Micron the new margin king among all major U.S. technology companies. CFO Mark Murphy confirmed on the earnings call that fiscal Q3 gross margin was a new company record and the highest percentage among top-tier American tech firms. This margin improvement reflects the pricing power that Micron now commands in the HBM market, where supply constraints and long-term contracts have shifted the dynamics favorably toward manufacturers.
Micron has also secured its revenue trajectory through 16 long-term agreements with customers spanning data centers, automotive, and other sectors. These contracts range from three to five years and have locked in approximately $22 billion in committed financial arrangements. CEO Sanjay Mehrotra stated that Micron is investing at record levels in technology, products, and supply to address customers' rapidly growing demand. This unprecedented revenue visibility substantially reduces the cyclical risk that has historically plagued memory chip investing and provides investors with confidence that the current growth trajectory is sustainable beyond a single quarter.
While Micron has been surging, Meta Platforms has faced significant headwinds that have compressed its valuation. Meta's stock traded in the $542 to $555 range during late June 2026, with the stock generating sell signals from both short-term and long-term moving averages. Meta has fallen in 7 of the last 10 trading sessions, declining approximately 3.96% over that period. Daily trading volume has been moderate, ranging between 5 million and 17 million shares, compared to Micron's 70 million to 85 million shares daily. The core challenge facing Meta is investor skepticism about its massive capital expenditure commitments. Meta has allocated between $125 billion and $145 billion for capital spending in 2026, a figure that raises serious questions about when these investments will generate measurable returns. Reality Labs, Meta's metaverse and hardware division, continues to burn approximately $4 billion per quarter on revenue of just $402 million, creating a persistent drag on overall profitability. As analyst Dan Ives noted, Meta and Microsoft are being treated by investors like they are wearing winter jackets to the beach in the summer, a vivid metaphor for growing impatience with AI buildout costs that have not yet translated into visible growth.
This market cap crossover underscores that AI infrastructure and semiconductor companies are commanding the greatest attention and investment flows in the current market. Memory chip manufacturers have transitioned from commodity businesses subject to boom-bust cycles into indispensable infrastructure providers for the AI revolution. Samsung Electronics joined the $1 trillion market cap club earlier in 2026, and SK Hynix has filed for a massive $29.4 billion Nasdaq ADR listing, the second-largest U.S. listing on record after SpaceX. These developments confirm that the entire memory chip sector is being re-rated by investors who recognize the strategic importance of these companies in enabling the AI economy.
For Micron, current price stands around $1,213 per share with a 52-week range of $103 to $1,255. The stock has delivered 268% year-to-date returns and approximately 763% over the trailing twelve months. Beta is 2.98, indicating extreme volatility relative to the broader market. Short-term support levels are located in the $1,038 to $1,050 zone where the stock recently bounced during pullbacks. Long-term support sits at approximately $880 based on moving averages. Resistance is established at $1,255, the 52-week high, and a decisive breakout above this level could open the path toward $1,300 and potentially higher. However, some analytical models flag caution, with targets around $731 suggesting approximately 30% downside potential if AI momentum falters and margins normalize from peak levels. The consensus analyst rating is Buy with 30 analysts covering the stock.
For Meta, current price trades around $542 to $555 with a 52-week range of $520 to $796. The stock holds sell signals from both short-term and long-term moving averages, creating a bearish technical picture in the near term. Support levels begin around $520 to $540, representing the 52-week low and current floor. Stronger structural support exists between $488 and $500, which would likely attract buyers if tested. Resistance levels are positioned at $600, then $650 to $700, and ultimately at $796, the annual high. Despite the weak technical picture, analyst consensus remains overwhelmingly bullish with 57 buy ratings and zero sells. Several models project a 12-month target of $801, implying nearly 48% upside from current levels, driven by accelerating advertising revenue, expanding AI product offerings, and a forward P/E ratio in the mid-teens that represents a meaningful discount to historical valuations.
Trading strategy for Micron requires careful risk management given the elevated volatility. A prudent approach involves scaling into positions during pullbacks toward the $1,050 to $1,100 support zone rather than chasing the stock at elevated levels. Position sizing should reflect the 2.98 beta and the possibility of 8% to 13% daily price swings. Stop-loss placement below $1,000 provides reasonable protection while allowing room for normal volatility. Investors should monitor quarterly margin guidance closely, as the 84.9% gross margin represents peak conditions that may normalize if supply constraints ease or competition intensifies from Samsung and SK Hynix.
Trading strategy for Meta presents a contrarian opportunity at current levels. Gradual accumulation in the $520 to $540 zone with stop-loss protection below $500 captures the potential upside to analyst targets of $700 to $800 while limiting downside exposure. The forward P/E ratio in the mid-teens provides valuation support even if near-term earnings face pressure from elevated capital expenditures. Dollar-cost averaging is appropriate given the ongoing volatility, and investors should watch for catalysts including the September Connect conference, consumer AI product launches, and enterprise AI revenue disclosures that could shift sentiment positively.
The broader implications of this market cap crossover extend well beyond Micron and Meta individually. It signals that investors are fundamentally reassessing which companies hold the most strategic value in the AI era. Companies that supply the physical infrastructure enabling AI development are commanding premium valuations, while companies spending heavily on AI deployment face questions about return timelines. The four largest technology companies, Amazon, Microsoft, Meta, and Google, collectively plan to spend approximately $650 billion on AI infrastructure in 2026, representing a roughly 60% increase over their combined 2025 spending. This unprecedented concentration of capital expenditure directly benefits Micron and other memory manufacturers, creating a feedback loop where Big Tech spending drives memory demand, which drives Micron revenue, which drives Micron stock price, which ultimately pushes Micron's market cap above the very companies that are fueling its growth.
The coming quarters will be decisive in determining whether Micron can sustain its market position above Meta or whether Meta's underlying business strengths enable it to reclaim market value leadership. Earnings execution, guidance updates, competitive dynamics in the HBM market, and broader investor sentiment toward AI investments will all drive relative performance. Both companies remain essential holdings for technology-focused portfolios, though their distinct risk profiles demand different position sizing and risk management approaches. Micron offers exposure to the AI infrastructure buildout with higher volatility and momentum characteristics, while Meta provides diversified technology exposure at a potentially attractive value entry point.
@Gate_Square #MicronOvertakesMetaInMarketValue
repost-content-media
  • Reward
  • 3
  • Repost
  • Share
Yusfirah:
2026 GOGOGO 👊
View More
Growth point lottery Round 2️⃣0️⃣ is ongoing, come to Gate Square and be a lucky charm!
New and existing users can complete simple interaction tasks for a 100% winning rate!
Gate World Cup gift box and trading package worth $10,000U are waiting for you to draw! 💰
Seize the luck 👉 https://www.gate.com/zh/activities/pointprize?now_period=20
🎁 How to "snatch" the luck?
- Do tasks: Post and comment in the Square to easily earn points.
- Draw: Click the post button [+] to enter the [Activity Center] and draw.
👉https://www.gate.com/post
Details 👉 https://www.gate.com/announcements/article/10036
BTC0.86%
ETH2.15%
SPCX5.42%
HighAmbition
Growth point lottery Round 2️⃣0️⃣ is ongoing, come to Gate Square and be a lucky charm!
New and existing users can complete simple interaction tasks for a 100% winning rate!
Gate World Cup gift box and trading package worth $10,000U are waiting for you to draw! 💰
Seize the luck 👉 https://www.gate.com/zh/activities/pointprize?now_period=20
🎁 How to "snatch" the luck?
- Do tasks: Post and comment in the Square to easily earn points.
- Draw: Click the post button [+] to enter the [Activity Center] and draw.
👉https://www.gate.com/post
Details 👉 https://www.gate.com/announcements/article/100364
#BTC #ETH #SPCX
repost-content-media
  • Reward
  • 3
  • Repost
  • Share
Yusfirah:
LFG 🔥
View More
#BTCProbes60KKeySupportLevel
Bitcoin is currently trading at approximately $60,250, a critical juncture that places the world's leading cryptocurrency right at its key psychological support level of $60,000. This price point represents more than just a number; it embodies a battleground where macroeconomic forces, geopolitical developments, and technical market structures converge. Understanding why Bitcoin has declined to these levels requires examining multiple interconnected factors that have created sustained downward pressure on the cryptocurrency market.
The PCE Inflation Data Impact: A
HighAmbition
#BTCProbes60KKeySupportLevel
Bitcoin is currently trading at approximately $60,250, a critical juncture that places the world's leading cryptocurrency right at its key psychological support level of $60,000. This price point represents more than just a number; it embodies a battleground where macroeconomic forces, geopolitical developments, and technical market structures converge. Understanding why Bitcoin has declined to these levels requires examining multiple interconnected factors that have created sustained downward pressure on the cryptocurrency market.
The PCE Inflation Data Impact: A Major Catalyst for Decline
The most significant recent driver of Bitcoin's price weakness has been the Personal Consumption Expenditures (PCE) inflation data released for May 2026. The headline PCE inflation surged to 4.1% year-over-year, marking the first time inflation has broken above the 4.0% threshold in three years since April 2023. This reading was exactly in line with economist expectations but represented a notable acceleration from April's 3.8% figure. On a month-over-month basis, the PCE price index climbed 0.4% in May, matching April's increase and indicating persistent inflationary momentum.
The core PCE inflation, which excludes volatile food and energy components and represents the Federal Reserve's preferred inflation gauge, rose to 3.4% year-over-year in May, up from 3.3% in April. This persistent elevation in core inflation has fundamentally altered market expectations regarding Federal Reserve policy and has created significant headwinds for risk assets including Bitcoin.
When inflation runs hot at 4.1%, it signals that the Federal Reserve's battle against rising prices remains far from complete. Higher inflation erodes purchasing power and typically prompts central banks to maintain restrictive monetary policy, which reduces liquidity in financial markets. For Bitcoin, which thrives in environments of abundant liquidity and loose monetary conditions, this inflationary persistence has been distinctly bearish. The cryptocurrency has historically demonstrated strong sensitivity to real yields and liquidity conditions, making the elevated inflation print particularly damaging to price sentiment.
Federal Reserve Policy Stance: Rate Cut Expectations Diminish
The Federal Reserve's response to this inflationary environment has been equally impactful for Bitcoin's price trajectory. At its June 2026 meeting, the Federal Open Market Committee (FOMC) held interest rates steady in the range of 3.50% to 3.75%, but more importantly, signaled that rate cuts have become increasingly unlikely in the near term. Newly appointed Federal Reserve Chairman Kevin Warsh presided over his first meeting, and the central bank's updated quarterly projections indicated that policymakers now expect to potentially raise borrowing costs this year rather than cutting them.
This shift in policy expectations has been devastating for Bitcoin's price outlook. Markets had previously priced in the possibility of rate cuts that would inject liquidity into the financial system and provide a tailwind for risk assets. Instead, the Fed's hawkish pivot has created an environment where monetary policy remains restrictive. Financial markets are now pricing in approximately only a 30% chance of a rate hike at the July 28-29 meeting, but the September meeting remains very much in play for potential tightening.
The implications for Bitcoin are substantial. Higher interest rates increase the opportunity cost of holding non-yielding assets like Bitcoin, as investors can earn attractive returns in risk-free government securities. Additionally, tighter monetary conditions reduce the speculative capital that typically flows into cryptocurrency markets. The Fed's indication that inflation remains well above its 2% target and that price pressures are not dissipating has created a risk-off environment that has pressured Bitcoin lower.
Geopolitical Developments: US-Iran Talks and Market Uncertainty
Geopolitical factors have added another layer of complexity to Bitcoin's price action. Recent developments in US-Iran relations have created significant market volatility. Reports indicate that high-level diplomatic meetings have been ongoing, with negotiators traveling to Switzerland for discussions regarding Iran's nuclear program and regional de-escalation strategies. While initial reports suggested a potential peace deal that would reopen the Strait of Hormuz, subsequent developments have created uncertainty about the durability of any agreement.
The Strait of Hormuz represents one of the world's most critical oil transit chokepoints, and any disruption to its operations can cause significant volatility in global energy markets. When geopolitical tensions rise, Bitcoin often experiences selling pressure as investors seek safety in traditional safe-haven assets like the US dollar and gold. The ongoing uncertainty regarding US-Iran relations has contributed to risk-off sentiment that has weighed on cryptocurrency prices.
However, it is worth noting that Bitcoin did experience brief rallies on news of potential diplomatic breakthroughs, with prices approaching $66,000 following reports of a preliminary agreement. These moves proved unsustainable as skepticism about the deal's durability emerged, and Bitcoin subsequently retreated to current levels around $60,250. This price action demonstrates that while geopolitical relief can provide temporary bounces, the underlying macroeconomic headwinds remain dominant in determining Bitcoin's price trajectory.
Technical Analysis: The $60,000 Support Level Under Pressure
From a technical perspective, Bitcoin's current price of $60,250 places it at a critically important support level that has been tested multiple times in recent weeks. The $60,000 level represents both psychological significance and technical importance as a key support zone that has historically attracted buying interest. However, the repeated testing of this level raises concerns about its durability.
Multiple technical indicators suggest that Bitcoin is in a precarious position. The cryptocurrency has declined significantly from its recent highs near $124,000, representing a drawdown of approximately 51% from peak to current levels. This magnitude of decline indicates a bear market structure rather than a simple correction. The fact that Bitcoin has repeatedly tested the $60,000 level without mounting a sustained recovery suggests that selling pressure remains dominant.
Key support levels below the current price include the $59,000 zone, which some analysts identify as the true support level rather than $60,000. A breakdown below $59,000 could potentially open the door to much lower levels, with some analysts pointing to $57,000 as the next significant support zone. The May low near $59,130 represents a critical level that, if broken, could accelerate selling pressure and trigger stop-loss orders from leveraged positions.
On the resistance side, Bitcoin faces significant hurdles before any meaningful recovery can take hold. The $62,000 level has already been tested and rejected, and above that, the $65,000 to $67,000 zone represents a major resistance area where significant selling interest is likely to emerge. The 200-day moving average, currently situated near $77,000, represents a long-term trend indicator that Bitcoin would need to reclaim to signal a potential trend reversal.
On-Chain Data and Market Structure
Despite the price weakness, some on-chain metrics suggest that long-term holders continue to accumulate Bitcoin at current levels. This behavior is historically consistent with market bottoms, as sophisticated investors tend to increase positions during periods of fear and capitulation. However, the divergence between price action and on-chain accumulation patterns can persist for extended periods, and this data alone does not guarantee an imminent price recovery.
Open interest in Bitcoin derivatives has remained elevated, suggesting that leveraged positions remain active in the market. This elevated leverage creates the potential for significant volatility in either direction, as forced liquidations can accelerate price moves. Funding rates have remained relatively muted, indicating that aggressive directional bets are not currently dominating the market.
Macroeconomic Context: The Broader Picture
Bitcoin's decline must be understood within the broader context of global macroeconomic conditions. The combination of sticky inflation, restrictive monetary policy, and geopolitical uncertainty has created a challenging environment for risk assets across the board. Traditional equity markets have also experienced volatility, though Bitcoin's decline has been more pronounced due to its higher beta to risk sentiment.
The US dollar has strengthened in this environment, creating additional headwinds for Bitcoin. As the dollar appreciates, dollar-denominated assets like Bitcoin become more expensive for international buyers, reducing demand. Additionally, a stronger dollar typically signals tighter global financial conditions, which reduces the availability of speculative capital.
Outlook and Key Levels to Watch
Looking ahead, several critical factors will determine Bitcoin's price trajectory. The next major catalyst will be upcoming inflation data releases, including the next CPI and PCE reports. If inflation shows signs of cooling, market expectations for Fed policy could shift, potentially providing relief for Bitcoin. Conversely, continued inflationary pressure would likely maintain the current bearish environment.
The July 28-29 Federal Reserve meeting represents another key event risk. While markets currently expect rates to remain unchanged, any shift in the Fed's guidance or rhetoric could significantly impact Bitcoin prices. Chairman Warsh's communication style and policy preferences remain relatively unknown, creating uncertainty about how the central bank might respond to evolving economic conditions.
From a technical perspective, traders should monitor the $59,000 to $60,000 support zone closely. A sustained breakdown below this area could trigger accelerated selling toward $57,000 and potentially lower levels. On the upside, reclaiming $62,000 would be the first step toward a potential recovery, with $65,000 and $67,000 representing major resistance levels that would need to be overcome for a more significant rally to develop.
Conclusion
Bitcoin's current price of $60,250 reflects a confluence of bearish factors including elevated PCE inflation at 4.1%, diminished expectations for Federal Reserve rate cuts, ongoing geopolitical uncertainty surrounding US-Iran relations, and challenging technical market structure. The $60,000 level represents a critical support zone that has been repeatedly tested, and its durability remains uncertain.
Investors should remain cautious in this environment, as the combination of macroeconomic headwinds and technical weakness suggests that further downside risk remains present. However, the presence of long-term holder accumulation and the potential for policy shifts if inflation cools provide reasons to monitor the market closely for signs of a potential bottoming process. The coming weeks will be critical in determining whether Bitcoin can hold its key support levels or whether a more significant decline is in store.
@Gate_Square #BTCProbes60KKeySupportLevel
repost-content-media
  • Reward
  • 3
  • Repost
  • Share
Yusfirah:
LFG 🔥
View More
#USNetCapitalInflowsHitRecord884B
The financial world is witnessing a seismic shift that every investor needs to understand. United States net capital inflows have surged to an unprecedented $884 billion in the 12 months ending April 2026, nearly tripling since the start of 2025 and more than doubling the previous 2021 peak of approximately $400 billion. This is not just a number on a spreadsheet. This figure represents a fundamental restructuring of where global money is flowing, and the consequences are already being felt across every asset class from Bitcoin to gold to the US dollar itself
HighAmbition
#USNetCapitalInflowsHitRecord884B
The financial world is witnessing a seismic shift that every investor needs to understand. United States net capital inflows have surged to an unprecedented $884 billion in the 12 months ending April 2026, nearly tripling since the start of 2025 and more than doubling the previous 2021 peak of approximately $400 billion. This is not just a number on a spreadsheet. This figure represents a fundamental restructuring of where global money is flowing, and the consequences are already being felt across every asset class from Bitcoin to gold to the US dollar itself. The world's investors, both private and institutional, are voting with their wallets, and they are voting overwhelmingly for American financial assets.
Let us break down what this $884 billion actually means. Net capital inflows measure the difference between foreign money entering the United States and American money leaving for overseas investments. When global investors purchase US stocks, bonds, real estate, and other financial instruments in amounts far exceeding what US investors send abroad, the surplus is recorded as positive net capital inflows. The current figure tells us that $884 billion more entered the American financial system than left it during the measured period. Within this total, private purchases of US equities exploded to $763 billion in April 2026 alone, an all-time high that demonstrates massive institutional and individual demand for American stocks. Meanwhile, official institutions such as central banks and sovereign wealth funds poured in $121 billion, more than doubling their allocation since the start of 2025. These official institutional flows are particularly significant because they represent government-level confidence in the US financial system, not merely speculative private capital chasing returns.
The implications for the US dollar are profound. When $884 billion of foreign capital needs to be converted into dollars to purchase American assets, the demand for the greenback intensifies dramatically. The Dollar Index, which measures the US currency against major foreign currencies, has responded accordingly, climbing above 100 and now threatening a major breakout from a 13-month trading range. A stronger dollar creates a cascading effect across global markets. Every asset priced in dollars becomes more expensive for international buyers, reducing demand. Every alternative asset that competes with dollar-denominated investments faces a headwind. The Federal Reserve's hawkish stance, with markets now pricing in a more than 70% probability of an interest rate hike later this year, further strengthens the dollar by making US interest-bearing investments even more attractive relative to non-yielding alternatives.
Now let us examine what this means for Bitcoin and the cryptocurrency market, because the impact has been severe. Bitcoin is currently trading around $59,175 to $60,214, having crashed from its October 2025 peak of $126,000. The decline has been brutal, with Bitcoin dropping approximately 23% over the past month alone and more than 5% in a single 24-hour period on June 24. The Fear and Greed Index sits at just 13 out of 100, indicating extreme fear conditions that approach capitulation-like sentiment. This is not random volatility. The record US capital inflows are directly connected to the crypto market's distress through multiple transmission channels.
The first channel is ETF outflows. US spot Bitcoin ETFs have recorded net outflows of approximately $6.39 billion over the past 30 days, with 26 out of 30 days showing negative flows. This represents the strongest bearish institutional signal in the ETF era. When capital is rushing toward traditional US equities yielding strong returns, institutional managers are de-risking their crypto allocations. Hedge funds are reducing gross exposure. Macro managers are shifting into cash. Investment advisors are trimming risk positions. The ETF mechanism now transmits that caution directly into the Bitcoin market with unprecedented speed and volume. The cumulative ETF outflow streak of $2.97 billion over 10 consecutive sessions earlier in June was the longest withdrawal run on record, and it included a rapid exit of a $1.2 billion position that sent shockwaves through the market.
The second channel is the dollar strength connection. Bitcoin and the Dollar Index are moving in precisely opposite directions. As DXY rises toward breakout levels, Bitcoin has been rejected from bear-flag support levels and is now testing the critical $59,000 to $60,000 zone. The 200-week simple moving average sits at approximately $62,258, which has served as a key macro pivot. Bitcoin's failure to hold above this level signals deeper structural weakness. Technical analysis shows the bear flag pattern remains active, with projected downside targets potentially extending toward $47,000 if current support fails. The probability of Bitcoin falling below $50,000 in 2026 has jumped to 64% according to Polymarket data, while odds of a move below $45K stand at 46%.
The third channel is the opportunity cost argument. When $763 billion of private capital is chasing US equities that offer both income and appreciation potential in the world's most stable financial system, the relative appeal of a volatile, non-yielding digital asset diminishes considerably. The AI-driven rally in US technology stocks has created compelling alternative returns that draw capital away from speculative crypto positions. Higher US interest rates make bonds and savings instruments more competitive, further eroding Bitcoin's attractiveness as a risk-on alternative.
Adding to the crypto market pressure, Strategy Inc. (formerly MicroStrategy) disclosed in a June 1 filing that it sold 32 Bitcoin between May 26 and 31 at an average price of $77,135, raising approximately $2.5 million. This was its first Bitcoin sale since December 2022, breaking the "never sell" narrative that had been a cornerstone of Bitcoin's bullish thesis. The symbolic significance cannot be overstated. When the most prominent corporate Bitcoin advocate begins liquidating holdings, questions arise about whether further sales will follow to meet preferred dividend obligations, potentially creating sustained selling pressure. Open interest across the crypto market has fallen 17.34% to $46.41 billion, indicating that leverage has been flushed out. While this reduces cascade risk, it also signals that speculative capital is departing. Retail long positions stubbornly remain at 70.5% despite the price weakness, which contrarian analysis interprets as a warning for further downside potential. Over $1 billion in cryptocurrency positions were liquidated in a single 24-hour period as Bitcoin fell to $59,000, demonstrating the severity of the current market stress.
Now let us turn to gold, because the precious metal faces its own set of pressures from the record capital inflows. Gold is currently trading at approximately $4,033 to $4,087 per troy ounce, representing a dramatic retreat from its January 2026 all-time high above $5,500. Over the past month, gold has declined approximately 8.28%, though it remains up roughly 25% on a longer timeframe. Gold recently tested the key $4,000 support level, with analysts estimating a 60% to 70% probability that this zone represents a bottom. However, the strong dollar environment and hawkish Federal Reserve posture create substantial headwinds.
The relationship between US capital inflows and gold price pressure operates through three primary mechanisms. First, dollar strength makes gold more expensive for international buyers since the metal is priced in dollars, naturally reducing global demand. Second, rising US interest rates increase the opportunity cost of holding non-yielding gold compared to interest-bearing dollar assets. Third, the massive flow of capital into US equities creates competing returns that draw investment away from safe-haven metals. When $884 billion is flooding into American financial markets, gold's appeal as a defensive asset temporarily diminishes because the very act of massive capital entering the US system signals confidence in that system, reducing the fear-based demand that typically drives gold purchases.
However, gold's longer-term narrative remains constructive. Central banks around the world have continued their gold accumulation programs, recognizing the metal's role as a reserve asset independent of any single nation's financial system. The geopolitical environment, including tensions involving Iran and broader global uncertainties, provides ongoing safe-haven demand that could reassert itself rapidly if conditions deteriorate. Gold's retreat from $5,500 to approximately $4,000 represents a correction of roughly 27%, which in historical context is a significant but not unprecedented drawdown for a metal that has delivered decades of long-term appreciation. Year-over-year, gold remains up approximately 25%, and its 2026 year-to-date performance still shows gains of roughly 17.4% despite the recent pullback.
The broader macro picture reveals an economy attracting unprecedented global investment, a strengthening dollar that punishes alternative assets, and a Federal Reserve signaling potential rate increases that further tip the scales toward traditional US financial instruments. For crypto investors, this environment demands heightened caution. The $59,000 to $60,000 zone represents critical support, and failure here opens the path to significantly lower levels. For gold investors, the current zone around $4,000 tests whether the correction is a healthy pullback within a longer uptrend or the beginning of a deeper decline driven by dollar dominance.
For those looking to navigate these turbulent conditions, Gate stands as the premier exchange platform offering comprehensive tools for both crypto and commodity market participants. Whether managing Bitcoin positions through the current volatility or exploring gold-related trading opportunities, Gate provides the infrastructure, liquidity, and market access needed to respond effectively to these macro shifts. As the record $884 billion capital inflow story continues to unfold, having access to real-time data, professional-grade trading tools, and a trusted platform becomes more essential than ever. Gate delivers all of these capabilities with zero internal transfer fees and instant execution, ensuring investors can position themselves quickly as market conditions evolve.
The $884 billion question remains: will this unprecedented flow of foreign capital into US markets continue to expand, or will global conditions eventually redirect money back toward alternative assets? The current data suggests the trend has significant momentum, with net capital inflows having nearly tripled in just over a year. Until the dollar weakens, ETF flows reverse, or macro conditions shift meaningfully, both crypto and gold face ongoing pressure from the most powerful capital migration the modern financial world has ever recorded.@Gate_Square #USNetCapitalInflowsHitRecord884B
repost-content-media
  • Reward
  • 1
  • Repost
  • Share
Yusfirah:
2026 GOGOGO 👊
#AGLD
AGLD Technical Analysis and Trading Strategy
Adventure Gold (AGLD) is currently trading at $0.2087, showing significant volatility with a 24-hour range between $0.123 and $0.2693. The token has demonstrated strong bullish momentum with gains exceeding 80% in the past 24 hours, reaching a high of $0.2693.
Key Support and Resistance Levels
Immediate support is established at $0.1800, with stronger support zones at $0.1500 and $0.123. On the resistance side, immediate resistance sits at $0.2693 (recent high), followed by $0.3000 and $0.3250. Breaking above $0.2693 could open the path towar
AGLD-2.15%
HighAmbition
#AGLD
AGLD Technical Analysis and Trading Strategy
Adventure Gold (AGLD) is currently trading at $0.2087, showing significant volatility with a 24-hour range between $0.123 and $0.2693. The token has demonstrated strong bullish momentum with gains exceeding 80% in the past 24 hours, reaching a high of $0.2693.
Key Support and Resistance Levels
Immediate support is established at $0.1800, with stronger support zones at $0.1500 and $0.123. On the resistance side, immediate resistance sits at $0.2693 (recent high), followed by $0.3000 and $0.3250. Breaking above $0.2693 could open the path toward $0.3000, while a failure to hold $0.1800 support may trigger a pullback to $0.1500.
RSI Analysis
The RSI on the 4-hour timeframe is currently at 79.12, indicating overbought conditions. This suggests caution as the price has moved into territory where profit-taking and potential corrections are likely. When RSI exceeds 70, it typically signals that the asset may be due for a pullback or consolidation phase.
Trading Plan and Strategy
For long positions, consider entering near the $0.1800 to $0.2000 range with a stop loss below $0.1500. For short-term scalping, watch for bounces off support levels. The current price action shows extreme volatility, making risk management essential.
Stop Loss and Take Profit Levels
For a long position from current levels: SL1 at $0.1800, SL2 at $0.1500, and SL3 at $0.123. Take profit targets include TP1 at $0.2500, TP2 at $0.3000, and TP3 at $0.3500. These levels account for the recent high and potential continuation of bullish momentum if market sentiment remains positive.
Leverage Recommendation
Given the high volatility and overbought RSI conditions, conservative leverage of 2x to 3x is recommended. Higher leverage increases liquidation risk significantly in such volatile conditions. The 80% daily gain indicates strong momentum but also elevated risk of sharp corrections.
**Price Forecast**
AGLD could test $0.2500 to $0.3000 in the short term if bullish momentum continues and volume supports the move. However, with RSI in overbought territory, a pullback to $0.1800 or lower is equally probable before any sustainable uptrend continues. The next 24 to 48 hours will be critical in determining whether this is a breakout or a bull trap scenario.
Risk Warning
This analysis is for educational purposes only. Cryptocurrency trading carries substantial risk of loss. Always conduct your own research and never invest more than you can afford to lose. The overbought RSI suggests caution at current levels.
repost-content-media
  • Reward
  • 2
  • Repost
  • Share
Yusfirah:
LFG 🔥
View More
  • Pinned