#TradfiTradingChallenge
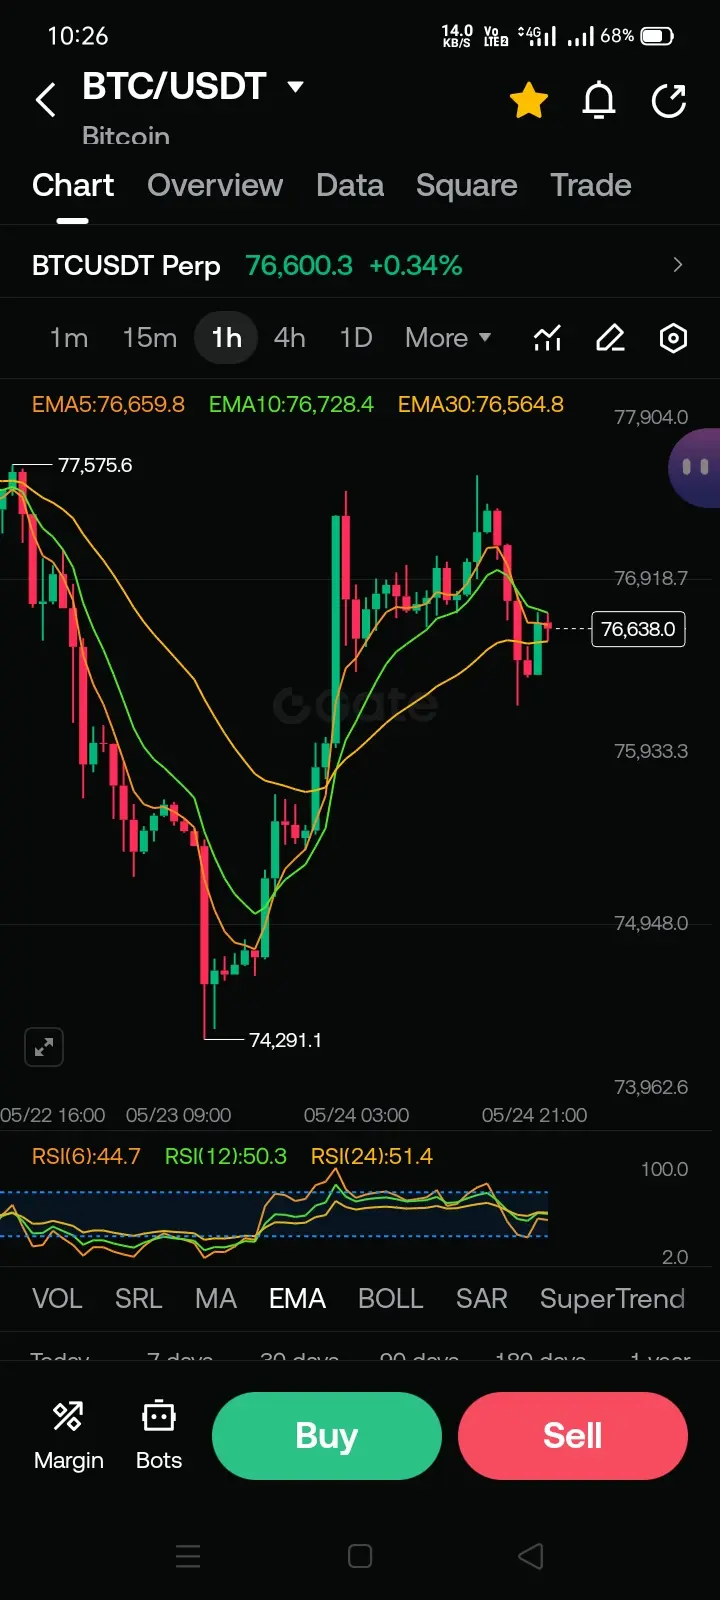
$BTC /USDT – 1H Chart Analysis
Current Price: $76,600.3
Key Levels
· Resistance: $76,638 / $76,918 / $77,904
· Support: $75,933 / $74,948 / $74,291
Moving Averages (Mixed)
· EMA5: $76,659
· EMA10: $76,728
· EMA30: $76,564
Price is trading below EMA5 and EMA10, but above EMA30. Mixed structure – not clearly bullish or bearish.
RSI (Neutral)
· RSI(6): 44.7 (weak)
· RSI(12): 50.3
· RSI(24): 51.4
RSI(6) below 50 shows short-term weakness, but RSI12 and RSI24 are near 50.
Outlook
BTC is consolidating after the bounce from $74k. Price is stuck between EMA10 and EMA30. A break above $76,728 would be bullish. A break below $76,564 would be bearish. RSI suggests no strong momentum in either direction.
Bias: Neutral. Wait for clear direction above $76,728 or below $76,564.