Share your thoughts
placeholder
Article
CRYPTO THINGS YOU MAY HAVE MISSED — LAST 24 HOURS | 7 SEPTEMBER 2026
A Bitcoin settlement network lost control of almost its entire $320M reserve—without its cryptographic keys being compromised.
That distinction exposes the risk investors often miss.
🧵👇
1/2 — 4,000 bitcoin:native LEFT LIQUID’S FEDERATION WALLET
Liquid Network said “purported white-hat hackers” withdrew roughly 4,000 of the wallet’s 4,200 BTC—worth around $320M.
The network halted new transactions and warned that Liquid wallets would be affected.
Crucially, Liquid said the withdrawal happened through SideSwap’s authorised se
post-image
BTC-1.50%
HBAR+0.47%
XLM+2.19%
XDC+3.67%
XRP-1.85%
I had just switched the app to the background when it shot right back up—are you playing hide-and-seek with me? 📈

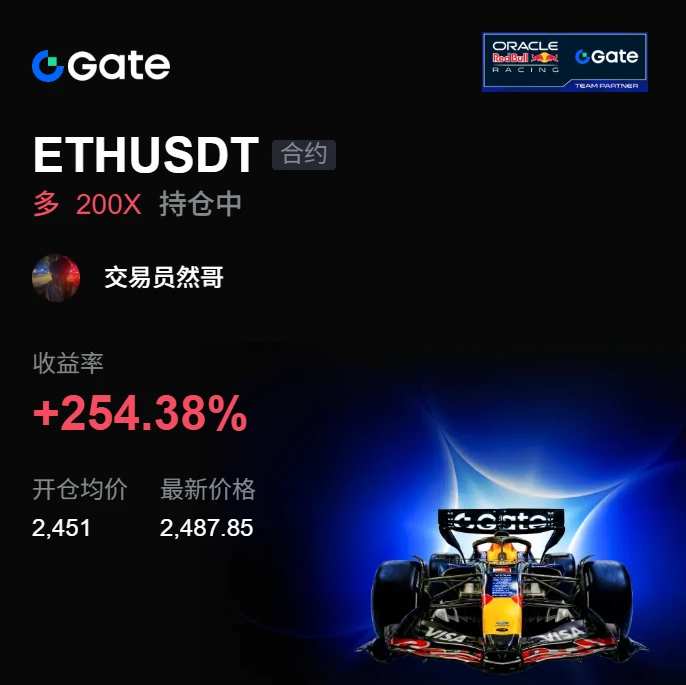
A few days ago before bed, I was thinking: $ETH had been hovering around 2451.64 for so long, never breaking the key level, while the bids were gradually thickening. Wasn’t it about to make a move? So I placed a long order, set my stop-loss, and went to sleep.

When I opened the chart in the morning: current price 2490.44, +275.3%% in the bag. That’s just ridiculous. There’s your answer, guys—this move wasn’t a waste of waiting. It dragged on for so long, but the breakout itsel
post-image
ETH-1.19%
XRP-1.81%
SOL-2.50%
Market Alert

$ADA /USDT - SHORT

Trade Plan:
Entry: 0.2195 – 0.2211
SL: 0.2278
TP1: 0.2147
TP2: 0.2109
TP3: 0.2053

Why this setup?
Technical setup found.

Debate:
Thoughts?

⚠️ Personal market analysis only. NFA — manage risk and DYOR.
Educational content, not investment advice or a recommendation to buy, sell, deposit, or withdraw any asset. No paid promotion or referral/affiliate links.
ADA-1.79%
Everyone is about to get burned on $LAB /USDT.

$LAB /USDT - SHORT

Trade Plan:
Entry: 0.0697 – 0.0701
SL: 0.0716
TP1: 0.0686
TP2: 0.0677
TP3: 0.0664

Why this setup?
Why now? The 1d trend is bearish and the 4h setup is confirming it with 95% confidence, so the deck is stacked for more downside. The 1h price is sitting at 0.0699, right inside the entry zone of 0.0697 to 0.0701, giving us a clean trigger. The 15m RSI at 50.9 shows the market is neutralizing, not recovering, which means the short can hold. Meanwhile the 1h ATR of 0.000729 tells us the next leg should move the price from the e
LAB-2.64%
ZEC Breaks Above $1,200—Who Is Still Shorting? Shorts Are Being Taught a Lesson by the Market!
This ZEC rally has one very obvious driving factor: shorts are being continuously squeezed.
ZEC has recently broken through key round-number levels in succession, from $900 to $1,000 and then $1,200, with the pace of gains accelerating. As the price continues to break past previous highs, shorts who had bet on a pullback have been forced to close their positions, further creating a cycle of “rally—liquidations—further rally.”
This is a classic short-squeeze rally.
The most exciting part is that those
ZEC-6.93%
  • 26
I was just about to go rant on the forum, but then I checked my balance—forget it, the market is always right.😌
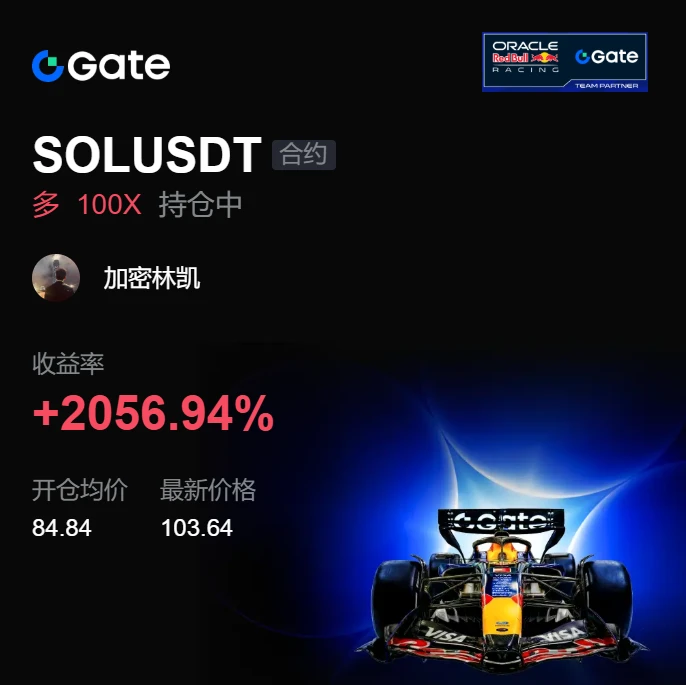
A few days ago, I took one last look before bed. $SOL retraced to 84.84, but not only did it hold the level, the rebound grew stronger each time. I placed an order on the side, thinking the worst-case scenario would be getting stopped out. I didn’t expect to wake up and find the price had gone straight to 103.65.
The unrealized profit is now +2062.43%. Although I didn’t catch the entire move with a full position, I did hold on to the most comfortable part of the launch. Getting the
post-image
SOL-2.50%
SNDK+1.42%
LAB-2.64%
A few days ago, I was still calculating whether I had enough money for instant noodles this month; this morning, I was already wondering whether to add a sausage.
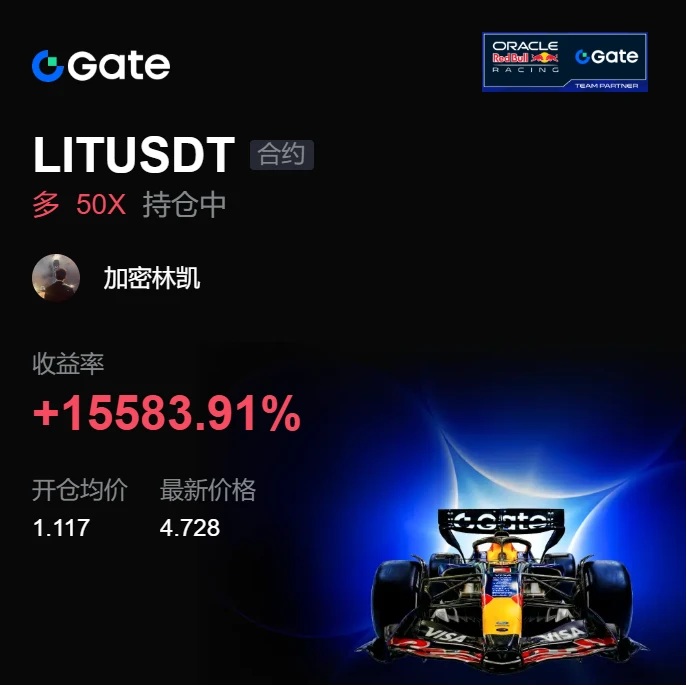
A few days ago, I took one last look at the chart before bed. $LIT pulled back on declining volume, with the price repeatedly hovering around 1.117. The bottom consolidation was exceptionally clean. I knew then that once this structure started moving, the pace would be extremely fast.
When I opened the chart this morning, it immediately surged on heavy volume. The current price has already reached 4.733, and anyone who followed is up
post-image
LIT+4.63%
SOL-2.50%
BTC-1.46%
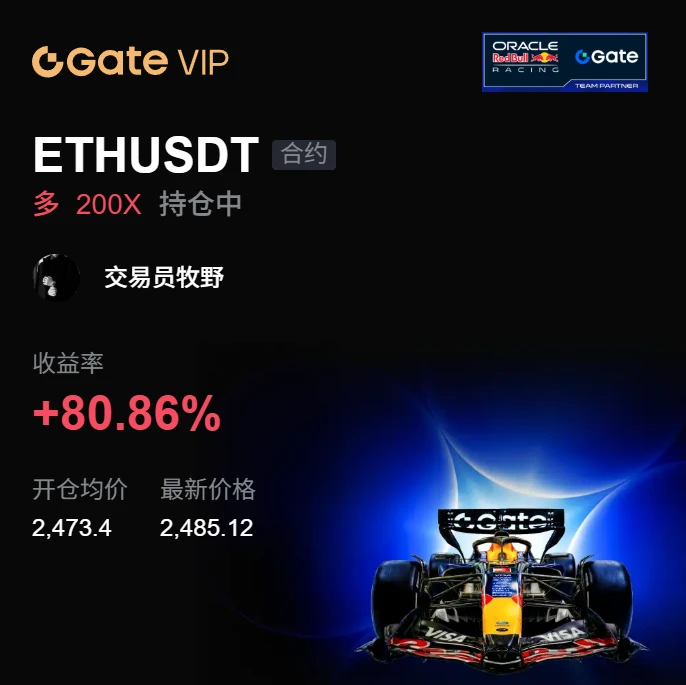
I didn’t do anything—just went to the restroom, and when I came back, the K-line had already done the work for me. I opened the chart in the morning: $ETH was bottoming out without breaking down, while volume was starting to recover. I saw that the incoming capital looked substantial, so I went long. When I came back, it had moved from 2473.40 to 2485.34, +82.61%. Feels great, brothers. This bite of profit was satisfying—those on board should have woken up laughing. In terms of execution: put the bulk into your pocket first, take 80% off the table, and move the stop-loss on the remaining 20% c
post-image
ETH-1.19%
LAB-2.64%
SOL-2.50%
September 8 Jinman Gold Morning Review:
Spot gold on the 4-hour chart is showing a consolidation pattern after a sharp decline. The price fell sharply from the previous high of 4631.18, found a temporary low at 4282.53, and then saw buying-driven recovery. After rebounding to a relatively high level, it fell again due to insufficient upward momentum. It is currently trading near 4413.43, with the tug-of-war between bulls and bears intensifying, and the market is at a critical juncture for choosing a direction.
On the fundamental front, today’s focus will be on U.S. economic data and remarks fr
post-image
BTC-1.50%
ETH-1.25%
I was just about to go to the forum and start cursing, but then I saw my balance—never mind, the market is always right. 😤

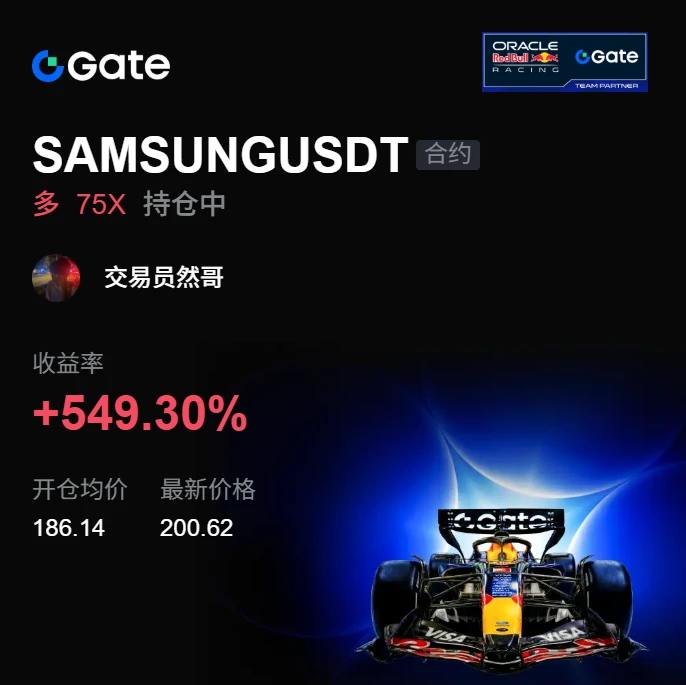
With the whole screen glowing green, $SAMSUNG kept grinding along the bottom down to 186.14, and I knew something was off: the level that should have broken didn’t, while funds were quietly moving in. Was someone getting in ahead of me? Then I followed and went long—get on the train first and worry about the rest later.

I just checked my holdings, and the current price has already climbed to 200.5, with a return of +545.11%%. Looks like this ride is secure. Everyone o
post-image
SAMSUNG+2.66%
DOGE-0.18%
SNDK+1.42%
Layout for Bitcoin, Ethereum, and Dogecoin
live-cover
LIVE1,434
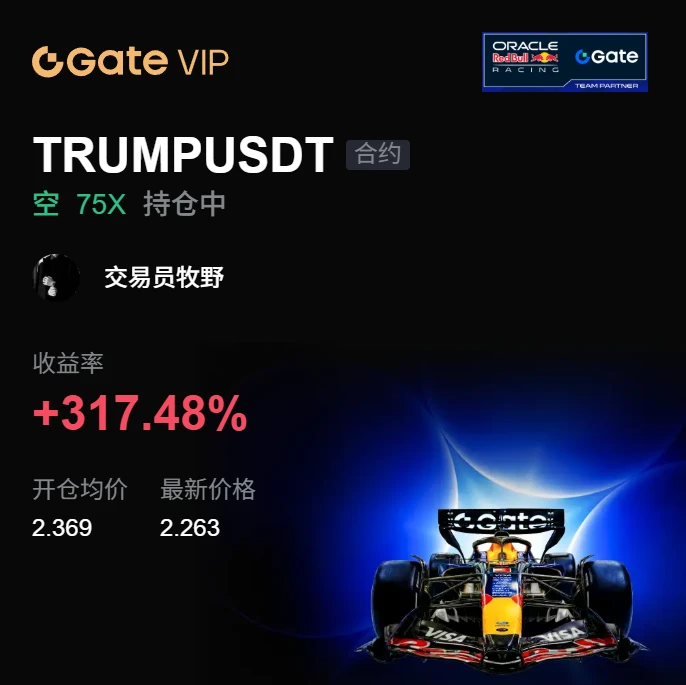
My hand trembled slightly when I set the stop-loss a few days ago; this morning I realized that extra act of devotion was unnecessary.😅 The last thing I saw before bed was $TRUMP still stubbornly holding on. That key level was tested repeatedly but never broken, and my heart sank—the price action didn’t look right. I muttered to myself at the time: the rebound was weak, buying support was insufficient, and the candlesticks looked like pure bluster. Volume failed to follow; no one was taking the price higher. Wasn’t this just bait? I immediately opened a short at 2.369, without the slightest
post-image
TRUMP-1.60%
SOL-2.50%
ETH-1.19%
Market Alert

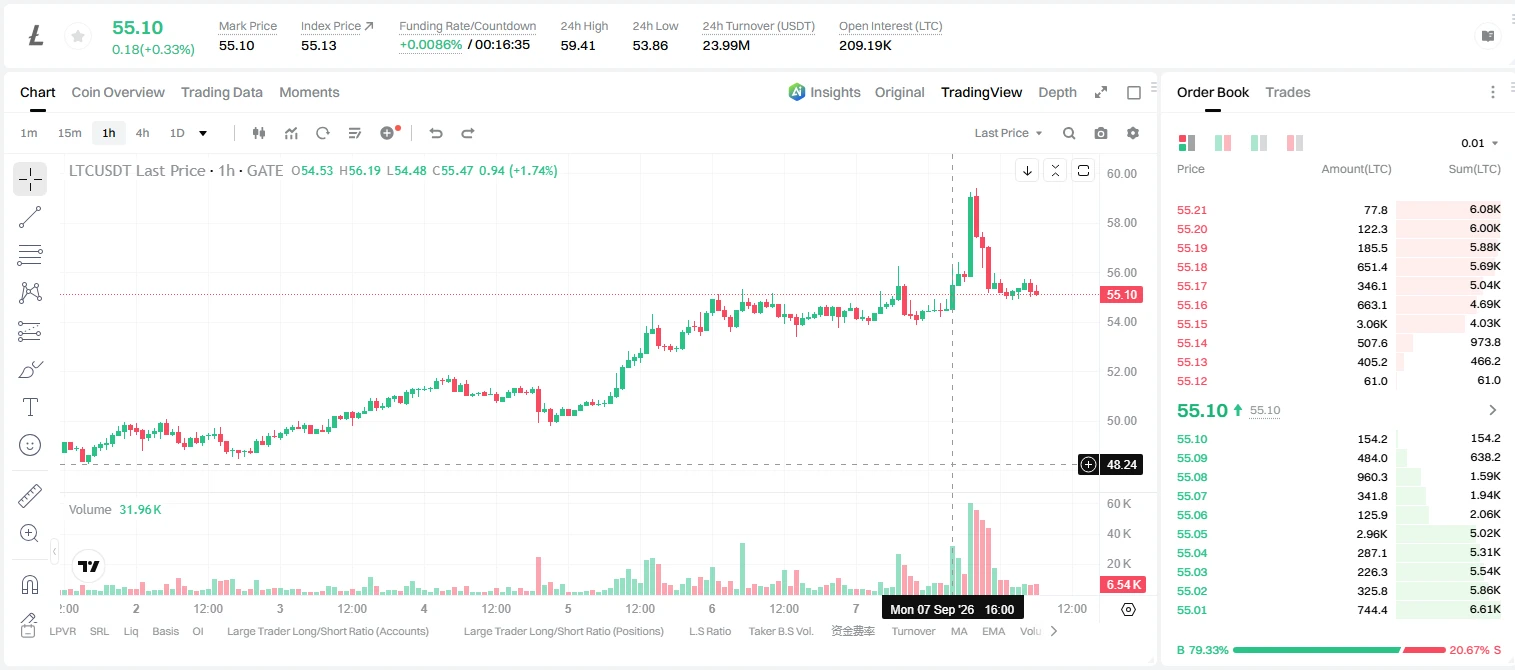
$LTC /USDT - SHORT

Trade Plan:
Entry: 54.92 – 55.34
SL: 57.13
TP1: 53.63
TP2: 52.63
TP3: 51.13

Why this setup?
Technical setup found.

Debate:
Thoughts?

⚠️ Personal market analysis only. NFA — manage risk and DYOR.
Educational content, not investment advice or a recommendation to buy, sell, deposit, or withdraw any asset. No paid promotion or referral/affiliate links.
post-image
LTC+0.07%
I didn’t chase the first bullish candle after the breakout; my first instinct was to worry it was a fake breakout. Only after the pullback held and the second volume-backed move began did I confirm the direction and add to my long position.
After the surge reached near the target, momentum had already stalled. As planned, I first reduced the position by 70%, keeping the remaining 30%. Later, the pullback hit my protective stop, so I exited the entire core position as well.
This long position made one thing clearer to me: entering a little later is nothing to be ashamed of. The key is whether y
post-image
LAB-2.64%
SOL-2.50%
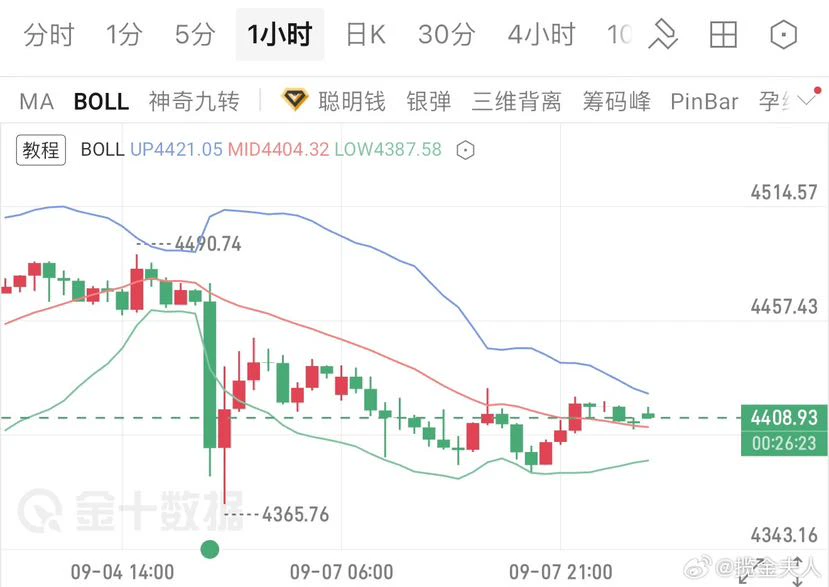
9.8 Gold Morning Strategy
On the hourly chart, gold prices are generally fluctuating at low levels after the decline, trading below the middle Bollinger Band under pressure. The upper Bollinger Band continues to exert downward pressure, and multiple rebounds have failed to break through effectively. Bears have the upper hand in the short term, while the pace of the decline has slowed somewhat. Do not blindly bottom-fish in the morning; focus on opportunities to short when rebounds encounter resistance.
Key Levels
Resistance: 4420, 4440
Support: 4405, 4385
Strategy:
Short on resistance in the 4
post-image
XAUT-0.01%
$MU /USDT is about to expose the biggest range trap of the week.

$MU /USDT - SHORT

Trade Plan:
Entry: 1035.35 – 1037.39
SL: 1046.17
TP1: 1029.02
TP2: 1024.12
TP3: 1016.77

Why this setup?
Why now? The daily trend is a range, but the 1h price is sitting at 1036.37, right inside the entry zone where the 15m RSI has dropped to 35.35, signaling bearish exhaustion is setting in. The 1h ATR of 4.083077 confirms enough volatility to push the price from the entry_ref toward TP1 at 1029.02 and then TP2 at 1024.12. The invalidation level at 995.15 is the hard line that separates a clean short from
MU+2.03%
$1000 to $100,000 Crypto Trade Challenge Today
live-cover
LIVE1,598
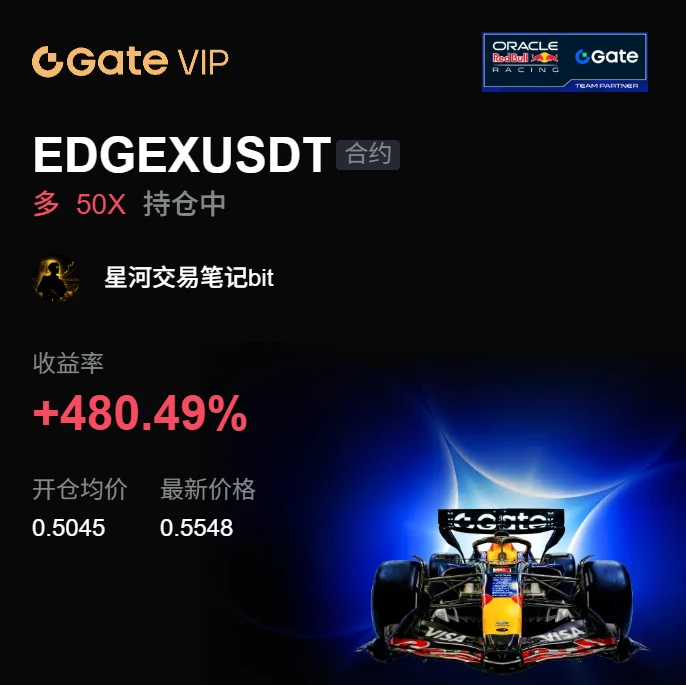
I didn’t chase the first push higher because the price was too far above the moving average, and entering then would have made it easy to get stopped out by a wick. After waiting for a pullback to stabilize, I entered at 0.5045 for this $EDGEX long.

After entry, the market went into weak consolidation, with the range gradually narrowing and volume shrinking sharply. This kind of setup is the biggest test of patience, and many people get worn down into manually stopping out. I held my core position without moving it, only gradually tightening my stop-loss.

When the consolidation range broke
post-image
EDGEX-5.18%
ZEC-6.93%
LAB-2.64%
BTC found support and rebounded near 78,600, but why shouldn’t we rush to say it has turned stronger before reclaiming 79,500?
After retreating from around 80,000 over the past two days, BTC found buying support near 78,600 and has now moved back above 79,000.
Seeing the rebound, many people’s first reaction is: the pullback is over, and the market is about to move higher again.
But the easiest thing to misread today is equating a “rebound after finding a floor” directly with a “structural recovery.”
From the one-hour structure, the fact that 78,600 has held for now shows there is buying inter
post-image
BTC-1.46%
Market Alert

$CL /USDT - SHORT

Trade Plan:
Entry: 92.22 – 92.42
SL: 93.25
TP1: 91.63
TP2: 91.16
TP3: 90.47

Why this setup?
Technical setup found.

Debate:
Thoughts?

⚠️ Personal market analysis only. NFA — manage risk and DYOR.
Educational content, not investment advice or a recommendation to buy, sell, deposit, or withdraw any asset. No paid promotion or referral/affiliate links.
CL+0.47%
Load More

Join 40 M users in our growing community

⚡️ Join 40 M users in the crypto craze discussion

💬 Engage with your favorite top creators

👍 See what interests you

View More