
Square
Following
Hot
News
Notifications
Profile
Share your thoughts
placeholder
Article
$ZEC 1260.25, 24H -5.81% (1235.00–1339.66). 1H is weak, RSI 41.22/EMA20 1270.69, support at 1235.00/resistance at 1334.33, volume ratio 0.81; 4H is weak, RSI 51.84/EMA20 1281.84, support at 1183.38/resistance at 1387.89. A sustained move above the 1334.33 resistance would be meaningful; a break below the 1235.00 support would signal weakness. Review and verify a sustained hold above 1334.33 and a break below 1235.00 followed by a reclaim; invalid if volume is lacking or the level is not reclaimed. The market is volatile; for observation only.
post-image
ZEC+1.16%
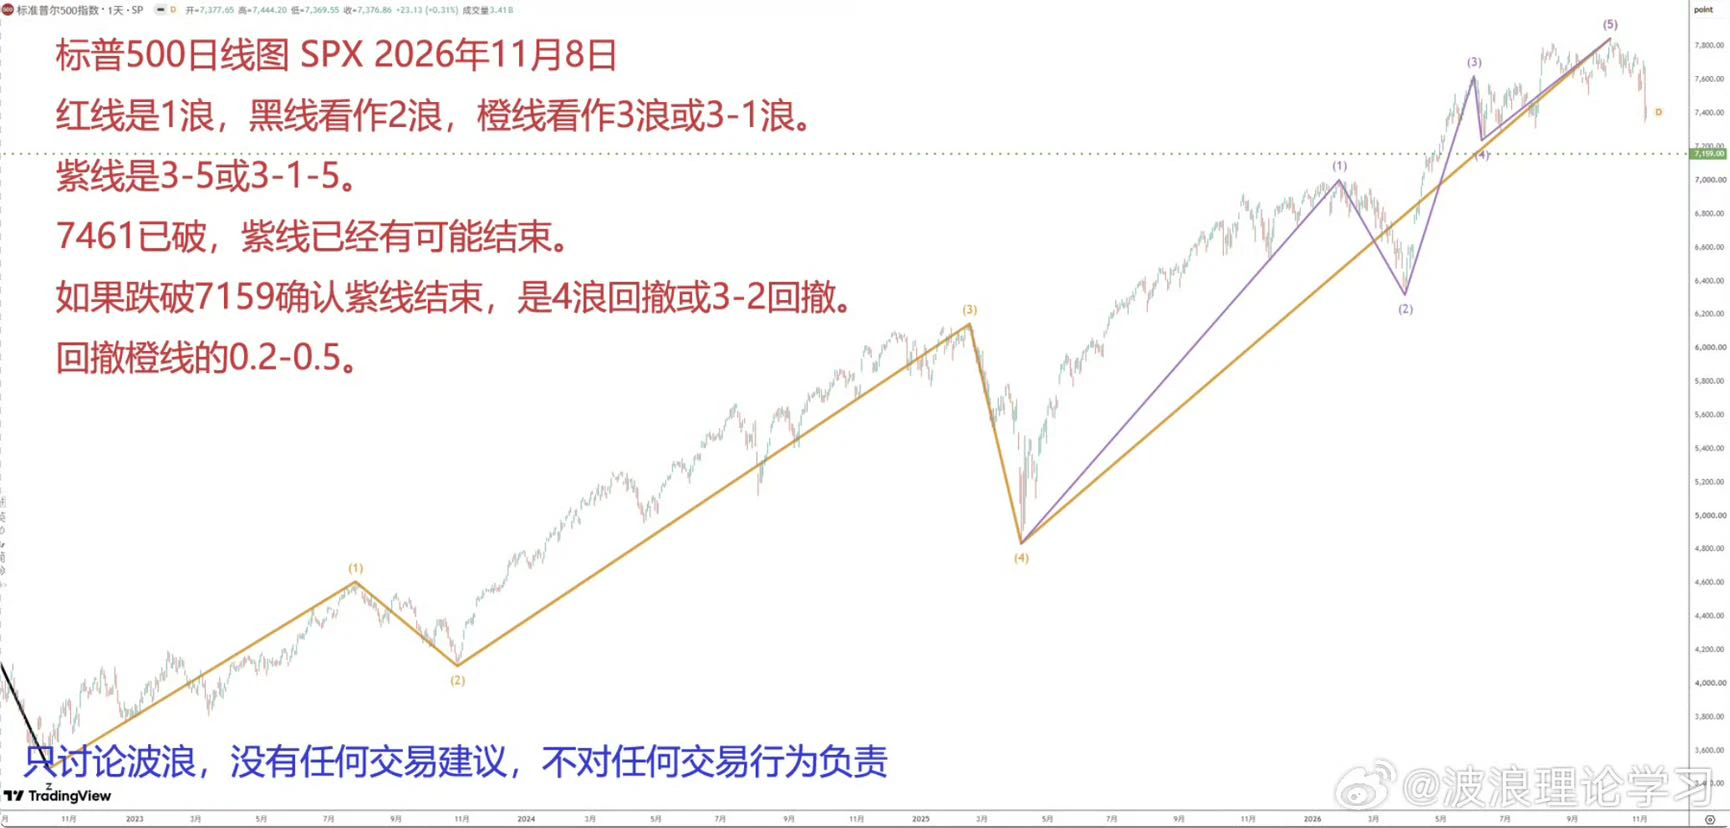
S&P 500: Warning began on September 15; on November 3, it “clearly formed a top at a minor degree.” Today, November 8, it broke below the monitoring point, expanding the top’s degree. ​​​$BTC ‌
post-image
BTC-0.65%
Trenches
ZIG
Z
bade
b
ZIG
0x8c...1145
Market Cap
$.
Change
.
24h Vol
$.
Holders
.
STONK
S
bade
b
STONK
6GmA...UNgx
Market Cap
$.
Change
.
24h Vol
$.
Holders
.
IDOL
I
bade
b
IDOL
0x3b...ab07
Market Cap
$.
Change
.
24h Vol
$.
Holders
.
BTC
B
bade
b
BTC
C5xp...pump
Market Cap
$.
Change
.
24h Vol
$.
Holders
.
FLOAT
F
bade
b
FLOAT
Bv1a...BMmr
Market Cap
$.
Change
.
24h Vol
$.
Holders
.
#USCPIDataIncoming #ShareWeekly
America’s most closely watched inflation report is just around the corner. The Bureau of Labor Statistics is scheduled to release the Consumer Price Index (CPI) for October 2026 on Tuesday, November 10, 2026, at 8:30 a.m. Eastern Time. This is not just another data point. It is one of the primary inputs the Federal Reserve uses to decide the future path of interest rates, and financial markets from Bitcoin to the S&P 500 to gold and crude oil will react within seconds of the numbers hitting the wire.

What CPI Actually Measures
The Consumer Price Index tracks t
🔹 Bitcoin Doesn’t Need Banks, but Strategy Wants to Become a Bitcoin Bank
live-cover
LIVE3,080
$ENA is showing signs of selling pressure after a $10.27K long liquidation near $0.15359. This flush could create an opportunity for buyers if price stabilizes and reclaims short-term market structure. Watch for a bullish CHoCH, demand-zone reaction, and increasing buying volume before considering continuation.
Support: $0.1500 – $0.1470
Resistance: $0.1570 – $0.1620
Next Target: $0.1680
Confirmation: Reclaiming $0.1570 with strong volume could shift momentum toward higher liquidity. Failure to hold support may extend the downside.
Let's go $ENA 🚀
post-image
ENA+8.04%
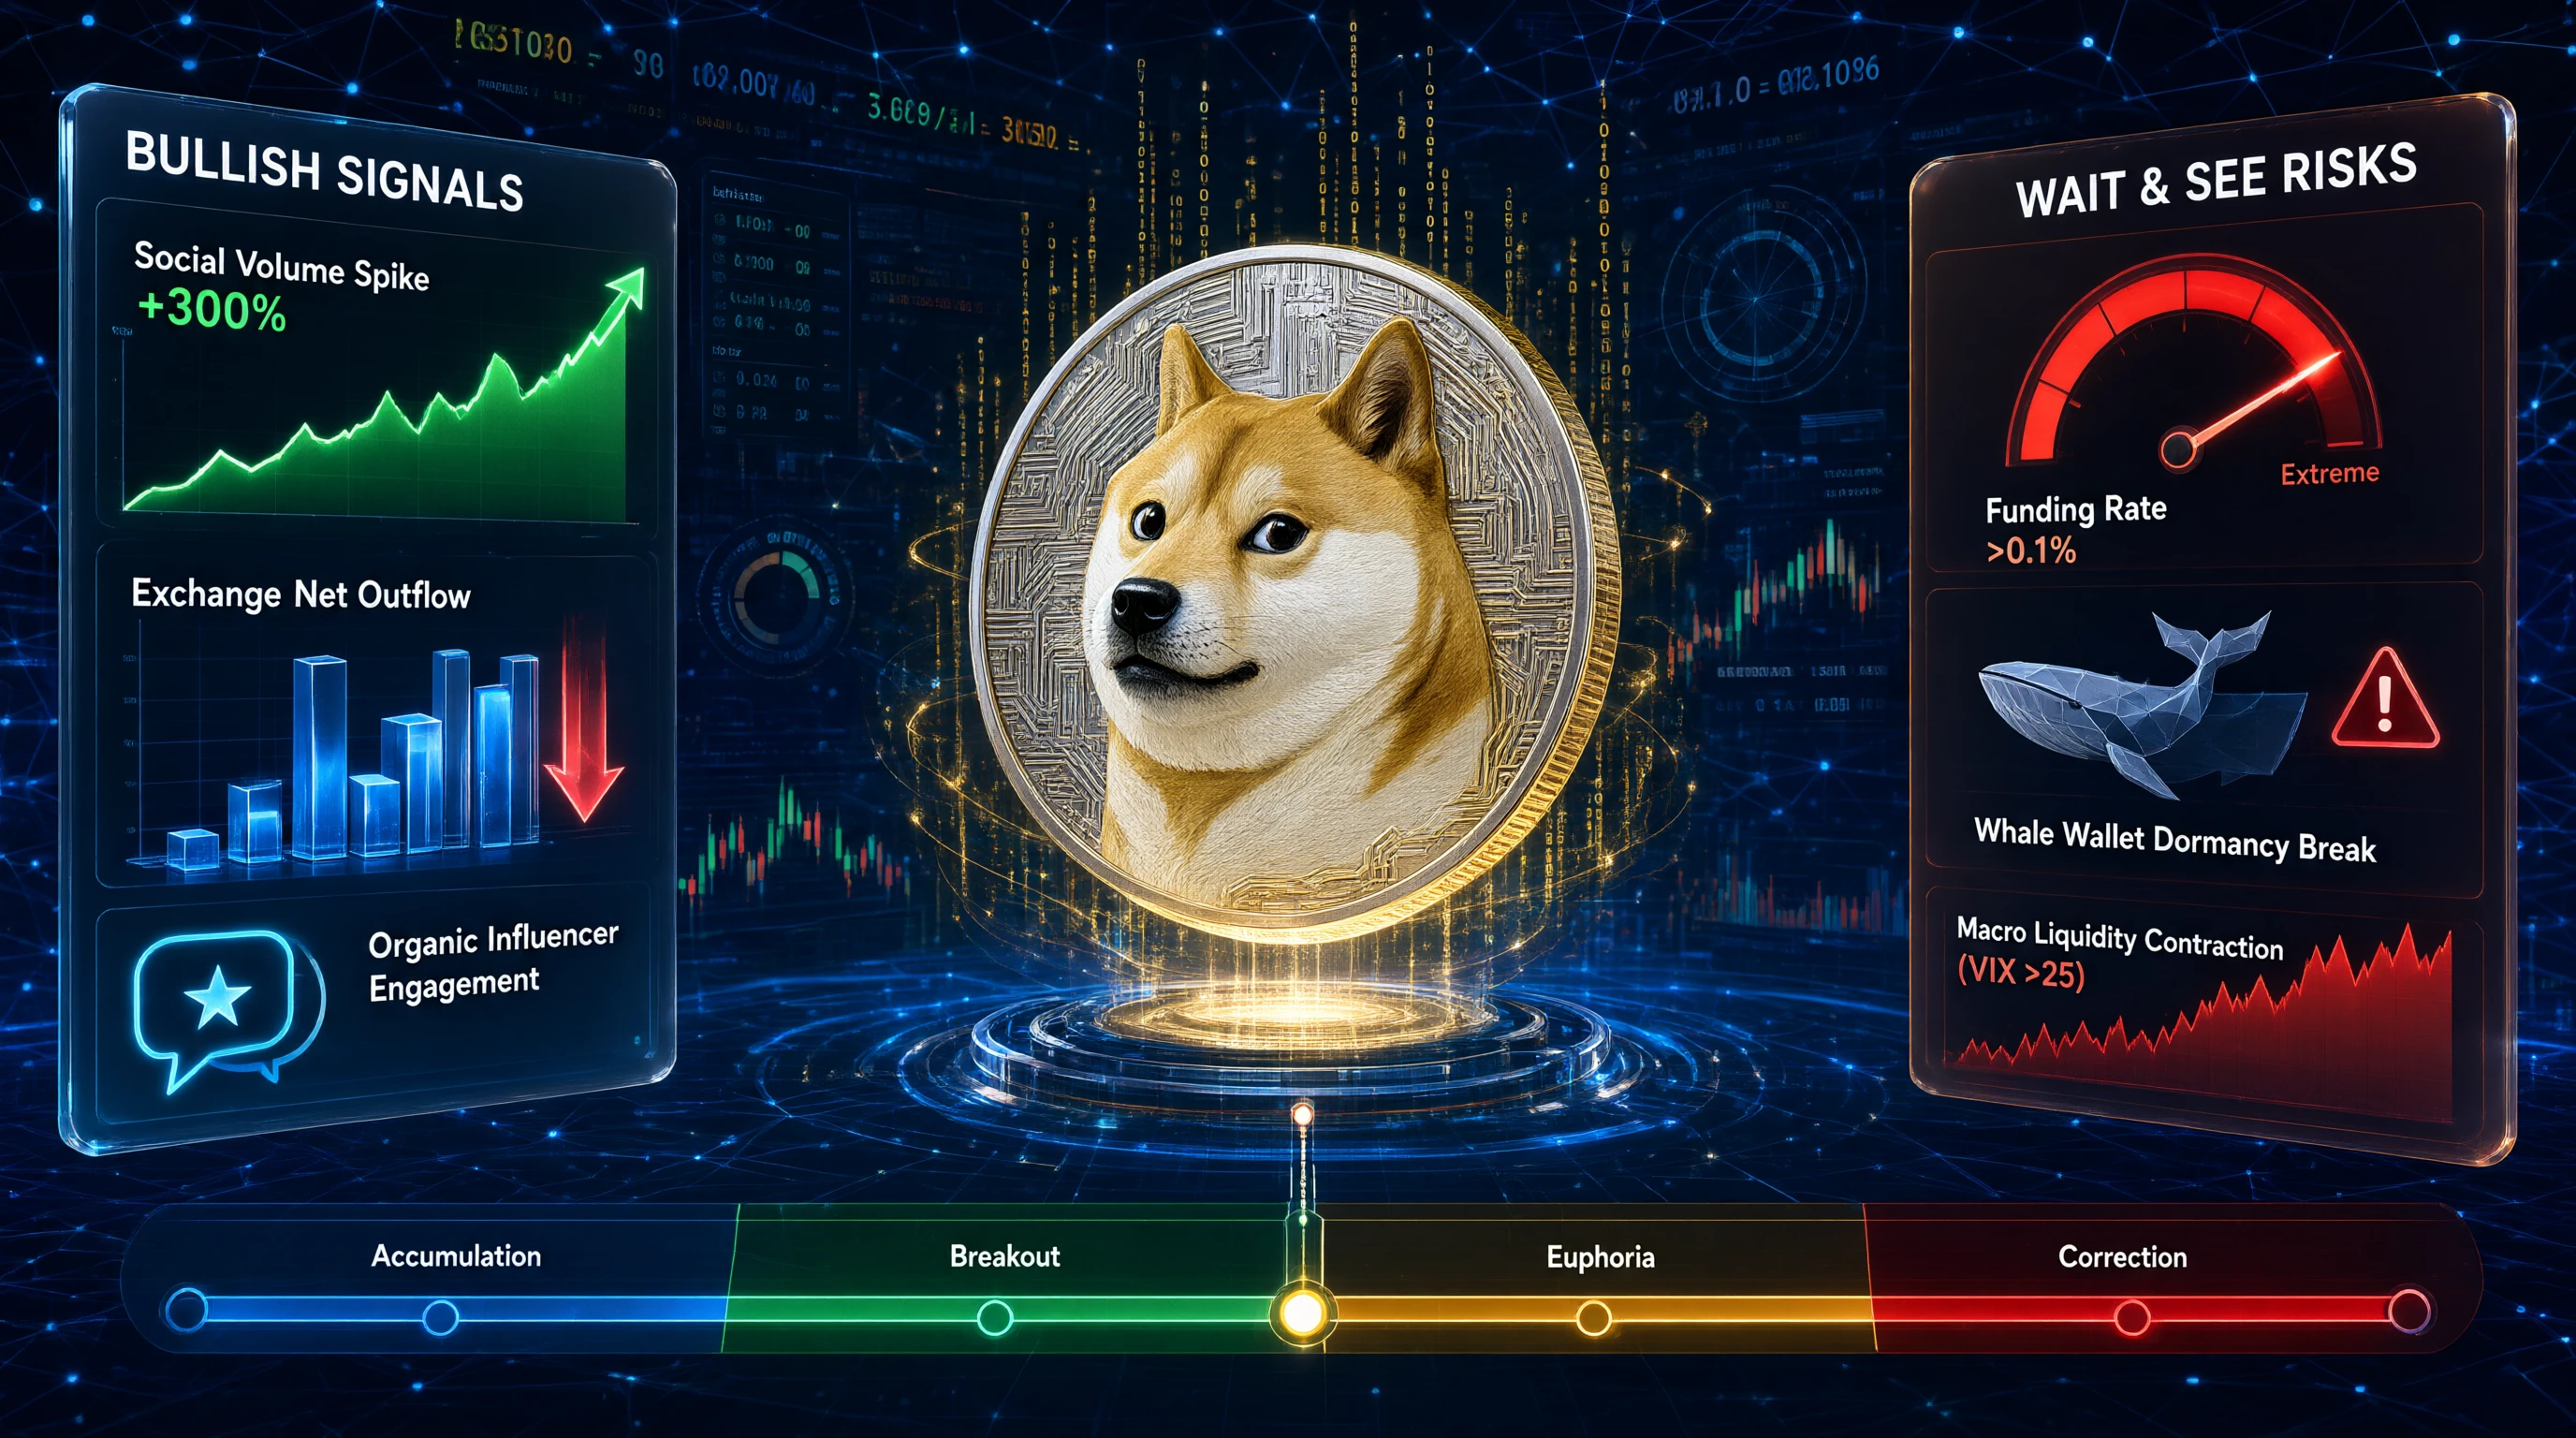
Applying traditional equity analysis to $DOGE is a category error; this asset operates on meme economics, not fundamental valuation.

The question of bullish signals for Dogecoin cannot be answered through discounted cash flow models or balance sheet scrutiny. $DOGE is the world’s most liquid meme asset, and its price discovery mechanism is driven entirely by social sentiment, celebrity influence, and speculative liquidity cycles. Treating it as a company fundamentally misaligns your analytical framework with market reality. Success requires evaluating cultural momentum, on-chain activity patt
post-image
DOGE-0.18%
  • 3
  • 2
$MET Up 19.44% in 24 hours to 0.3306, with 43.5M in trading volume—retail traders alone couldn't drive this kind of volume. The current price is just 1.5% below the 24-hour high of 0.3356. Go long on a breakout, with a stop-loss at 0.315 (above today's low) and a first take-profit at 0.36. Keep your position at or below 5% of your total capital, and do not exceed 3x leverage. If you're not in a position, wait for a pullback to the 0.318–0.322 range and scale in. If it falls below 0.31, admit you're wrong and exit immediately. The token selection logic is simple: a high 24-hour volume-to-turnov
MET-0.33%
#TRX

TRX Holds Near $0.32: What Is Supporting the Price, and What Could Change the Picture?

A Small Move, but What Does It Tell Us?

Imagine checking your crypto portfolio in the morning and seeing TRX slightly higher than the previous day. The price has not made a dramatic jump, but it is moving in a positive direction. Is this the beginning of a stronger recovery, or simply a period of normal market movement?

As of November 8, 2026, at 01:30 UTC, TRX/USDT was trading at $0.3205, recording a 24-hour increase of 0.8%. Its 24-hour trading volume was approximately $2.65 million USDT.

This i
post-image
TRX+0.42%
BTC-0.67%
  • 1
[New Streamer] 🔹 Former FBI Agent Admits Stealing $2.47 Million in Cryptocurrency, Faces Up to 20 Y
live-cover
LIVE1,020
Six dead and 15 injured at Krakow’s Old Town Main Square; three bodies still lay in the killer’s home—the case is even more chilling than the shooting itself!
Poland’s Prime Minister’s Office counted the suspect among the injured, reporting 6 dead and 16 injured, which doesn’t match the Associated Press’s figure of 15 injured. Do we have to reconcile the casualty figures before we can get at the truth?
The first report came in at 15:00:15 on November 7. No one can say how long the gunfire lasted or when the first shot was fired; with so many people at Old Town Main Square, the response time is
post-image
When BTC shows bearish divergence, does it mean a decline is imminent?
In BTC technical analysis, bearish divergence is often seen as a warning that an uptrend may be weakening. But many traders rush to short as soon as they spot bearish divergence, only for the price to keep rising instead of falling, ultimately getting caught on the wrong side of the market.
So how should bearish divergence be interpreted?
First, understand the basic principle of bearish divergence. When the BTC price keeps making new highs, but the peaks of the RSI or MACD gradually decline, bearish divergence may be formin
post-image
BTC-0.67%
$ERA The daily chart has seen two rounds of high-volume choppy trading, and the uptrend has resumed. The rally is about to begin—go long now!!!
post-image
ERA+24.21%
$CLAUDIA One quote tweet pushed it back to a 7 million market cap, $JOSE and riding the same person's meme sent it soaring to 1.8 million. That's the entire logic of meme coins: money goes wherever the attention is. Don't ask why. Before the halving, while the market is trading sideways, we'll see even more of this kind of thing. Decide for yourself whether to follow along. What do you think? $BTC If you're watching, follow along.
post-image
MEME-0.94%
BTC-0.67%
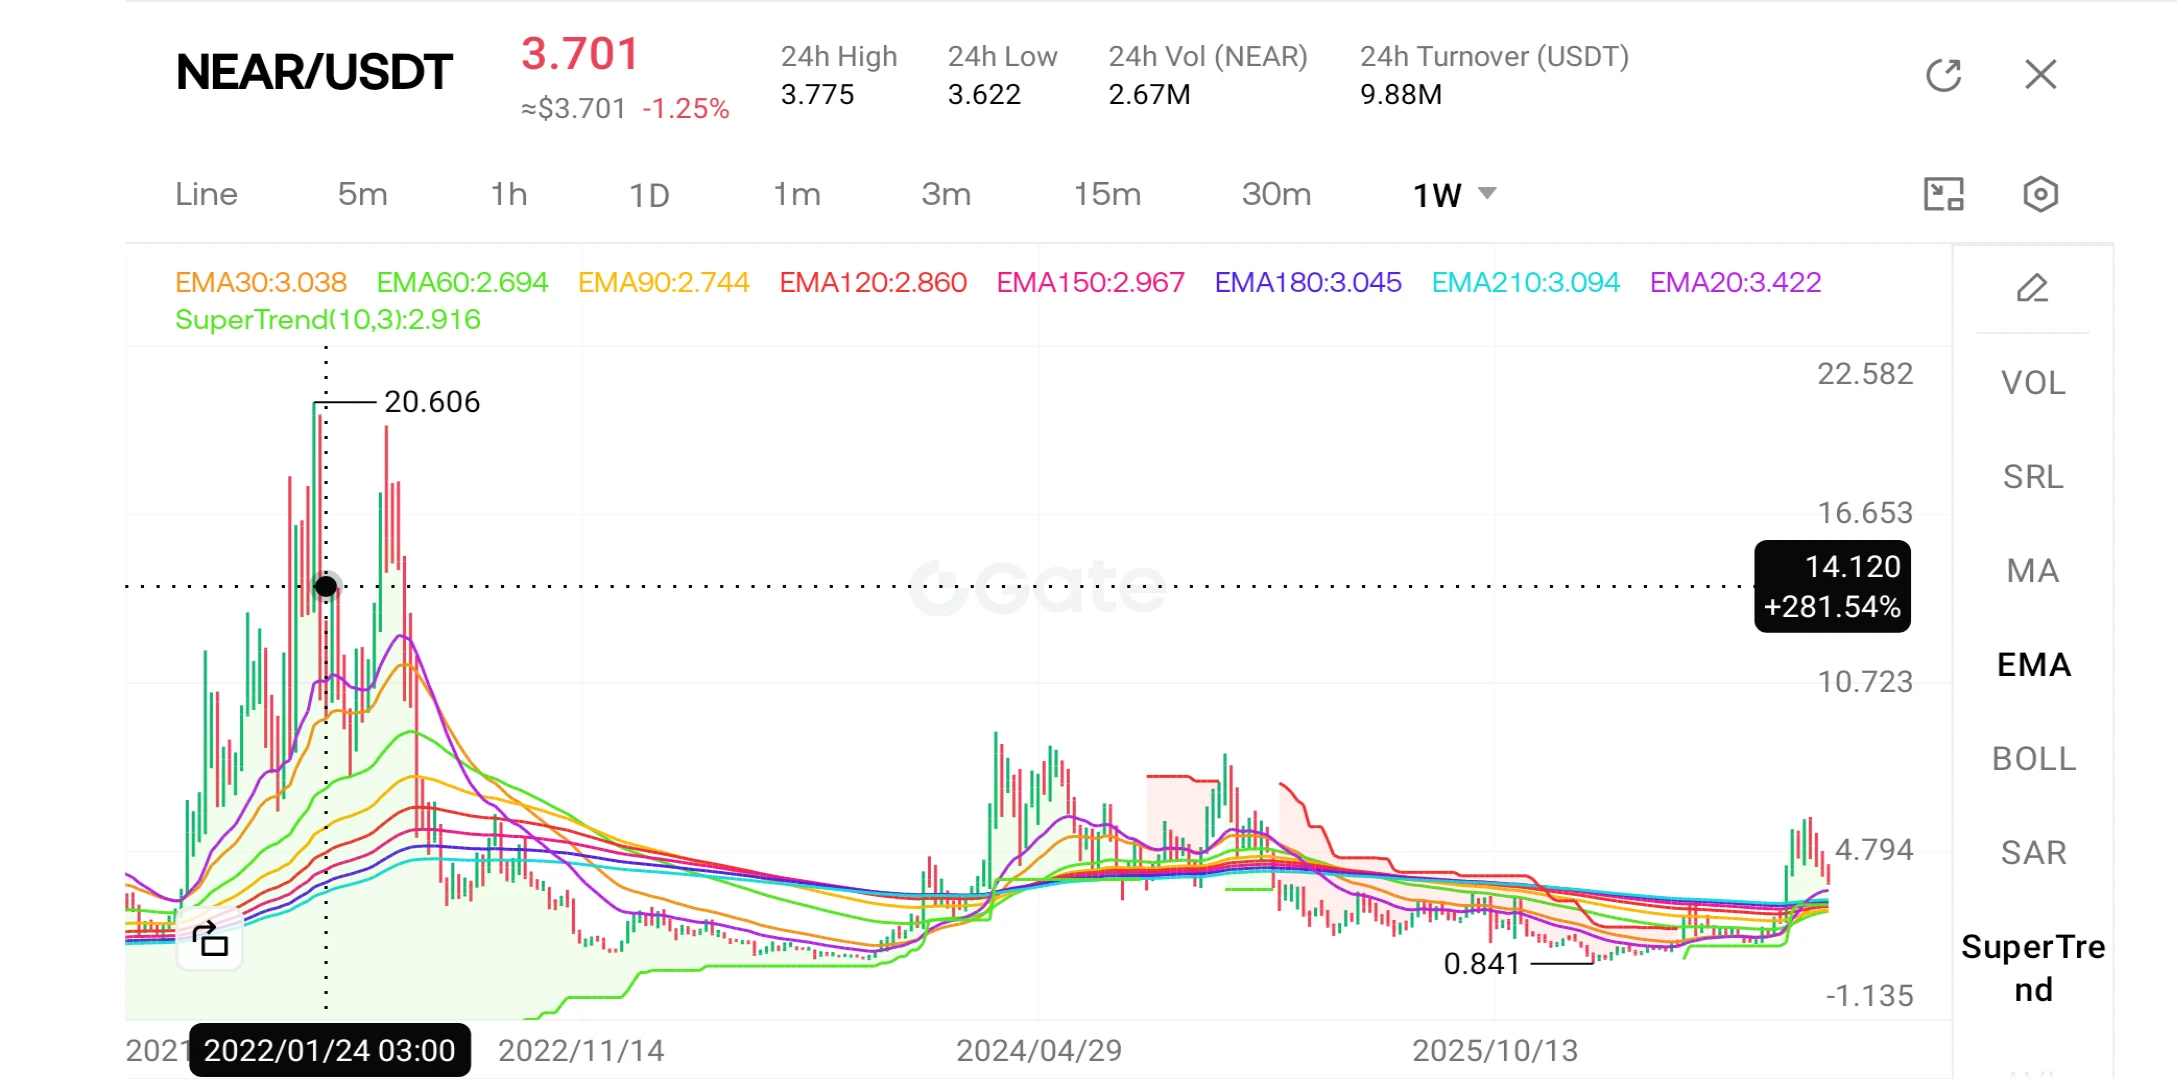
$NEAR 🔬

The native token of the NEAR Protocol is trading at approximately $3.65, having lost over 35% of its value since reaching a peak of $6 in early October. The price currently sits below its short- and medium-term moving averages but remains above its long-term moving average, with the $3.50–$3.60 range serving as a critical support level. Furthermore, it has been confirmed that the governance body has approved a proposal to gradually reduce the token supply, and new platforms focused on AI agents are being launched on the NEAR network.

What does this journey from peak to trough tell u
post-image
NEAR+1.17%
  • 4
  • 2
Two-Week Market Review: Through Rotating Gains and Losses, an Unassuming Approach Goes the Distance

  The two-week market period has come to a close. BTC completed two full cycles of gains and losses, while ETH followed in lockstep throughout. Volatility narrowed, and the pace remained highly synchronized, just as the old saying goes: “Tides rise and fall according to their own rhythms; clouds gather and disperse in their own time.”

  The first week began with wide swings around the 80k level, as daytime rebounds alternated with nighttime pullbacks and bulls and bears repeatedly whipsawed th
BTC-0.65%
ETH-1.23%
A brief analysis of BTC’s short-term trend through Dow Theory, Chan Theory, Elliott Wave Theory, volume-price relationships, order flow, and price action
The ultimate test at 74,791 is imminent! After the 80,838 bull-trap top #2 on November 5 (a historic sell-off of 4.716 billion/36 billion), the price broke below the psychological 75,000 level on November 6, dropping to 74,791 (a six-week low), before buyers stepped in with 988 million/2.32 billion, triggering a rebound to 76,278. On November 7, only 3.7 billion traded all day (+267 million Delta), with volume down to 10% of capitulation leve
BTC-0.67%
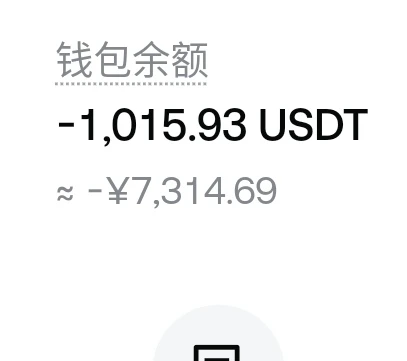
I’m leaving it alone now, making back 20u a day, and I’ll be in the green in 50 days, then I won’t touch it again
post-image
  • 1
🪔 HAPPY DIWALI 2026 🪔
🙏 शुभ दीपावली ✨
✨ May this Diwali bring endless happiness, peace, success & prosperity into your life. May Goddess Lakshmi bless you and your family with wealth, good health and positivity. ❤️
🙏 दीपावली की हार्दिक शुभकामनाएँ! 🪔
❤️ With Love
🔥 TEAM CRYPTO AMAN 🔥
post-image
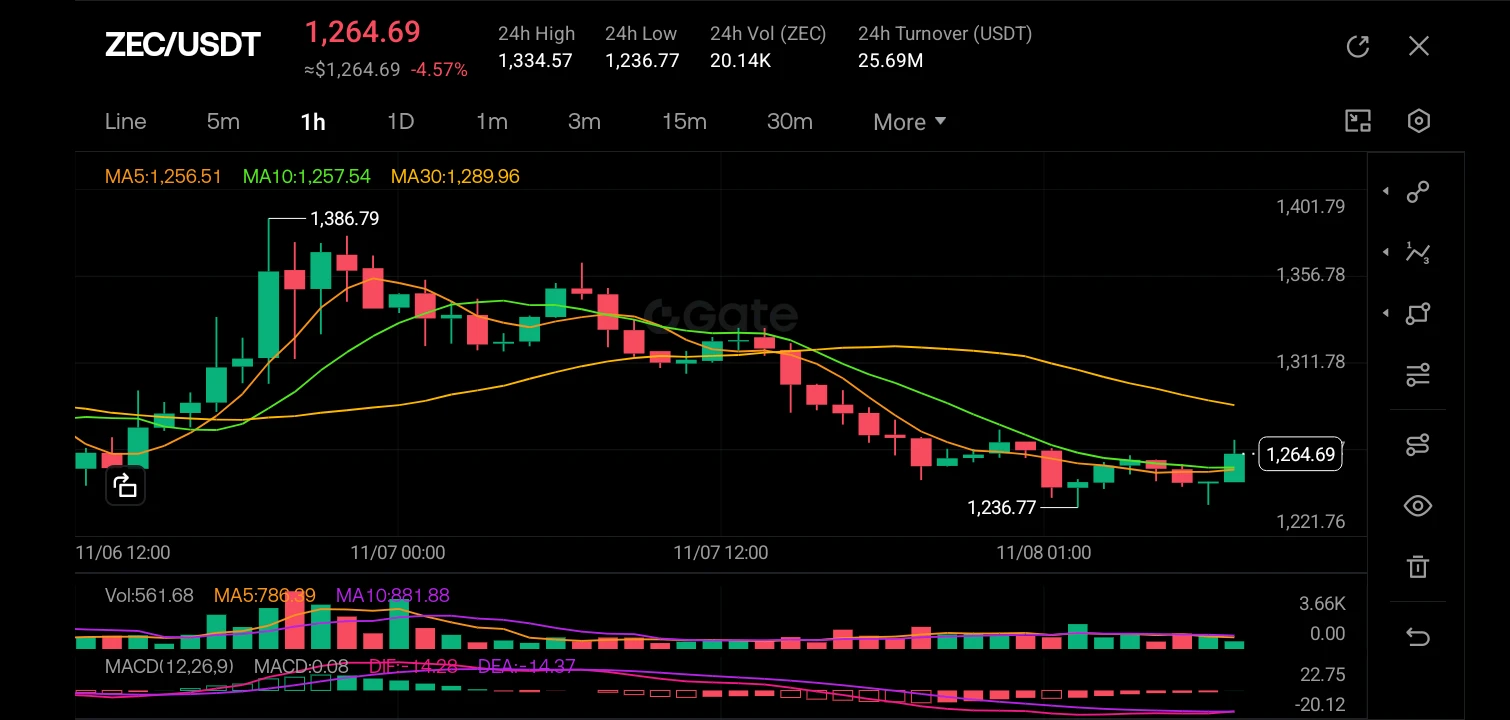
$ZEC ‌
The 1-hour chart reveals a definitive shift in market structure from a bullish uptrend to a corrective phase; after peaking at 1,386.79, the price action has formed a series of lower highs and lower lows, currently consolidating near the 1,264 level. The asset is trading below the yellow MA30 (1,289.96) which acts as dynamic resistance, while the shorter-term MA5 and MA10 have flattened out, indicating a momentary pause in the downtrend. The MACD histogram is hovering just below the zero line with a slight bullish convergence (golden cross forming), suggesting that the selling momentum
post-image
ZEC+1.16%
  • 3
Load More

Join 40 M users in our growing community

⚡️ Join 40 M users in the crypto craze discussion

💬 Engage with your favorite top creators

👍 See what interests you

Trending Topics

USCPIDataIncoming

1.04k Views1.48k Discussing

The U.S. October CPI report will be released on November 10 at 8:30 a.m. ET. September CPI came in at 3.7% year over year, and markets will be watching closely for signs that inflation is cooling, especially in core CPI. A softer-than-expected reading could strengthen rate-cut expectations, while hotter inflation may pressure risk assets through higher Treasury yields and a stronger dollar. How do you think this CPI print will move $BTC, U.S. stocks and gold?

USAIStocksHitHard

23.56k Views3.69k Discussing

USNonfarmPayrolls

40.34k Views4.38k Discussing

View More