




Square
Following
Hot
News
Notifications
Profile
Share your thoughts
placeholder
Article
The final rule allowing alternative investments such as crypto assets to be included in 401(k) retir
live-cover
LIVE22
Happy weekend everyone
It’s time recharge and touch and some grass
post-image
Trenches
ZIG
Z
bade
b
ZIG
0x8c...1145
Market Cap
$.
Change
.
24h Vol
$.
Holders
.
BTC
B
bade
b
BTC
C5xp...pump
Market Cap
$.
Change
.
24h Vol
$.
Holders
.
Diamond
D
bade
b
Diamond
5VCE...pump
Market Cap
$.
Change
.
24h Vol
$.
Holders
.
GM
G
bade
b
GM
0x13...7777
Market Cap
$.
Change
.
24h Vol
$.
Holders
.
DOGE
D
bade
b
DOGE
DoGE...fm7R
Market Cap
$.
Change
.
24h Vol
$.
Holders
.
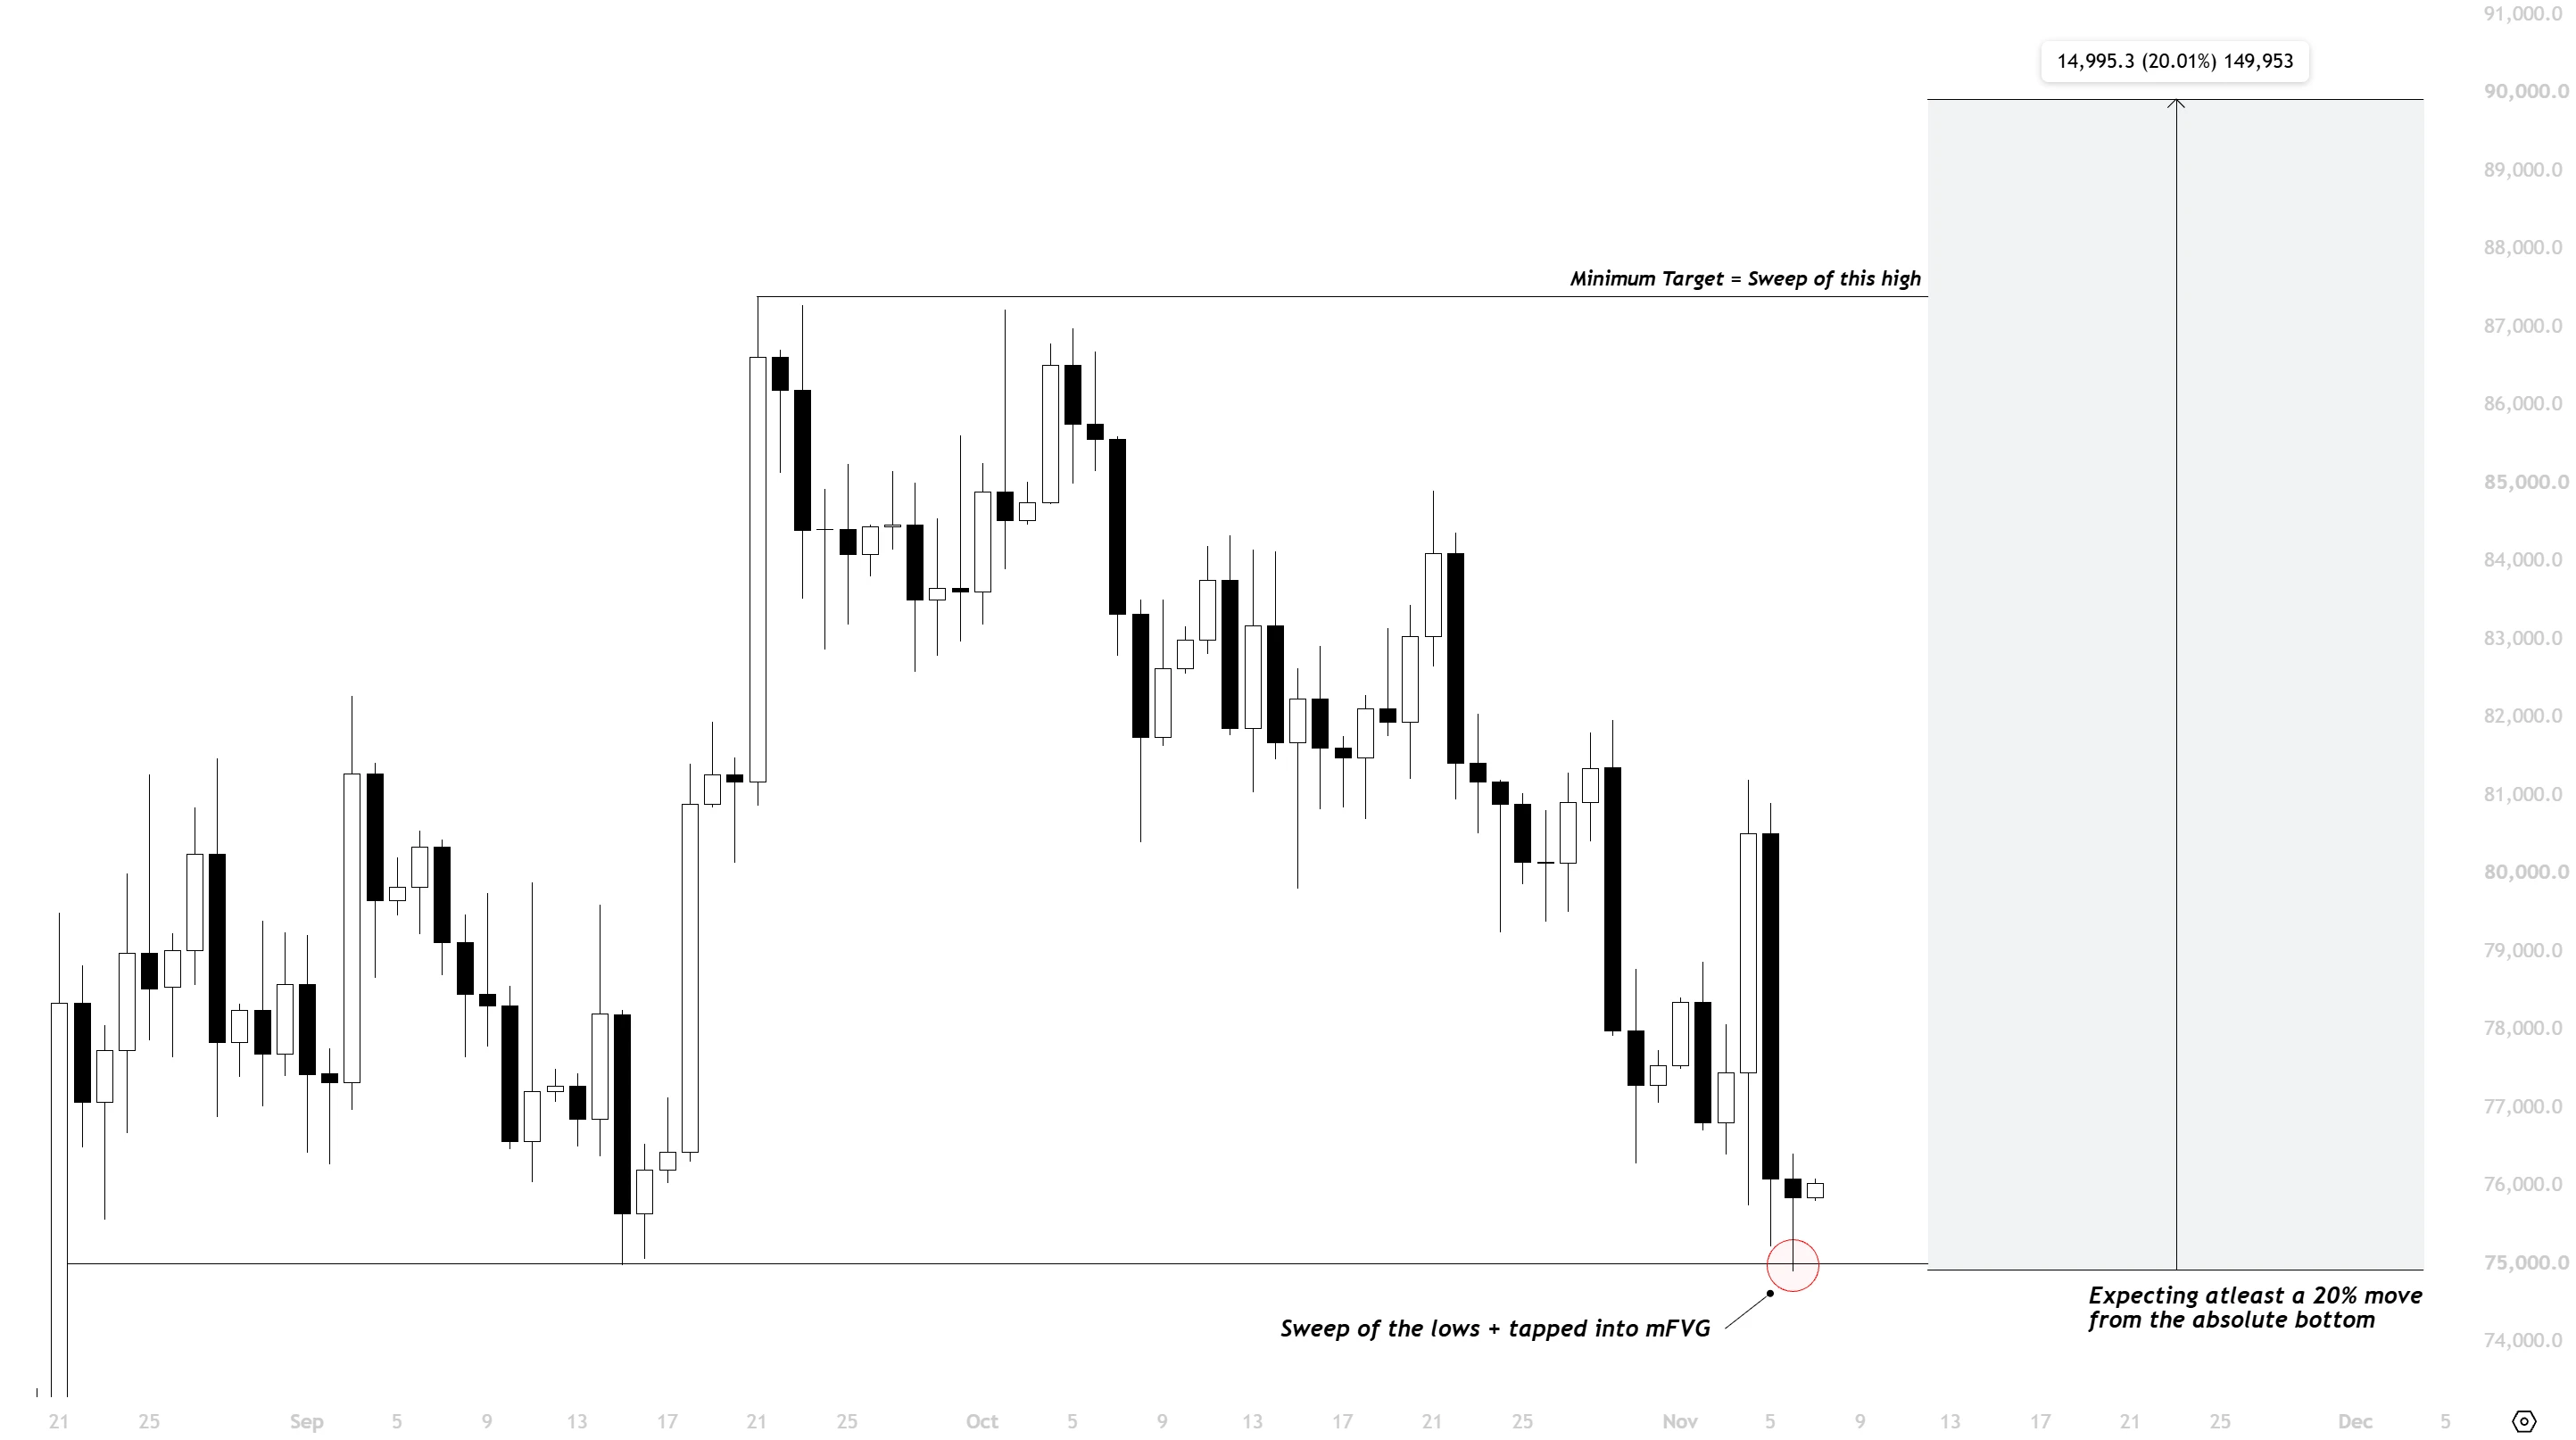
$BTC You are not bullish enough.

I have been talking about the 75k level since the absolute top (~87k),

And almost everyone was saying we won't go there and 80k is the bottom but in the end I was right.

Now I am saying we are going to 90k by the end of November and people are talking about 60k or new lows.

Well, it will be interesting to see, how things unfold from here.
post-image
BTC-0.67%
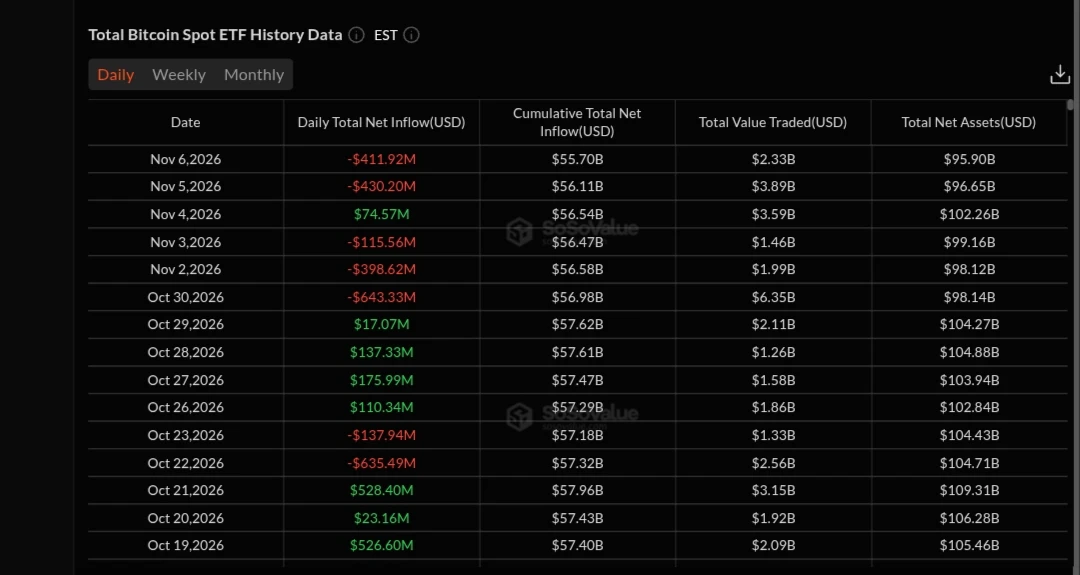
$BTC Spot ETFs saw another $412 million in outflows! Fidelity’s FBTC bucked the trend, attracting $42.82 million in inflows. ETH spot ETFs also saw $93.19 million in outflows! BlackRock’s staking product ETHB attracted modest inflows. Together, the two sides saw over $500 million in net outflows in a single day! On November 6, U.S. Eastern Time, BTC and ETH spot ETFs in the U.S. recorded combined net outflows of about $505 million. On the BTC side, Fidelity’s FBTC led net inflows with $42.82 million, while BlackRock’s IBIT saw about $403 million in outflows. There was a split on the ETH side t
post-image
ZEC+1.16%
  • 1
GM Everyone
Big things happen when you take small steps daily.
post-image
PoR answers “Do you have the money?”, while PoSEC answers “Where is the money held?”—these are two completely different questions

When FTX collapsed, many people began seriously looking into what “Proof of Reserves” meant for the first time. Then they realized that even if an exchange publishes a PoR, users’ funds may still be unsafe. Why? Because PoR answers only one question: Does the platform have enough assets to cover its liabilities to users?

But it doesn’t answer the second question: How exactly are those assets stored?

Gate’s newly launched PoSEC addresses precisely this gap that Po
NVDA+2.80%
  • 1
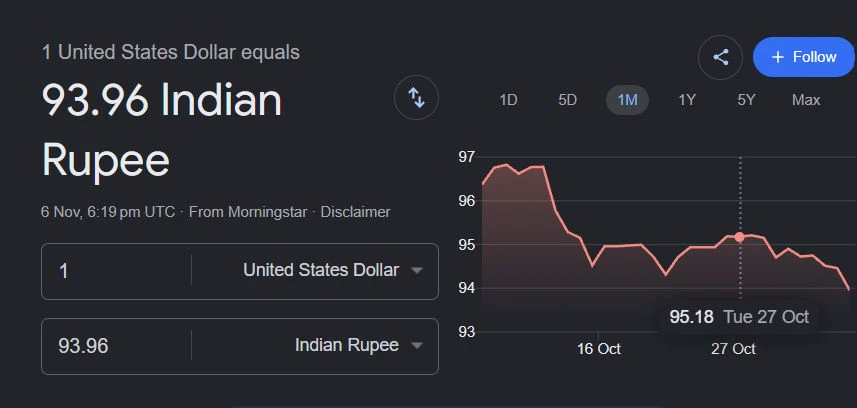
🇮🇳 BREAKING: The Indian rupee surges to ₹93.91 against the US dollar, marking its strongest level since April 22.
A major recovery for the Indian currency!
#IndianRupee #USDINR #IndiaEconomy
post-image
USDINR-0.42%
#AI科技股大跌加密市场承压 #WCTCS9 The AI sector adjustment is weighing on the crypto market mainly through declining risk appetite. BTC and U.S. tech stocks are now drawing on the same pool of capital and leverage, so when the AI sector falls, institutions reduce positions in both at the same time.

How the AI adjustment spills over into the crypto market
Same pool of capital: Hedge funds and multi-strategy funds buy both AI stocks and crypto assets, and when risk controls are triggered, they sell both at once.
Bitcoin treated as a high-beta asset: On November 5, the Nasdaq fell 5.5%, and Bitcoin also dr
post-image
ThisIsTranslateContent:
#AI科技股大跌加密市场承压 #WCTCS9 The AI sector correction is weighing on the crypto market mainly through a decline in risk appetite. BTC and U.S. tech stocks now share the same pool of capital and leverage, so when the AI sector falls, institutions reduce their positions in both at the same time.

How the AI correction spills over into the crypto market
Same pool of capital: Hedge funds and multi-strategy funds invest in both AI stocks and crypto assets, and when risk controls are triggered, they sell both at once.
Bitcoin treated as a high-beta asset: On November 5, the Nasdaq fell 5.5%, and Bitcoin also dropped about 5.5%, falling below $76k.
Leverage cascade: About $1.2 billion in long positions were liquidated in a single day, pushing prices down even further than spot markets.

Impact of next week’s CPI and PPI
October CPI is expected to come in at 3.7% year-over-year, with core CPI at 2.6%. It is the last inflation report before the December rate meeting.
If the data comes in hot, rate hike expectations will rise, and AI stocks and BTC may come under pressure together;
If inflation cools significantly, both will have room to breathe.

How long will the correlation last
It will likely remain strong in the short term. The 30-day correlation between BTC and the Nasdaq is already above 0.6, near historical highs.
For the correlation to truly weaken, watch for these signals:
Bitcoin stops breaking down when U.S. stocks fall, or even strengthens against the trend.
Gold rises while Bitcoin falls again.
ETF net inflows resume, signaling that institutions are starting to rebuild positions.

For now, the key is whether CPI and the AI sector can stabilize. If neither does, it will be hard for BTC to stay out of the fallout.

repost-content-media
BTC-0.65%
XAUUSD-0.45%
$AKE The truth behind the surge: Major players are “taking out shorts to make an example of them”—chasing longs now is like catching a falling knife!

The pump isn’t an act of kindness; it’s meant to liquidate shorts. High volume doesn’t mean a bottom—it’s a trap for longs.

My view: The one-hour chart shows high volume and a long upper wick, alongside fund flows showing “long-term bleeding and a short-term pulse.” This rally is essentially a short squeeze, not a reversal. The whale long/short ratio is 88.2%; longs are sitting on +290k in unrealized profit, while shorts are stubbornly holding
AKE+6.39%
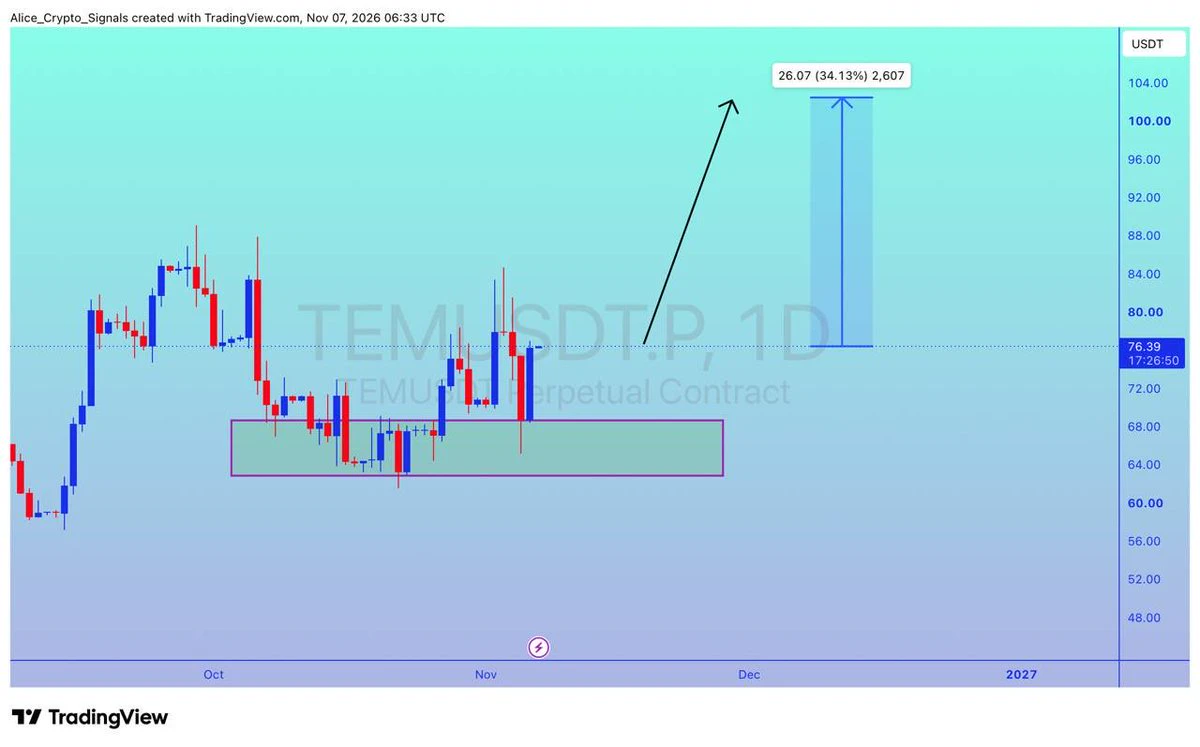
$TEMU
UPDATE
#TEMU is getting a good volume here. In this move we can see 30%+ gain here ✍🏻
#TEMUUSDT #TEMUBTC #BTC #Bitcoin #NFTs
post-image
BTC-0.67%
Zec market update
live-cover
LIVE2,001
#BTCETFOutflowsContinue
U.S. spot Bitcoin ETFs have experienced a notable shift in momentum, recording significant net outflows over the recent trading sessions. According to data from SoSoValue, daily net outflows exceeded $400 million on consecutive days heading into November 6, 2026, contributing to a substantial reduction in total net assets.
This trend raises key questions regarding institutional behavior. While Bitcoin's price has demonstrated resilience, holding above $75,000, the sustained exit from ETF products suggests a tactical rotation or temporary risk aversion rather than a str
post-image
BTC-0.31%
  • 6
Go long on $ONDO . Entry: 0.3682 - 0.3701 Take-profit range: 0.3870 - 0.401 Stop loss: 0.3572 ONDO is gearing up for a rebound; let's ride this rebound until it reaches structural resistance. Note: The bearish trend on the 1-hour timeframe remains dominant; price may face resistance and pull back at 0.3730. Don't go all in, bro. Position size should suit your own account.
post-image
ONDO-0.29%
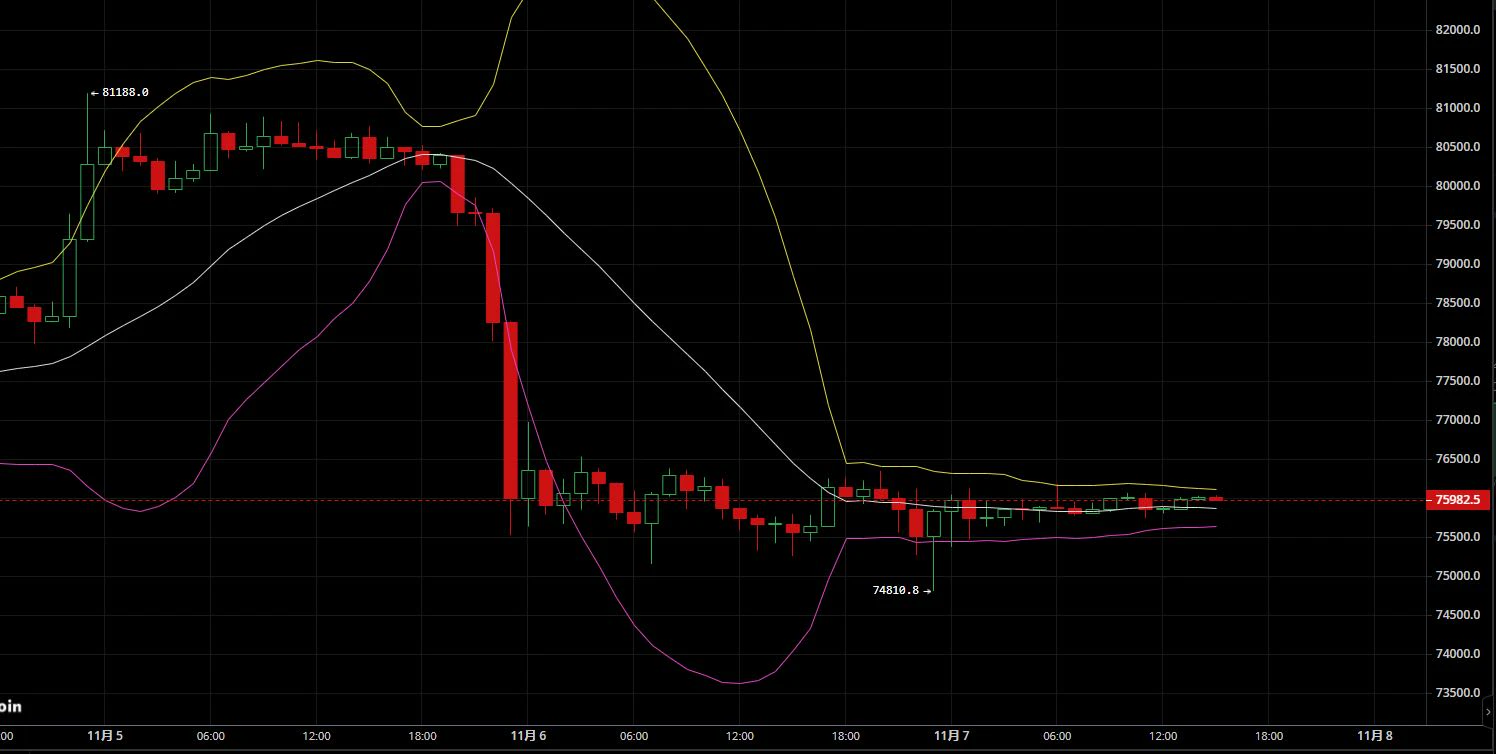
Nov 7: BTC weakly range-bound over the weekend; sell the rebound
【Today's Strategy】
Entry timing: Price rebounds to the 76200–77000 range
Stop-loss: 77600,
Take-profit:
First target: 75000–74800,
Second target: 74300–74000
【Core Logic】
October nonfarm payrolls broadly exceeded expectations: 165,000 jobs added (market expectations were just 59,000–65,000), the unemployment rate unexpectedly fell to 4.1% (forecast 4.2%), and average hourly earnings rose 0.4% month over month (forecast 0.3%); August and September figures were also revised up by a combined 84,000. The "three consecutive hot readin
post-image
BTC-0.67%
NAS100+1.90%
#USNonfarmPayrolls
US Nonfarm Payrolls (NFP): Stronger Than Expected – What Does It Mean for the Markets?
The US Nonfarm Payrolls (NFP) report remains one of the most important economic indicators for global financial markets. Released monthly by the US Bureau of Labor Statistics (BLS), it measures the number of jobs added or lost across the US economy, excluding agricultural employment.
The latest October 2026 employment report, released on November 6, delivered a stronger-than-expected result, signaling renewed strength in the US labor market.
📊 Key Highlights of October NFP
Nonfarm Payro
XAU+0.38%
Rumors say GPT has started banning accounts en masse?
I bet it wouldn't dare ban a single account that logged in directly with an Apple ID👀
post-image
$MITO is performing impressively, up as much as 18.82%! A strong breakout has pushed the price close to $0.0080. If buyers break through $0.00809, a new rally may be ahead! Entry: $0.00770 – $0.00785Target: $0.00810 / $0.00835 / $0.00860Stop-loss: $0.00735
post-image
MITO+8.51%
Streamers win with words, creators with talent? At Gate’s annual awards, who will have the last laugh?

There are two kinds of people in crypto who are especially worth following: streamers who can explain complex market movements clearly in their livestreams, and creators who can make market trends easy to understand in their writing.
One keeps you hooked as you listen; the other keeps you reading.
Now, Gate’s annual social awards for streamers and creators are here! In this year-end showdown, will streamers’ popularity come out on top, or will creators’ content prove stronger?
For streamers,
MU+4.71%
  • 10
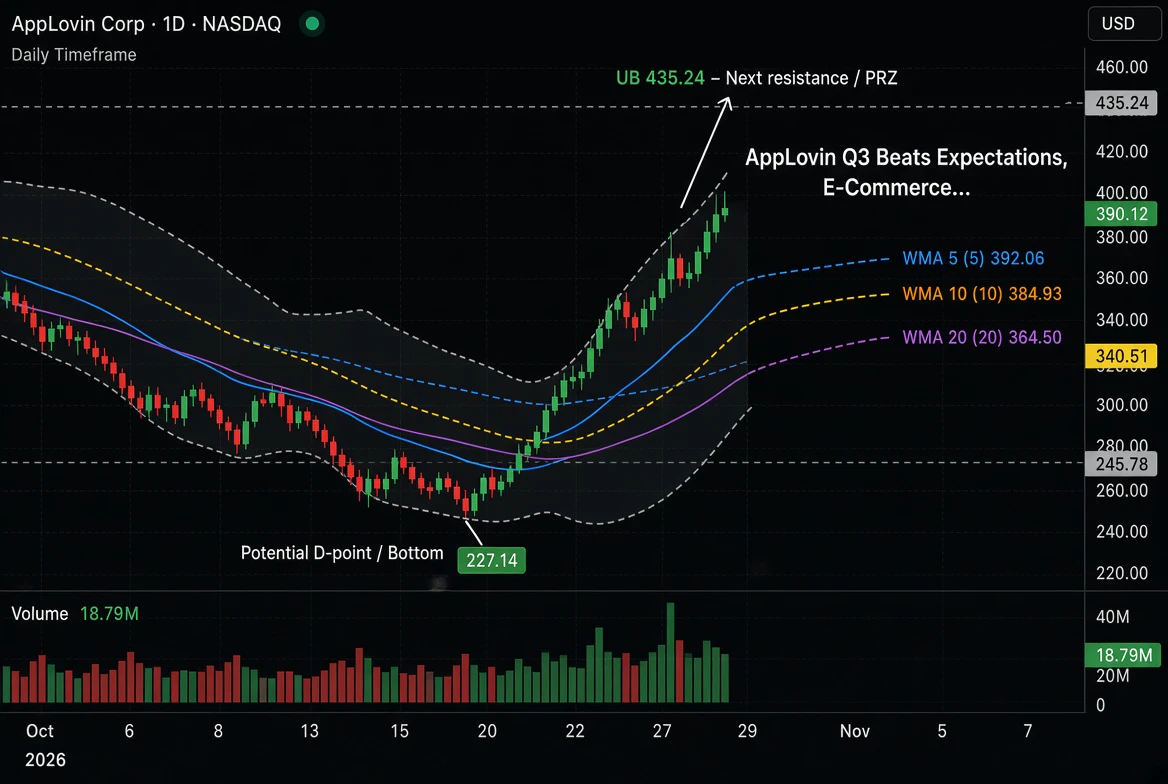
$APP ‌

Decoding the Bull Run: Analyzing AppLovin (APP) with the Gartley Pattern

While the chart above for AppLovin Corp (APP) shows a massive bullish breakout (up nearly 10% in a single session), we can use the principles of the Gartley pattern and the visible technical indicators to understand the momentum behind this move and where the stock might be headed.

Analyzing the APP Chart

Looking at the daily chart for AppLovin, we see a textbook example of harmonic movement turning into a parabolic trend.

1. The "W" Formation (The Setup)
If we look at the price action leading up to the recen
post-image
APP+9.73%
  • 4
What Is Trading Expectancy? How Can You Tell Whether a Strategy Has an Edge Over the Long Term?

In crypto trading, some people review their win rate every day and look for better entry points, but overlook a more fundamental question: If you repeatedly trade according to the same set of rules, how much can you expect to earn or lose on average per trade over the long term?

That is the question trading expectancy aims to answer.

First, what is trading expectancy?

Trading expectancy is the theoretical average return per trade under a given strategy and set of statistical conditions. It analy
Load More

Join 40 M users in our growing community

⚡️ Join 40 M users in the crypto craze discussion

💬 Engage with your favorite top creators

👍 See what interests you

Trending Topics

USAIStocksHitHard

15.97k Views3.65k Discussing

U.S. stocks sold off sharply on Thursday, November 5 (UTC). The Nasdaq closed down around 5.5%, entering correction territory, while the Philadelphia Semiconductor Index plunged roughly 12%, with chip stocks including $NVDA and $AMD posting steep losses. Beyond profit-taking, investors are growing concerned about the pace of AI data center construction, capital spending, and future returns on investment. The key question now is whether the AI sector’s lofty growth expectations need to be repriced. Where do you think the next opportunities will emerge: chip stocks, tech giants, or other sectors?

USNonfarmPayrolls

23.64k Views4.26k Discussing

StakeOnLaunchpoolToShare450KVLX

2.62k Views779 Discussing

View More