Square
Following
Hot
News
Notifications
Profile
Share your thoughts
placeholder
Article
Whales Mves in Sync!
live-cover
LIVE86
BTC-0.67%
ETH-1.26%
ZEC+1.16%
SOL-0.77%
USDC+0.01%
$KOR 305.2 million tokens unlocking on December 4,
post-image
  • 2
Trenches
IDOL
I
bade
b
IDOL
0x3b...ab07
Market Cap
$.
Change
.
24h Vol
$.
Holders
.
PIEVERSE
P
bade
b
PIEVERSE
0x0e...25a9
Market Cap
$.
Change
.
24h Vol
$.
Holders
.
FIONA
F
bade
b
FIONA
B34n...pump
Market Cap
$.
Change
.
24h Vol
$.
Holders
.
Singularity
S
bade
b
Singularity
7R4M...pump
Market Cap
$.
Change
.
24h Vol
$.
Holders
.
CLAUDIA
C
bade
b
CLAUDIA
2j5S...W2ZM
Market Cap
$.
Change
.
24h Vol
$.
Holders
.
$NVDAB 131.05, 24H +1.61%. The 1h chart looks relatively strong, but RSI at 69 is nearing overbought territory. Volume is only 0.21x the average, and price has yet to break above the 131.5 resistance. I’m watching this level closely: I’ll only consider higher prices if it holds above 131.5; a break below 127.4 would turn the short-term outlook bearish. Short-term momentum is still settling, so I’m mostly waiting for a clear direction before acting. I’ll watch the chart and decide. Keep monitoring. No need to rush. Not investment advice
#NVDAB
post-image
Long
$DODOX ‼️ Entry price: 0.03950 - Current price take profit: 0.04366 Stop loss: 0.03600
post-image
DODOX
DODOXDODOX
Pump.Fun
MC:$2.22KHolders:87
32.76%
$NVDA ‌
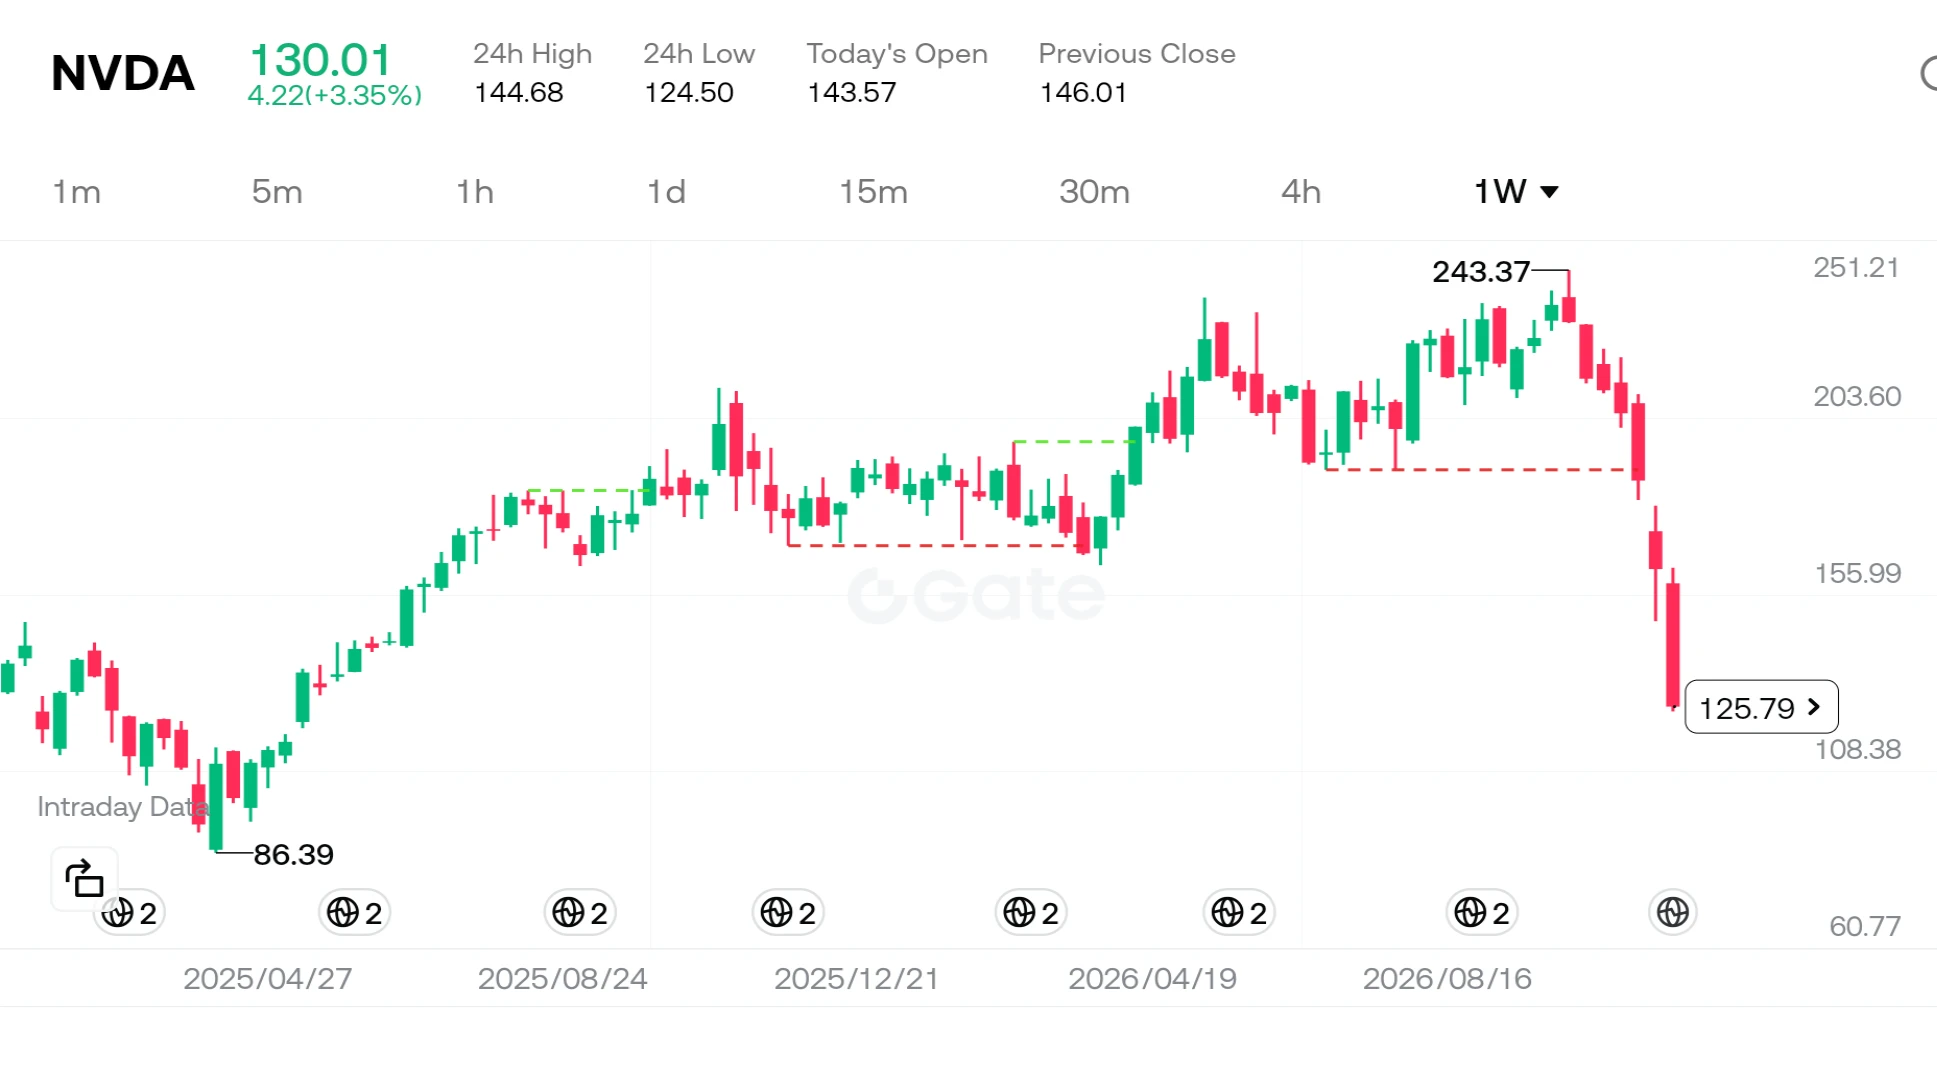
Nvidia has been losing ground for seven consecutive weeks—a trend not seen since 2008. The stock plummeted 14% last Friday alone, bringing its total decline over this seven-week period to approximately 46%. As clearly illustrated on the chart, the price has retreated from a peak of $243 to the $125 range. So, what is the story behind how this once-most-valuable company reached this point?

In reality, this is not merely a stock market correction; it is the result of three major, intersecting storms hitting the same vessel.

First, let’s look at the company’s internal dynamics. Uncerta
post-image
NVDA-13.84%
  • 7
  • 2
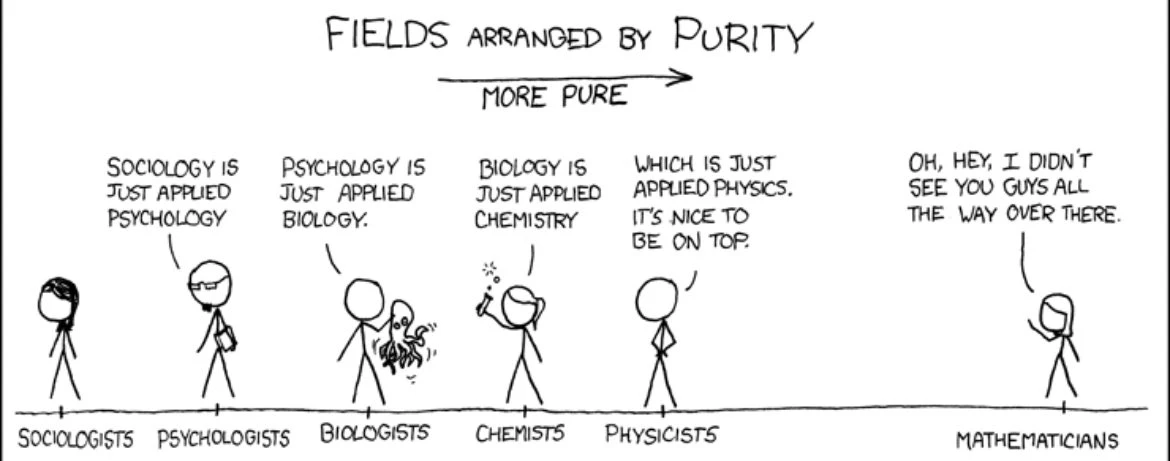
Mathematicians getting dropped a peg or two😂😂😂
post-image
U haven't felt enough pain yet
Buckle up alt coiners
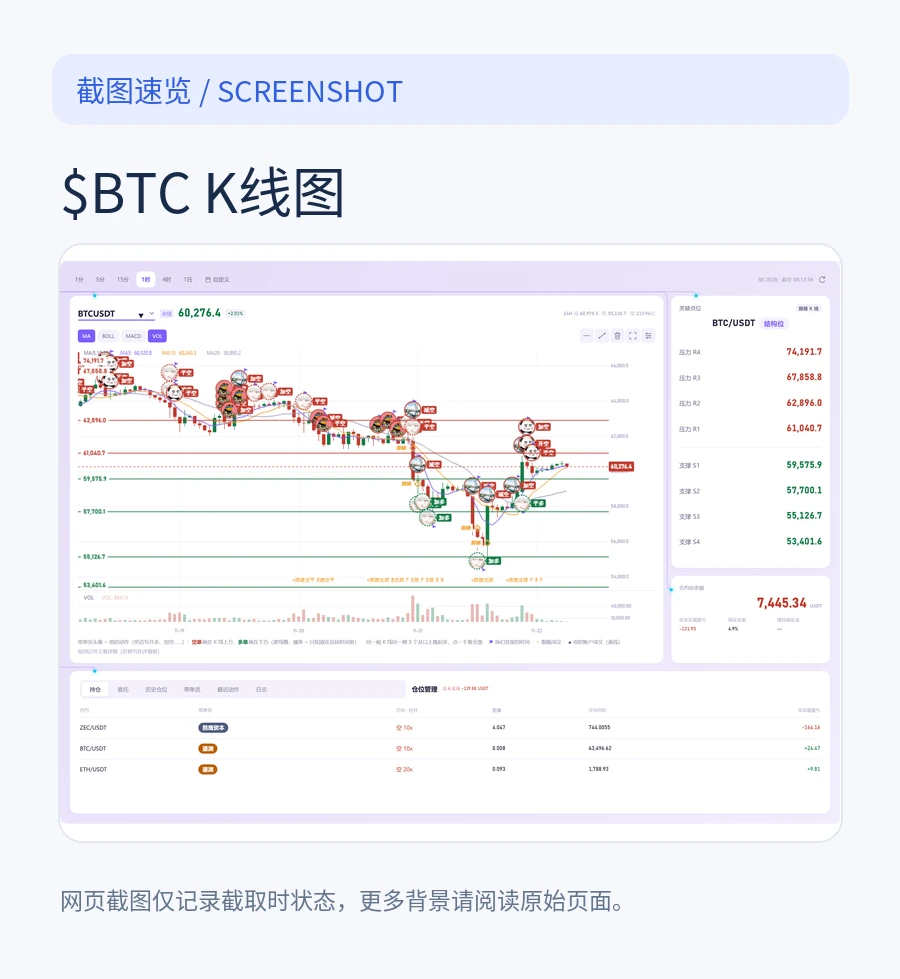
$btc
post-image
BTC-0.67%
Parabolic blow-off top confirmed; the long squeeze has begun. It’s time to ride this downtrend all the way down. Join the shorts, contact $IDOL . Entry: 0.038756 - 0.039609 Target area: 0.035035 / 0.031717 Stop-loss: 0.042299 Note: Extreme volatility may trigger a stop-loss sweep and a rebound to 0.04100 before the final leg down. Don’t go all in, bro. Manage your position size based on your account.
post-image
IDOL-6.71%
#NvidiaDropsNearly14Percent #ShareWeekly
Nvidia has attracted significant attention across global financial markets following a nearly 14% decline in its share price. As one of the most influential companies in the artificial intelligence industry, Nvidia plays a central role in the development of advanced computing, data centers, and AI infrastructure. Its recent decline has raised important questions about investor confidence, technology stock valuations, and the sustainability of the AI investment boom. Because Nvidia is widely viewed as a leading indicator of the broader AI sector, weaknes
NVDA-13.84%
AMD-13.27%
NDAQ-0.95%
Okay, $SKHYNIX , we understand—the resistance level is hard to break through today. You’ve worked hard enough, and it’s time to catch your breath. Let’s see whether you have the strength to keep going or whether it’s time to call it a day. TP: 734.06SL: 796.72Other coins: $ZEC : Current price 786.23 - 24-hour change: +6.28%$PIEVERSE : Current price 3.4076 - 24-hour change: +14.87%
post-image
SKHYNIX+1.41%
ZEC+1.16%
PIEVERSE+0.58%
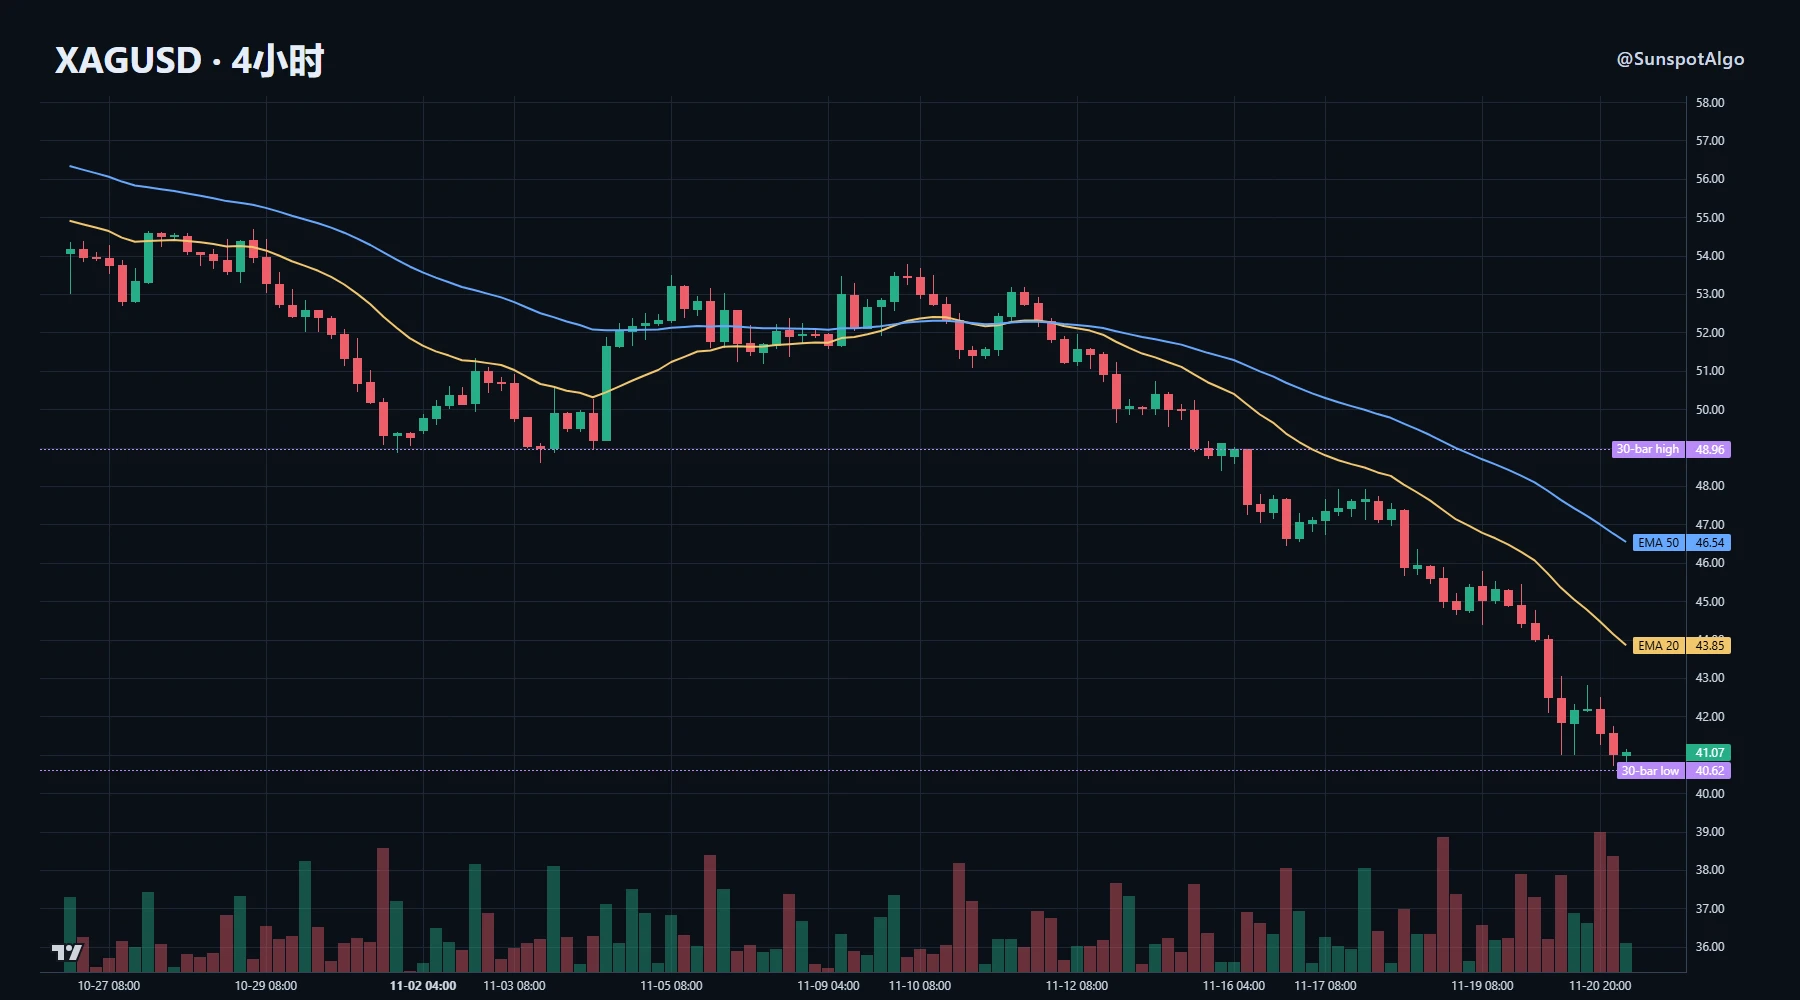
The rhythm of this silver sell-off is more noteworthy than its magnitude.

A roughly 16% drop over 5 days pushed silver to the bottom of its 30-day range at 40.9, while gold fell less than 10% over the same period. The chart’s rhythm has three notable details: the 4H 20-period moving average is at 43.9, while price is at 41.1, a deviation of over 6%; the volume ratio is 1.76, clearly indicating elevated volume; and ATR is at the 92nd percentile of the past 60 candles. The long lower wick around 40.6 was a classic stop-loss sweep: after breaking below that level, price failed to reclaim it, and
post-image
XAG+0.47%
XAU+0.38%
NBA & NFL best week I can remember.
Is this day and age I should start charging $999.98 a month now right?
post-image
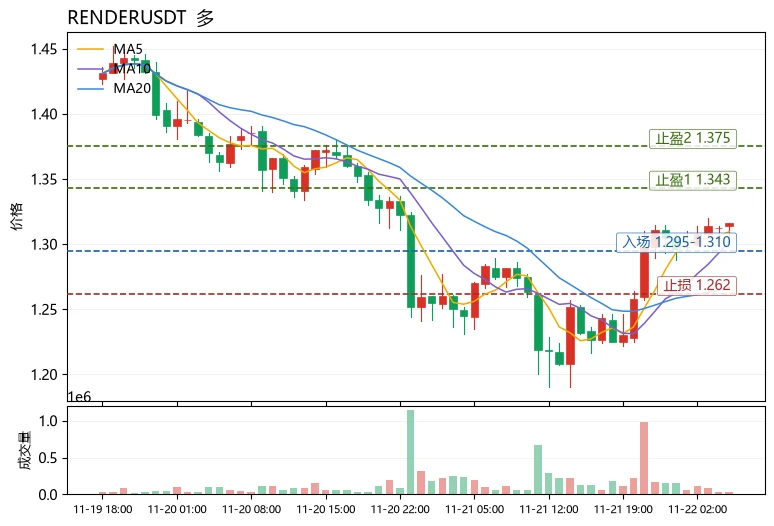
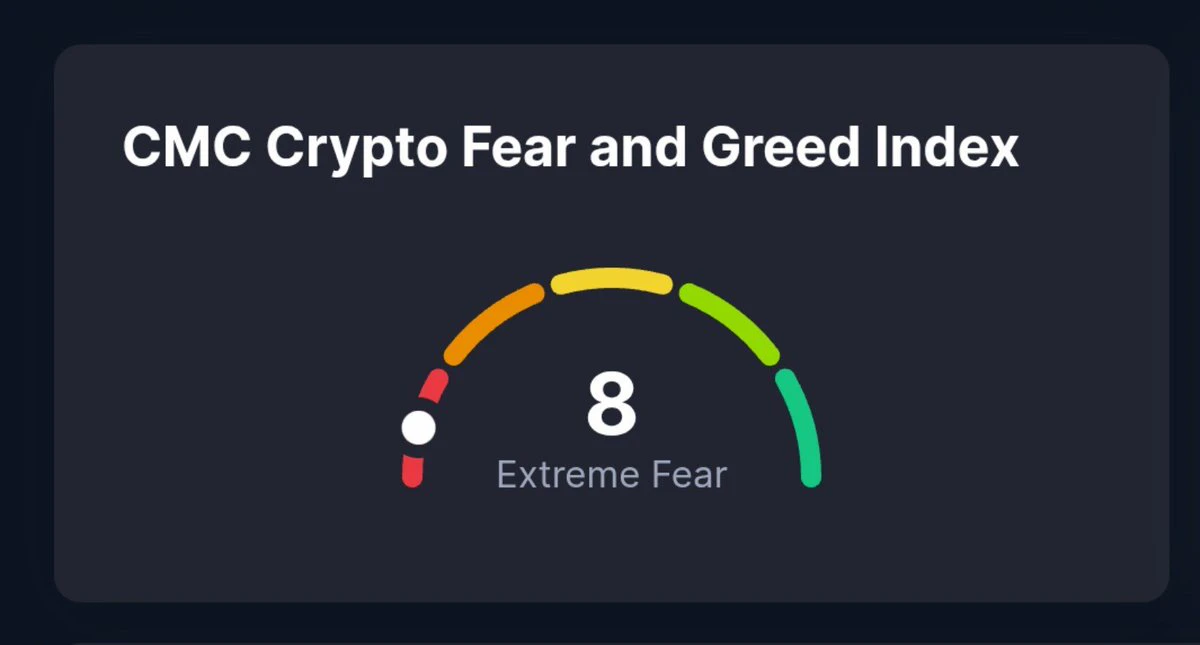
Fear and Greed Index is only 12, and the market is in the extreme fear zone, yet $RENDER bucked the trend and rose 3.62%—this divergence is the most unusual detail in today's market. Funds are not pulling out amid fear, suggesting bulls are quietly accumulating.
Technically, $RENDER is currently at 1.316, with MA5=1.3096 above MA20=1.2666, indicating a bullish short-term moving average alignment; RSI=59.0 is strong but not overbought, while the MACD histogram at +0.009781 maintains bullish momentum. The upper Bollinger Band at 1.34351 is the immediate resistance, and the price is trading near
post-image
RENDER+0.47%
DODO+11.43%
RARE-0.89%
$TAO Short thesis update: 186 is a resistance zone on the 4-hour chart. Price has already hit my take-profit target, so I’m watching closely now. If a 4-hour candle closes above 189, I’ll abandon the bearish view.
The current 4-hour price is 185, below the EMA50 (193), and bears still control the momentum. The stop-loss distance is about 1.8%, with 2.9% room to the third target. If TP3 is reached, the risk-reward ratio would be around 1.6R.
Short entry range: 185.2–185.6. Staggered targets: 183.4 → 182.1 → 180.1. Structural invalidation: 188.7
Where would you place your stop loss? This is not
post-image
TAO+0.41%
Watching $BARD hold these moving averages so calmly, honestly, I'm getting a little impatient. It clearly has strong momentum, so why does it feel like it's just pacing in place instead of actually speeding up? Is everyone waiting for a specific signal, or are we just admiring the view here? TP: 0.100SL: 0.092
Market dynamics:
$VVV : Current price 25.152 - 24-hour gain: +20.49%
$ETH : Current price 1,682.61 - 24-hour gain: +3.96%
post-image
BARD-1.24%
VVV+0.37%
I’m long $VVV . Trade parameters: Entry: 23.432 - 23.959 Target 1: 25.025 Target 2: 26.089 Exit: 22.495 VVV has temporarily pulled back at MA25 support; it’s time to add to the position again, kick off a new rally, and challenge the highs. Trade here with me. My list today includes
‍$NAORIS and $ETH .
post-image
VVV+0.37%
NAORIS+0.66%
  • 1
BTC stremer
live-cover
LIVE269
BTC-0.67%
ETH-1.26%
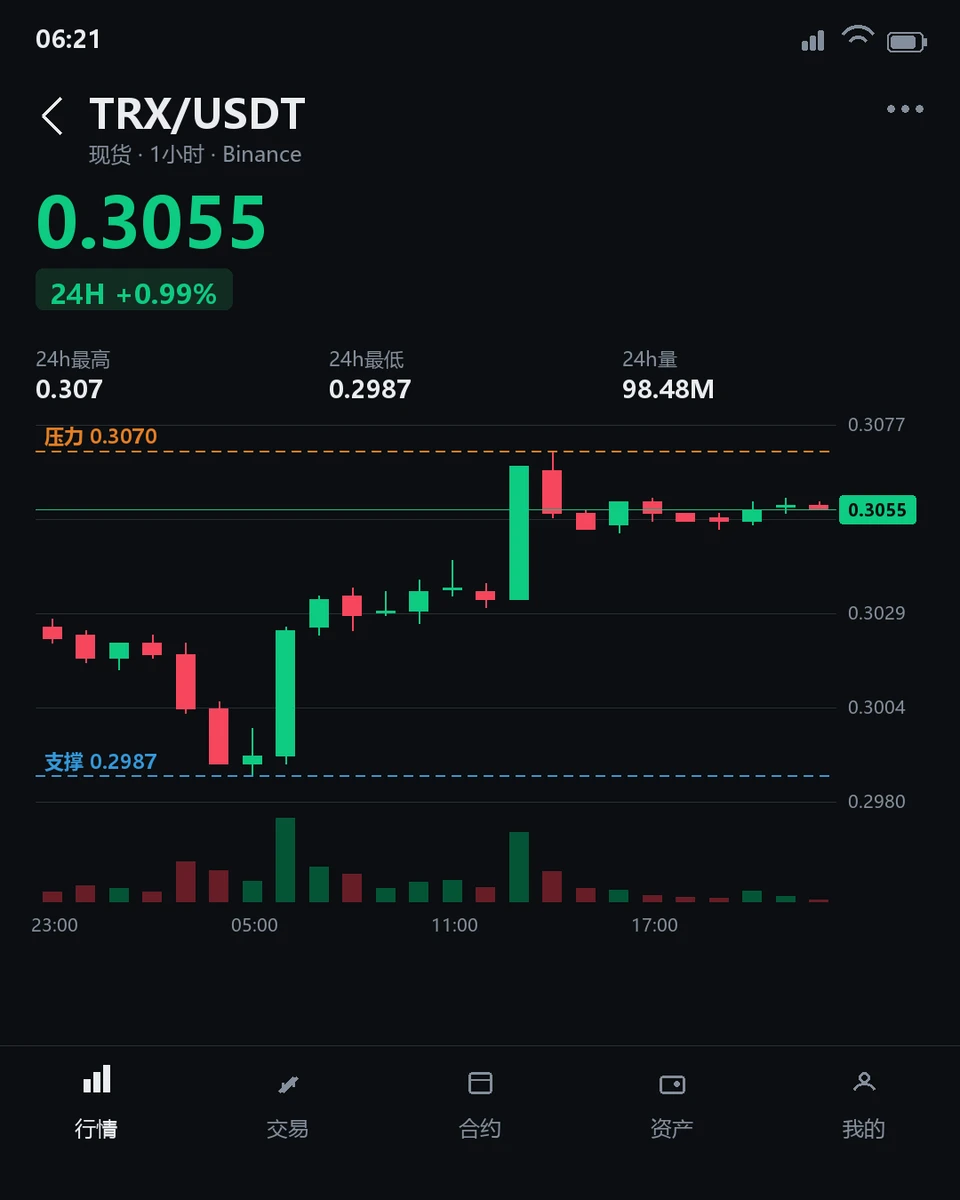
$TRX Is Strong in the Short Term but Weak on the 4-Hour Chart—Which Will Turn First?
$TRX is currently trading at 0.3055, up 0.958% over the past 24 hours, with an intraday range of 0.2987–0.307. The 1-hour chart shows strength, with the price above the EMA20 at 0.30456. The RSI14 is 67.53, in neutral-to-bullish territory, but the volume ratio is just 0.21, far below average, indicating limited participation from short-term buyers. The 4-hour chart remains weak: the price is still below the EMA20 at 0.30594, and the RSI14 at 37.21 has yet to recover from weak territory. Resistance is far above
post-image
TRX+0.42%
$BLESS ’s short opportunity is here—the 1-hour downtrend isn’t over yet, and the price has already fallen below MA25 on the 15-minute chart. It’s the right time to short with the trend. The breakdown was clean and decisive, delivering a 246% gain—profits secured.
The two assets to watch closely today: $DODOX and XRP.
$BLESS remains bearish, with a tighter stop-loss. Entry range: 0.012807–0.012905; take-profit targets: 0.01210–0.0115; stop-loss at 0.013292. This rebound is weak and is most likely a bull trap ahead of the next sell-off, so bears have reason to be optimistic.
But stay alert: if
post-image
314
314314
Pump.Fun
MC:$2.19KHolders:1
0%
BLESS-2.00%
An underlying code vulnerability proactively uncovered by an AI large language model is sounding the alarm for the entire industry. Bitcoin Core has officially disclosed a medium-severity flaw. Attackers can launch an attack by repeatedly broadcasting specific orphan transactions. This can cause affected nodes to experience message delays of more than ten seconds. Repeated transmissions can directly extend the downtime. The vulnerability was discovered by the Spiral team using AI scanning and officially confirmed. The development team has pushed urgent patches in new versions such as 30.5 and
post-image
BTC-0.67%
Load More

Join 40 M users in our growing community

⚡️ Join 40 M users in the crypto craze discussion

💬 Engage with your favorite top creators

👍 See what interests you

Trending Topics

BTCBreaksBelow60K

2.1M Views30K Discussing

BTC fell below $60,000 on November 20 for the first time since July, alongside a tech stock selloff and broader pressure on risk assets. Will $60K become resistance, or can BTC quickly reclaim it? What price or volume signals would convince you that selling pressure is easing?

GateDirectIPOPhase3ANTAllocates92100Shares

797.2K Views4.9K Discussing

NvidiaDropsNearly14Percent

333.9K Views7.6K Discussing

View More