
Square
Following
Hot
News
Profile
Share your thoughts
placeholder
Article
#AIN I got stopped out, and then it dropped. So painful
post-image
AIN+3.85%
Quick Long Plan $LYN
Entry: 0.0185 Take profit: 0.019-0.02 Stop loss: 0.017 Why go long? There is currently buying volume, and momentum is quite strong, indicating that buyers are firmly in control. The short-selling pressure above is stronger than the long pressure below. The upward angle is close to 75 degrees or higher, proving that buying pressure is strong.
post-image
LYN-0.44%
Trenches
ZIG
Z
bade
b
ZIG
0x8c...1145
Market Cap
$.
Change
.
24h Vol
$.
Holders
.
KIM
K
bade
b
KIM
8pjf...pump
Market Cap
$.
Change
.
24h Vol
$.
Holders
.
Anakin
A
bade
b
Anakin
Exxz...pump
Market Cap
$.
Change
.
24h Vol
$.
Holders
.
IDOL
I
bade
b
IDOL
0x3b...ab07
Market Cap
$.
Change
.
24h Vol
$.
Holders
.
BTC
B
bade
b
BTC
C5xp...pump
Market Cap
$.
Change
.
24h Vol
$.
Holders
.
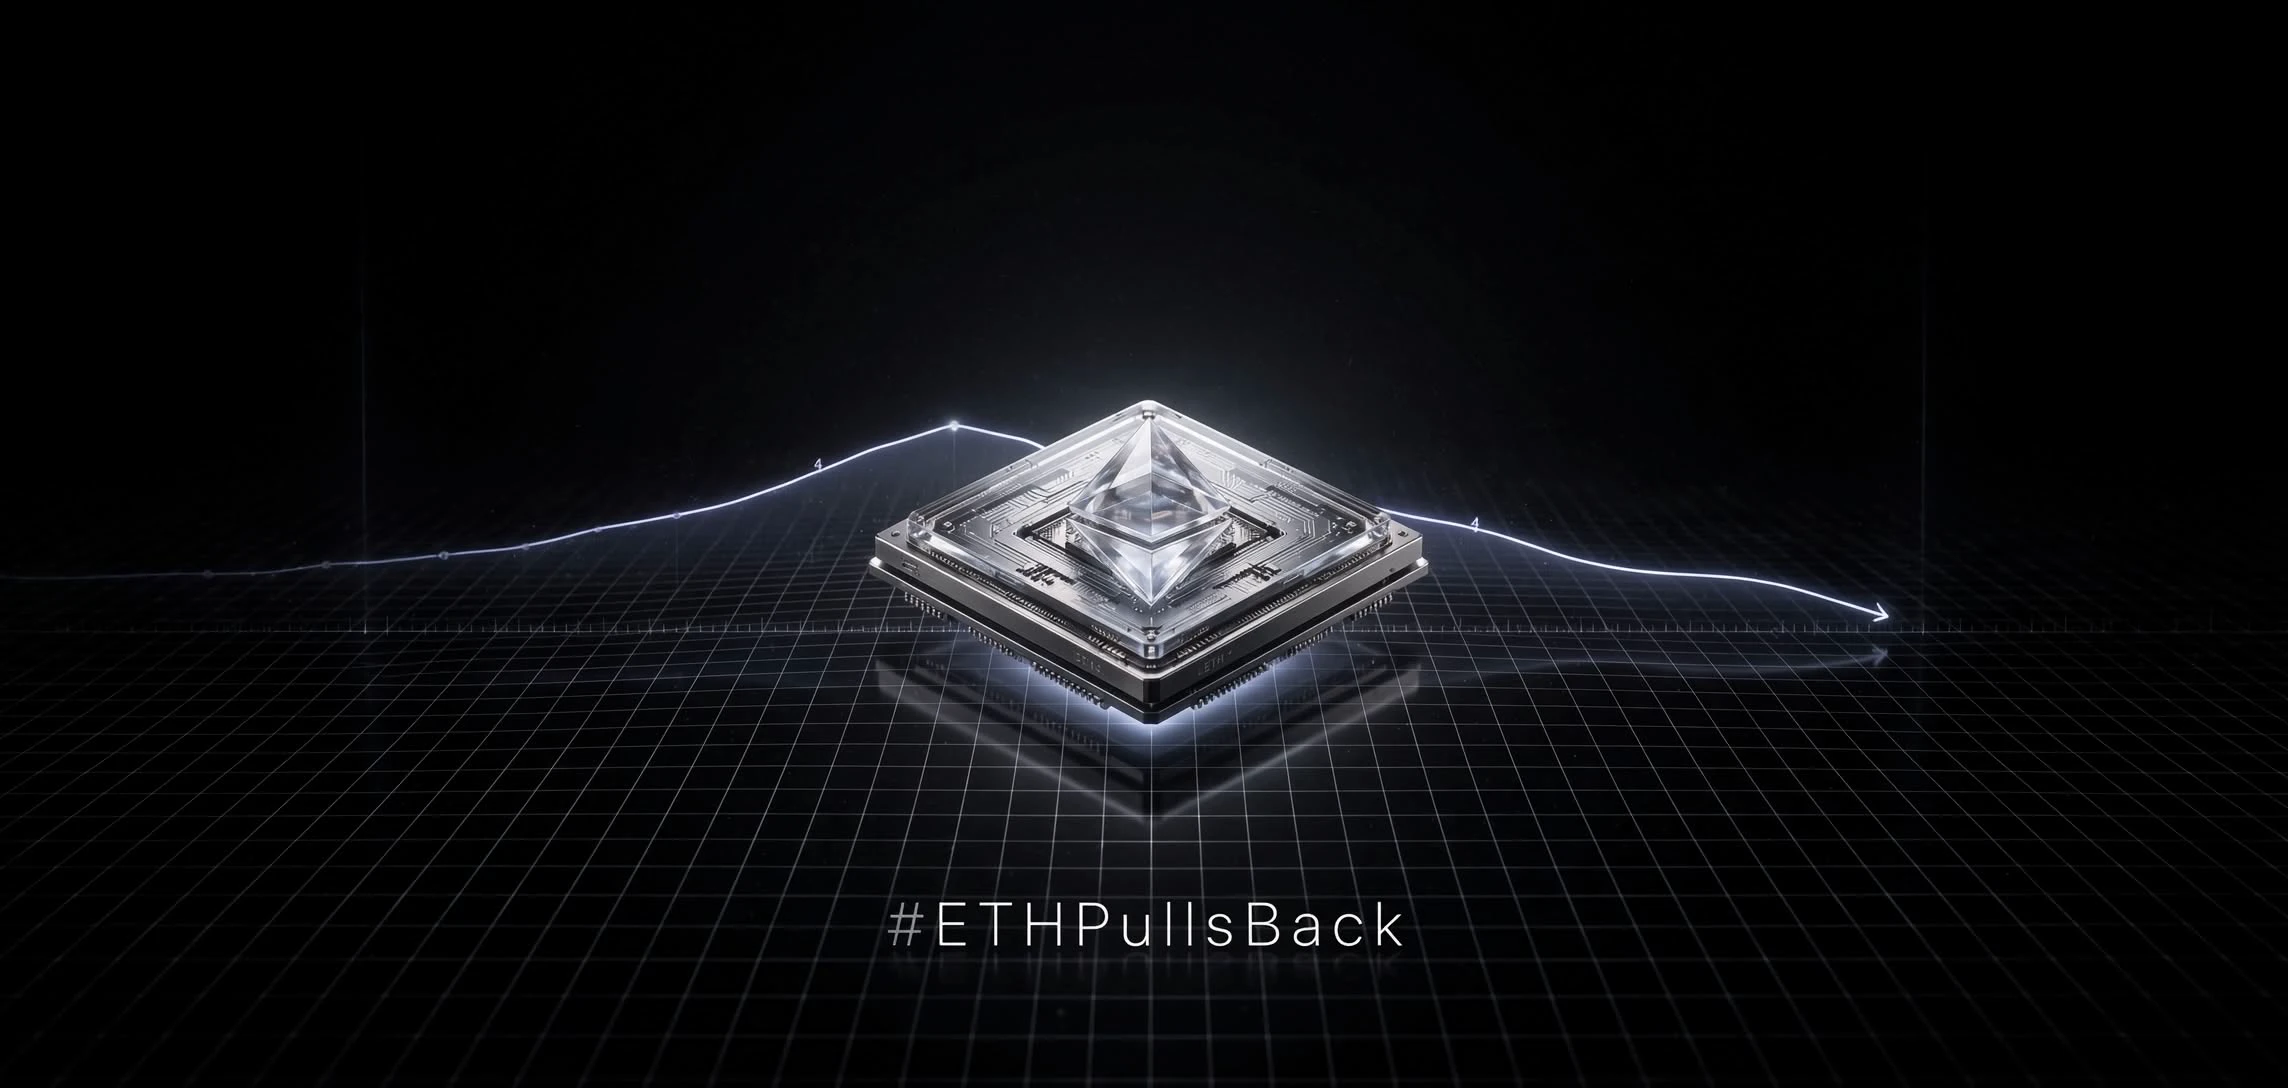
#ETHPullsBack
ETH shows a broad pull back that spans intraday and weekly charts, with each bounce capped by prior volume clusters.
Current Verified Board
Base you gave aligns with live feed: current price 2,263.72 USD, open 2,255.75, high 2,278, low 2,251.36, prior close 2,255.75, change +7.97, +0.35%. This is low range for year after heavy drop.
Recent prints in same feed show how pull back evolved:
• 3,730 USD early Nov, already under 4,000 and down 4% on day, 14% on month. • 3,310 USD consolidation on Nov 7, with upside capped by short moving averages. • 3,122.32 USD on Nov 17, RSI 34.1 ov
post-image
ETH-1.26%
MARKET UPDATE
live-cover
LIVE1,839
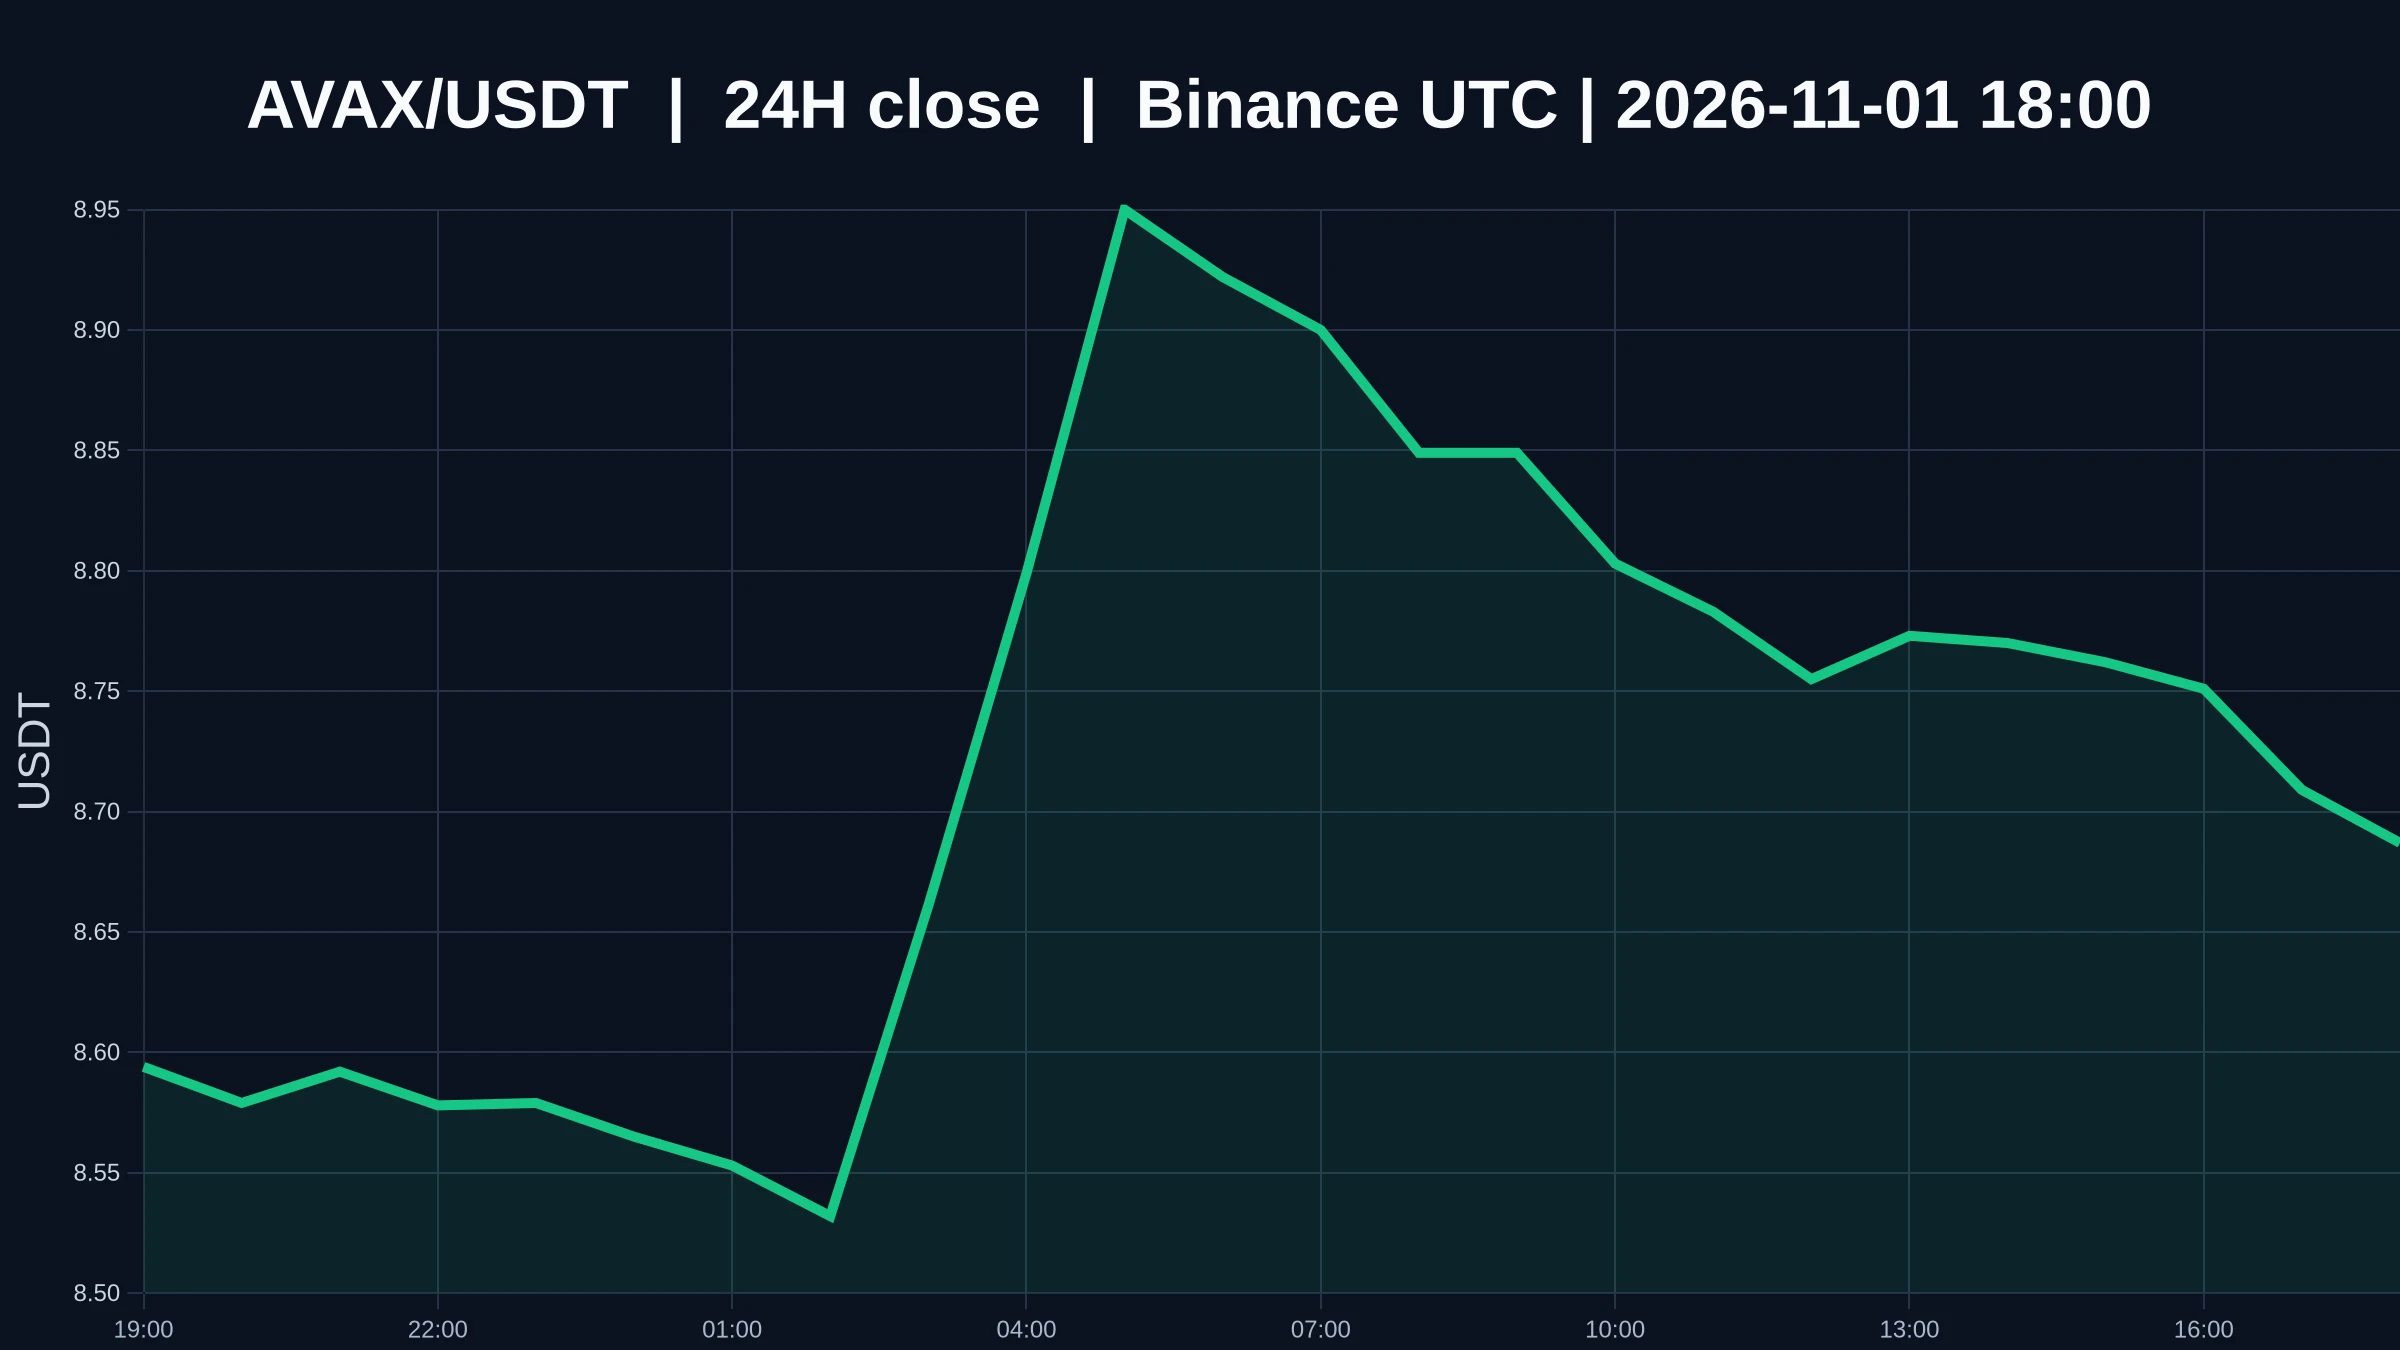
Divergence: $AVAX is currently at 8.684, weak on the one-hour chart but strong on the four-hour chart. The two timeframes have yet to align. The one-hour RSI is only 37.47, well below the neutral zone, while the four-hour RSI is 61.74, clearly higher than the one-hour reading. This clash between timeframes looks more like an unconfirmed direction than a trend reversal. If the one-hour weakness cannot even hold the intraday low of 8.524, what evidence remains for the four-hour strength? Trading volume is only a little over 20% of the average, indicating insufficient participation and that neith
post-image
AVAX-0.10%
Hello everyone! Strategy from tonight through Monday daytime:
BTC: Long at 76900, stop loss 500, take profit at 78500
Short at 79700, stop at 80200, take profit at 77800
ETH: Enter in batches at 2230–2210, 2% and 3%; stop if it breaks 2200, and buy the dip at 2150
Short at 2290, stop at 2302, take profit at 2255
Short at 2315, take profit at 2288, stop loss 10 points
For SanDisk and Micron, consider placing orders every 50 and allocating 5% to spot stocks. They can still easily wick down to test the previous low at 800–900. Micron is stronger than SanDisk, with broader business operations and
post-image
INTC-28.49%
$UAI $UAI dropped exactly two targets—our bearish analysis
post-image
UAI-7.58%
#ShareWeekly Intel (INTC): The $65.18 Reality Check After a Historic Weekly Breakdown
The Week Intel’s Recovery Unravelled
Intel entered the week with improving momentum, but the final two sessions completely changed the chart. From Monday’s close of $90.47 to Friday’s close of $65.76, INTC lost approximately 27.31%. The stock briefly reached a weekly high of $95.68 on October 28, but the recovery failed to hold.
The latest price reference I am tracking is $65.18. Since the U.S. market is closed on Sunday, this should be treated as a reference price rather than a new regular-session closing pr
post-image
INTC-28.49%
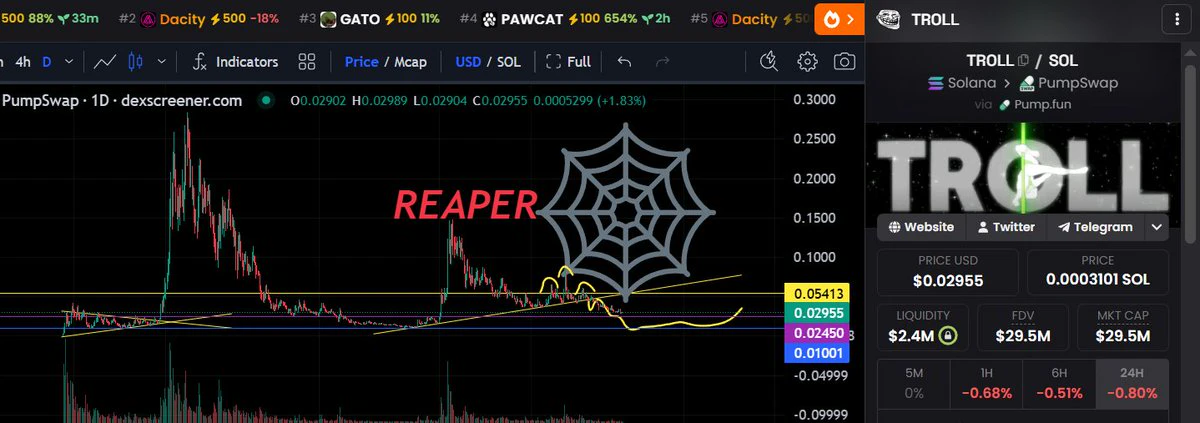
I drew this a month ago and forgot about it
$TROLL
post-image
TROLL-0.61%
$ETH Crypto Market Academician: 11.2 Ethereum (ETH) daily death cross, green histogram bars still not shrinking, but is the 4-hour chart quietly showing divergence?
  
  Here’s the bottom line: Ethereum is not at a bottom right now; this is a weak rebound within a continuing downtrend. Don’t shoot the messenger—on this leg down from 2800, how many people called for buying the dip, only to get trapped every time? I won’t waste your time today. I’ll just lay out the facts using two charts: where the price is now, where resistance and support are, and what you should do. If you find this useful,
ETH-1.23%
Holy shit!!!!!
Woke up in the middle of the night
My phone was burning hot
Turns out Elon Musk followed me
Is he trying to ride my clout?😉
post-image
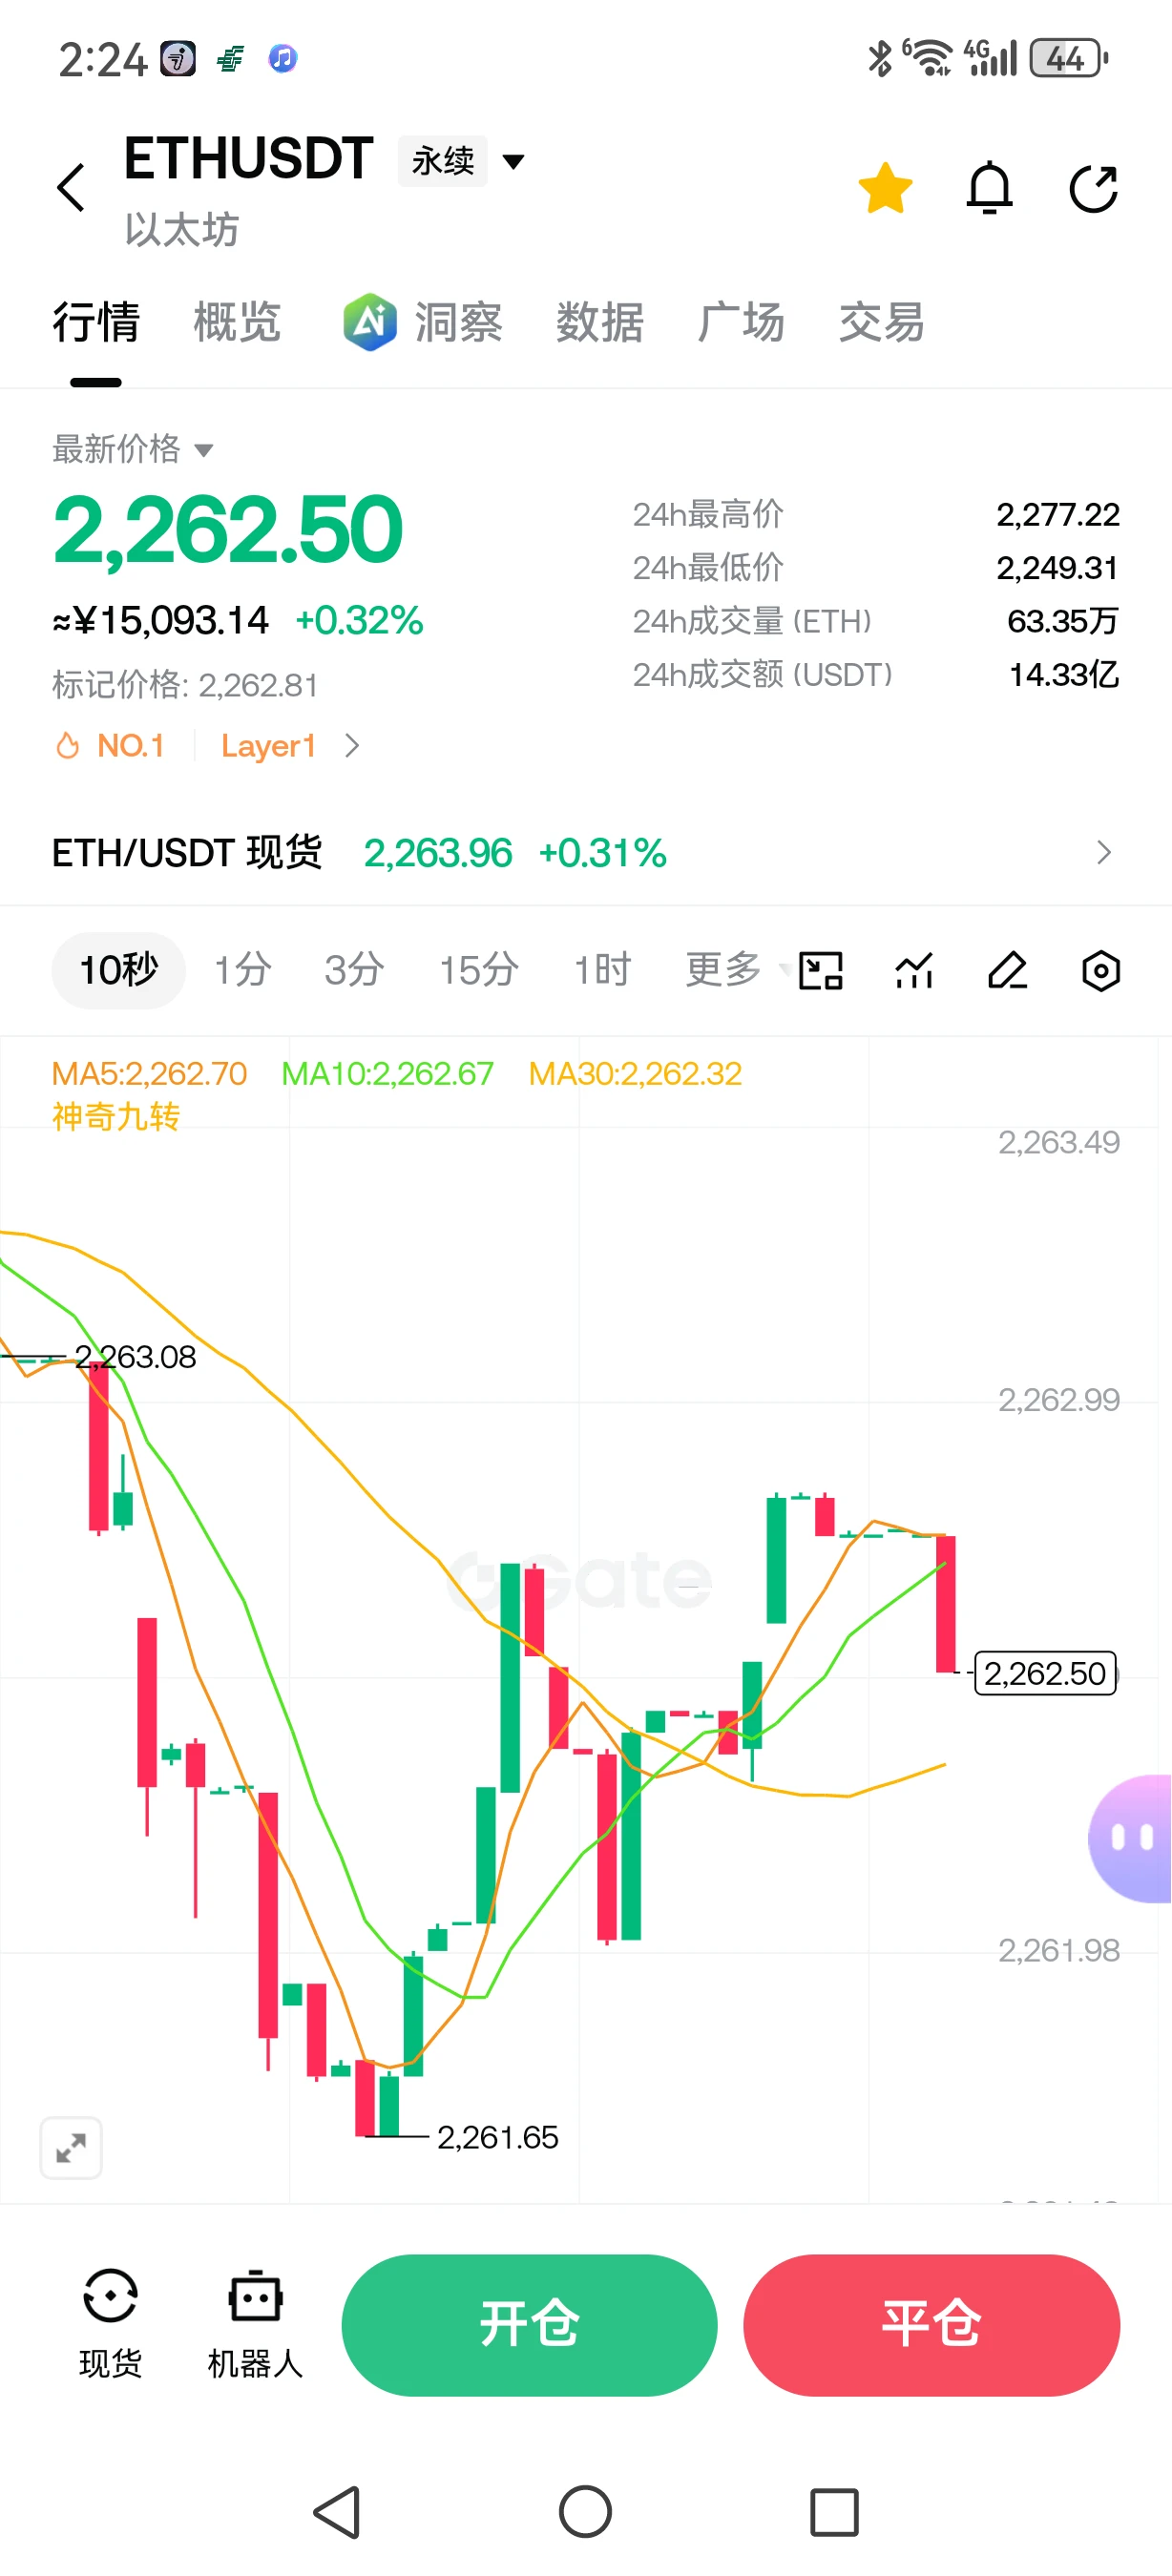
$ETH Short around 2260, take profit at 2230-2195, and set a stop-loss at 2275. Follow me for precise strategies every day, and join my livestream at 8:30 every night to share strategies, place trades, and go straight for the gains
post-image
ETH-1.26%
#BTC大跌 𝗢𝗿𝗮𝗰𝗹𝗲 𝗥𝗮𝗹𝗹𝗶𝗲𝗱 𝟭𝟬.𝟳𝟯%, 𝗔𝗹𝗽𝗵𝗮𝗯𝗲𝘁 𝗧𝘂𝗺𝗯𝗹𝗲𝗱 𝟭𝟮.𝟲%, 𝗮𝗻𝗱 𝗳𝗼𝗿 𝗧𝗵𝗿𝗲𝗲 𝗗𝗮𝘆𝘀 𝘁𝗵𝗲 𝗠𝗮𝗿𝗸𝗲𝘁 𝗚𝗿𝗮𝗱𝗲𝗱 𝗔𝗜 𝗦𝗽𝗲𝗻𝗱𝗶𝗻𝗴 𝗼𝗻 𝗖𝗮𝘀𝗵
Oracle gained 10.73% to $144.54 on October 28, Microsoft rose about 4% after hours, and Alphabet fell 12.6% on October 29, its worst day ever. One correction to the usual framing: Oracle's jump came at its Investor Day, not an earnings report. The three reactions show one shift. The market stopped paying for AI spending itself and started asking when capex peaks, when free cash flow turns positive and how
post-image
BTC-0.67%
ORCL-6.36%
MSFT-1.60%
GOOGL-1.32%
NDAQ+0.65%
Pay special attention to $MAGMA because it’s moving sideways, while the trend over the past 1–2 days has been steadily rising. Also, there’s a high chance of a sweep in both directions. Traders, be careful and set up clearly for a sweep in both directions. I’m taking a small long position. Entry: 0.45 TP: 0.47-0.48 SL: 0.4
post-image
MAGMA-0.57%
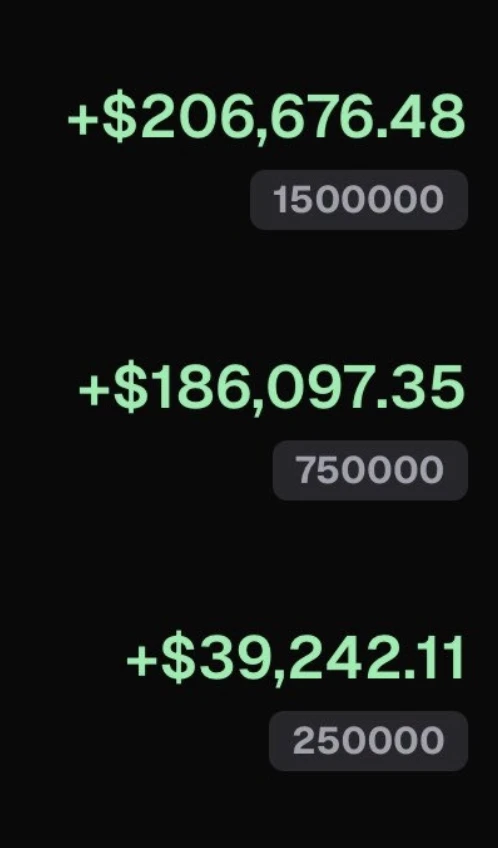
the timeline at the end of the month is always ragebait
there are the winners. you see pnl's of six figs, some even seven. they come from different terminals, social trading apps. (some from devving/bundling apps 😭)
you end up asking yourself "wow did i miss that many runners?"
or the occasional thought of "damn i rly underperformed..."
but then there are the losers too. oftentimes, they are nowhere to be found... especially on crypto twitter.
but trust me, they are always there.
this is a market at the end of the day. the money has to go from person A to person B.
naturally, there are winner
post-image
MEME-0.94%
SOL-0.77%
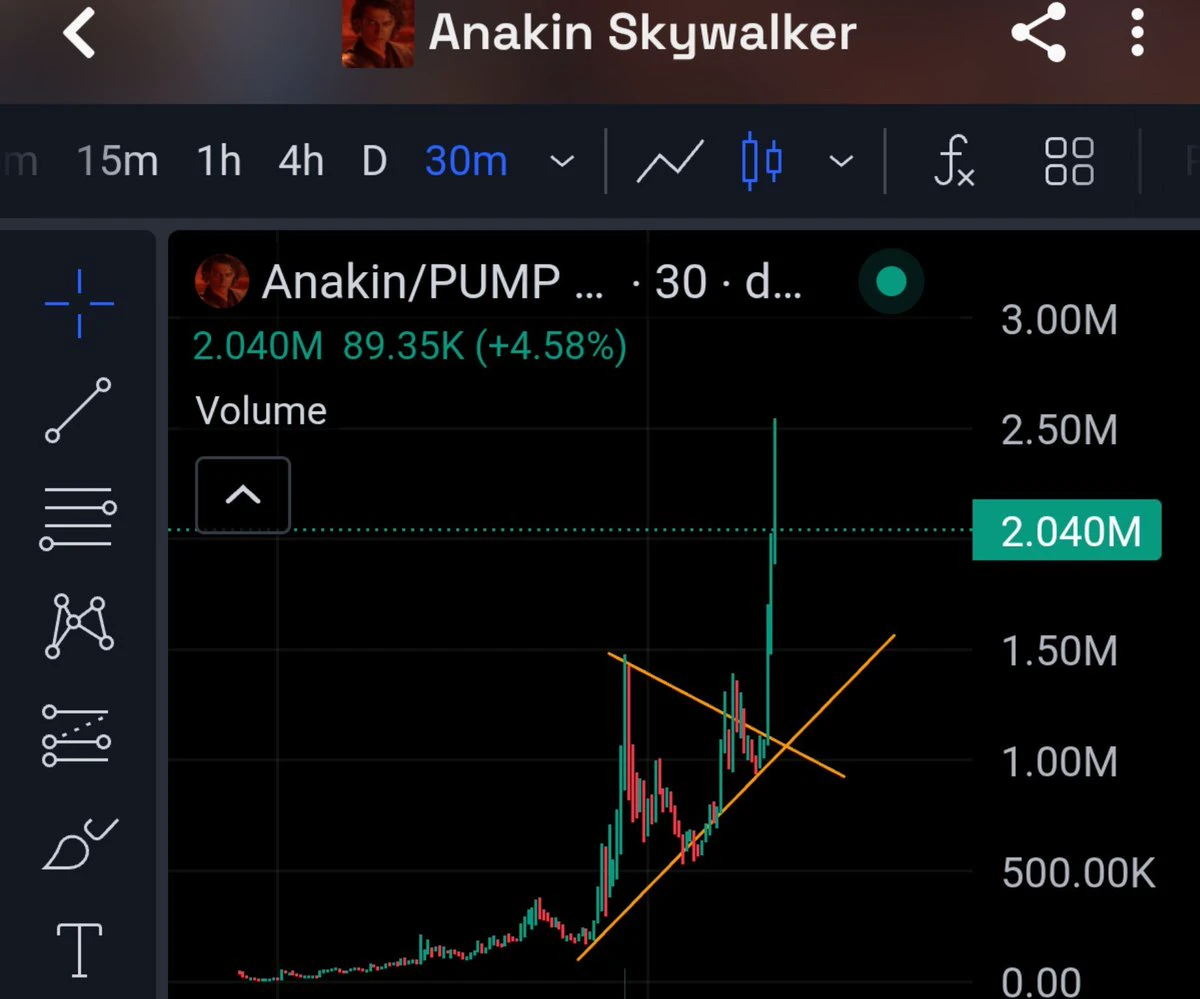
Pressure 🌊🎢
$Anakin
post-image
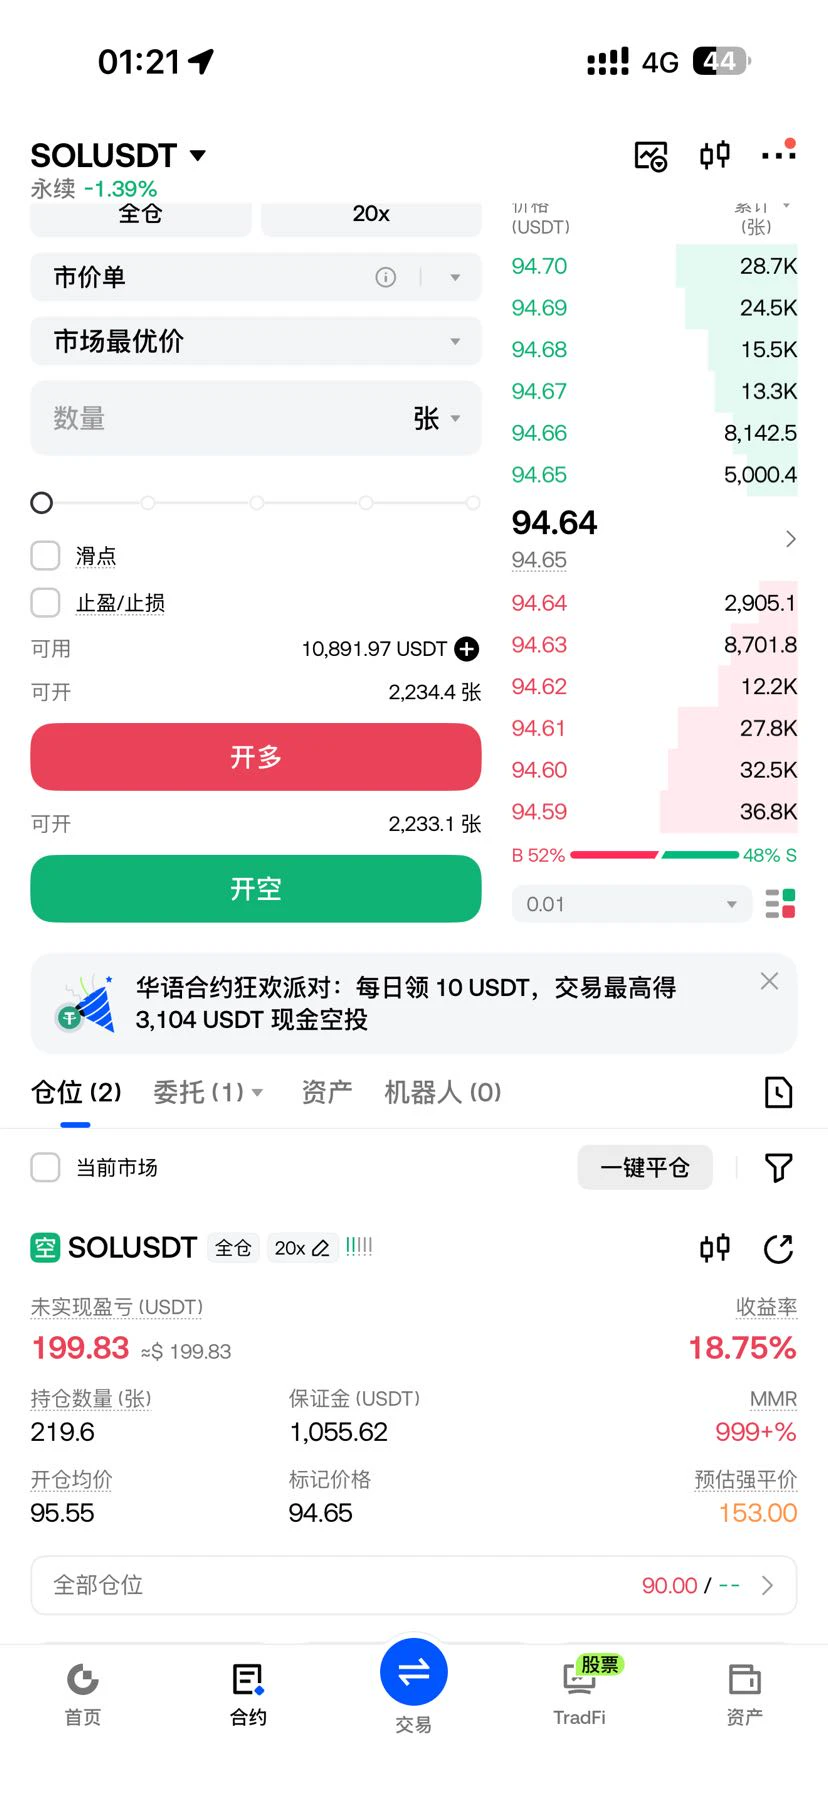
Just as I predicted, shorting SOL offers slightly better risk-reward. If you guys aren't sure which way the market is heading, you can continue to short tomorrow after a short-term rebound, if one occurs. The market has already been compressed, and with bearish funding rates rising, shorting is more suitable.
post-image
SOL-0.74%
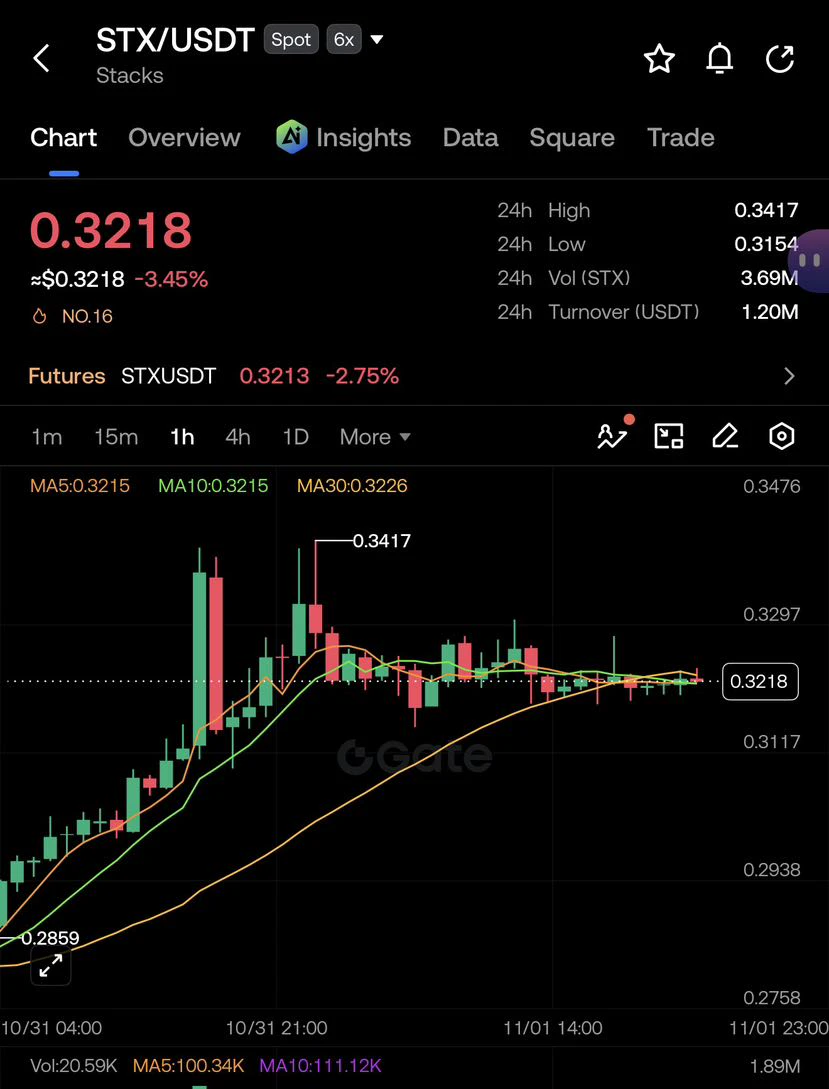
$STX is currently trading at $0.3218. Traders are keeping a close eye on Stacks as it navigates the current market conditions. A shift in momentum could bring fresh opportunities for a potential recovery. Stay alert and watch the next move!
post-image
STX+0.30%
  • 8
  • 2
Is it just me or are @bot limits super small?
post-image
[New Streamer] Market Prediction
live-cover
LIVE1,463
Load More

Join 40 M users in our growing community

⚡️ Join 40 M users in the crypto craze discussion

💬 Engage with your favorite top creators

👍 See what interests you

Trending Topics

BTC大跌

500.89k Views39.89k Discussing

$BTC briefly fell below $77,000 and remains under pressure around the $77K zone, with its 24-hour decline still above 4%. With risk appetite weakening and Fed uncertainty rising, where is the next key support after losing $80K?

IntelBeatsEarningsButStockPlunges

46.75k Views1.07k Discussing

StrategySTRCNears100ParValue

54.99k Views4.22k Discussing

View More