Square
Following
Hot
News
Notifications
Profile
Share your thoughts
placeholder
Article
Huge thanks to the market maker for the strong support. The volatility is pretty good, so we’ve got to score big. The followers who joined in also did pretty well this round. Bulla’s take-profit is adjusted to start at 0.02.
$BULLA ‌$ETH ‌
BULLA+10.92%
ETH-1.23%
  • 2
The pleasant weekend is about to end again. Just thinking about the market opening tomorrow takes away half the relaxation. Looking at this latest liquidation heatmap, the whales’ playbook is already laid out in plain sight before tomorrow’s open. Don’t charge in like an idiot!

$BTC Current price: 59750, stuck awkwardly right in the middle. Looking up, the green glow around 61000 is glaring—short positions are lined up there. But looking further down, in the 58500 to 59000 range, long positions are piled up as thick as a city wall. What does that tell us? The whales have plenty of room to st
BTC-0.65%
ETH-1.23%
SOL-0.74%
Trenches
IDOL
I
bade
b
IDOL
0x3b...ab07
Market Cap
$.
Change
.
24h Vol
$.
Holders
.
JAGENT
J
bade
b
JAGENT
0x8e...ae15
Market Cap
$.
Change
.
24h Vol
$.
Holders
.
PIEVERSE
P
bade
b
PIEVERSE
0x0e...25a9
Market Cap
$.
Change
.
24h Vol
$.
Holders
.
CLAUDIA
C
bade
b
CLAUDIA
2j5S...W2ZM
Market Cap
$.
Change
.
24h Vol
$.
Holders
.
mihao
m
bade
b
mihao
4Cxj...pump
Market Cap
$.
Change
.
24h Vol
$.
Holders
.
Dare I ask: who else? Those two trades alone brought in nearly 10k points. Tell me, are you convinced or not? Don’t bring up Lao Ji’s earlier losses on long positions—who hasn’t taken losses going long in a one-way market? Besides, we always reminded everyone to use stop-losses and never let losing positions ride. The short above 62,200 called on the morning of 11.20 was held to around 57,500, nearly 5,000 points. I also said to build mid- to long-term long positions in batches between 55,000 and 66,500. On the rebound, Lao Ji added to the long position and scaled in, bringing the average entr
$NAS100 ‌
NAS100 Market Analysis: The Calm Before the Breakout

Current Price: 25,584.18
The NAS100 has experienced a sharp sell-off, dropping from highs near 27,755 down to a low of 24,898. Since hitting that bottom, price action has compressed significantly, forming a textbook pattern that traders need to watch closely.

Chart Analysis & Context

1. The 4-Hour Chart (Macro View)

Looking at the 4-hour timeframe, the index is currently in a consolidation phase following a strong bearish impulse.

· The Pattern: We are seeing a Symmetrical Triangle (or a pennant) formation. The price is squee
NAS100-4.60%
  • 3
  • 2
🔹 BNB Surpasses 540 USDT with a Narrowed 4.43 Decrease in 24 Hours
live-cover
LIVE3,504
BTC-0.67%
ETH-1.26%
ZEC+1.16%
SOL-0.77%
USDC+0.01%
$UNI 4.719, up 7.4% over 24H. 1h looks relatively strong, while 4h is weak; divergence remains. It hasn't held above resistance at 4.789 yet, and volume is only around average. For now, I'm watching 4.789; I'll follow if it breaks out, and if it falls back to 4.414, I'll consider it no big deal. Don't mistake short-term volatility for a reversal; wait patiently for direction. Stay calm and don't chase rallies or sell into dips. Mainly staying on the sidelines; wait for confirmation before acting. Don't let a single day's gains go to your head. Keep watching. Not investment advice
#UNI #Uniswap
post-image
UNI+3.05%
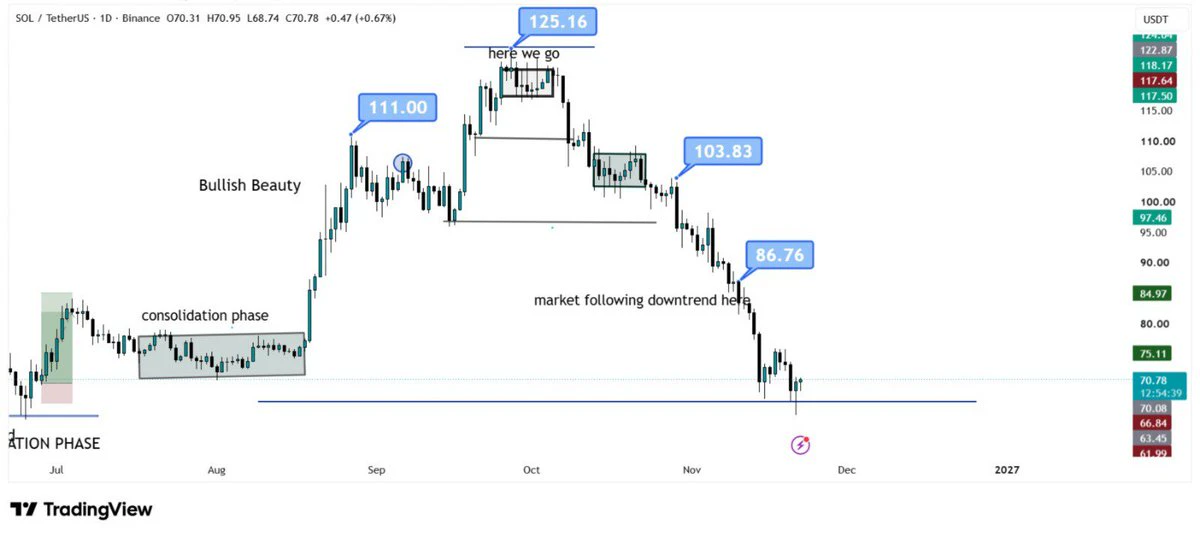
$SOL is still in a strong downtrend, but I’m watching the $70 support zone closely.
If buyers defend this level, we could see a relief bounce toward $86 next.
I want to see buying pressure return before expecting a bigger recovery.
post-image
SOL-0.77%
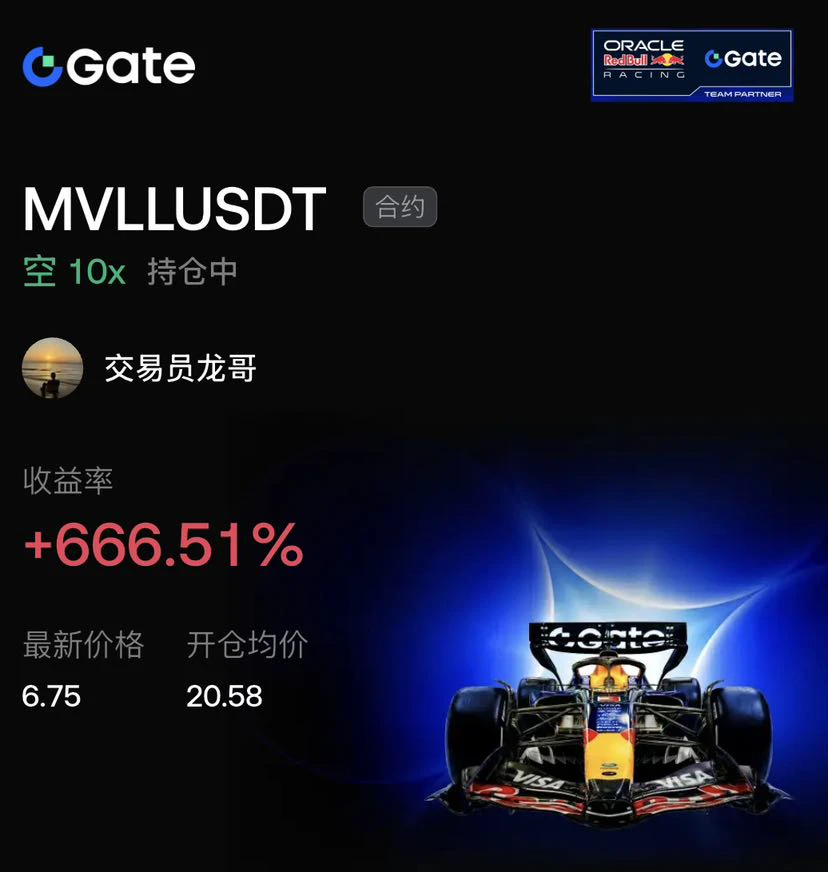
When everyone was buying the dip around 20.58$MVLL , I chose to reverse and go short.

The daily-chart double top was already crystal clear, with every rebound accompanied by declining volume and the moving averages fully aligned bearishly. In this environment, so-called “support levels” looked more like bull traps. Following the trend is far safer than trying to guess tops and bottoms.

Holding the position was no easy ride. From 20.58 to 6.75, there were several high-volume rebounds along the way, and watching unrealized profits pull back under 10x leverage was a real test of discipline. For
post-image
MVLL-1.56%
BTC-0.65%
ETH-1.23%
My first book, “The Author of Life: Safeguarding Our Cognitive Sovereignty in the AI Era,” has been officially registered with the National Library of Singapore and officially published. It is a philosophical primer for everyone living in the AI era, as well as a book to safeguard our cognitive path.
This is not only an important milestone for me personally, but also a significant step in the development of the Rainbow City community. It presents, for the first time in a systematic way, my reflections on the crisis of human agency, cognitive sovereignty, and autonomy over our lives in the AI e
Volume ratio: 1.37, with a 24-hour gain of just +0.56%, but $TRX 's one-hour and four-hour charts give opposite signals: the one-hour is leaning bullish, while the four-hour is leaning bearish. The easiest way to be misled by this divergence is to focus only on the side you prefer: watch the one-hour and a pullback looks like an opportunity; watch the four-hour and the rebound looks like mere recovery.
The current price of 0.3053 is caught between the two timeframes, and neither has won. My stance is to wait for confirmation: a move to 0.307 confirms the upside, while a drop below 0.303 means
post-image
TRX+0.42%
🟢 RED SATURDAY TURNED INTO GREEN SUNDAY!

As expected, the crypto market bounced back strongly, and the move played out according to my trading plan.

On 21 November, I opened long positions on the following assets:

* BTC: $57,000
* ETH: $1,562
* XRP: $0.87
* SOL: $66
* ZEC: $689
* NEAR: $2.64

Trade Results:

✅ SOL: Hit target at $71
✅ NEAR: Hit target at $2.95
✅ BTC: Closed at $61,222 (before target)
✅ ETH: Closed at $1,720 (before target)
✅ XRP: Closed around $0.94
✅ ZEC: Closed at $804

All long positions have now been closed.

The market recovery played out according to the planned TA,
BTC-0.67%
ETH-1.26%
XRP-1.15%
SOL-0.77%
ZEC+1.16%
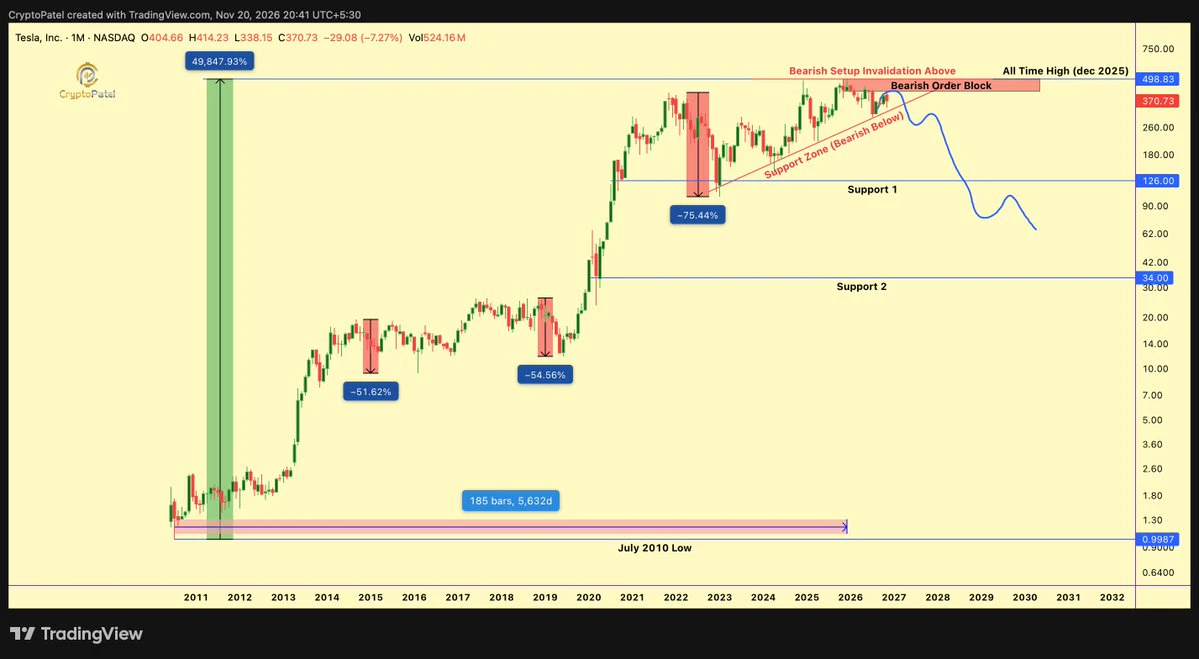
$TSLA (Tesla): Can it fall from $374 to $100–$150?
Tesla is building some very interesting businesses, but its current stock valuation is a different story.
I went through its latest financials, cash flow, business growth and 5-year valuation.
Here are my main findings.
1️⃣ At around $374, Tesla has a market cap of approximately $1.48T against $103.6B in trailing revenue.
That's roughly 14x annual sales and more than 400x trailing earnings.
A lot of future growth is already priced in.
2️⃣ Tesla's core business is still automotive, but energy storage is becoming increasingly important.
In the f
post-image
TSLA-7.56%
The word “free” alone isn’t enough to make me click Confirm anymore😂
I heard TopNod is teaming up with leading projects like Ondo, Pharos, Tether, Hyperliquid, and Stellar for a special anniversary carnival to celebrate its first anniversary.
When I received this “You're Invited to TopNod Anniversary Park” invitation today, my first thought was: just how many perks are hidden inside?🤔
TopNod’s first-anniversary amusement park has free tasks, a contract trading competition, and a spin-the-wheel game. That definitely makes it easier to learn more than being asked to deposit right away. But I s
ONDO-0.29%
PROS-2.07%
USDT+0.00%
HYPE+0.24%
XLM-0.64%
$AKE After the funding rate turned negative and then positive again, are longs starting to pay?
In-depth analysis: Around the time AKE peaked at 0.0096765, longs briefly pushed the funding rate higher, signaling crowded long sentiment. When the rate fell from its high and turned negative, it meant longs had started paying shorts and funding sentiment had reversed. I opened a short during the settlement period when the rate turned negative and used 25x leverage to capture the entire decline after the shift in funding. $EVAA $ETH
AKE+6.39%
EVAA-0.42%
ETH-1.23%
  • 1
Lao Zhou says he understands this move. I believe half of it; the other half depends on how the timeline plays out.
$BULLA Let’s go through what happened over these three days in order. From the afternoon before yesterday to the early hours of yesterday, the price gradually climbed from around 0.0135. Trading wasn’t particularly aggressive—it looked like someone was cautiously testing the waters and buying in. There was an acceleration during the day yesterday, but what really changed the structure was last night’s move: the 24-hour high touched 0.0182, and trading volume reached 27.4M. That’s
  • 2
  • 1
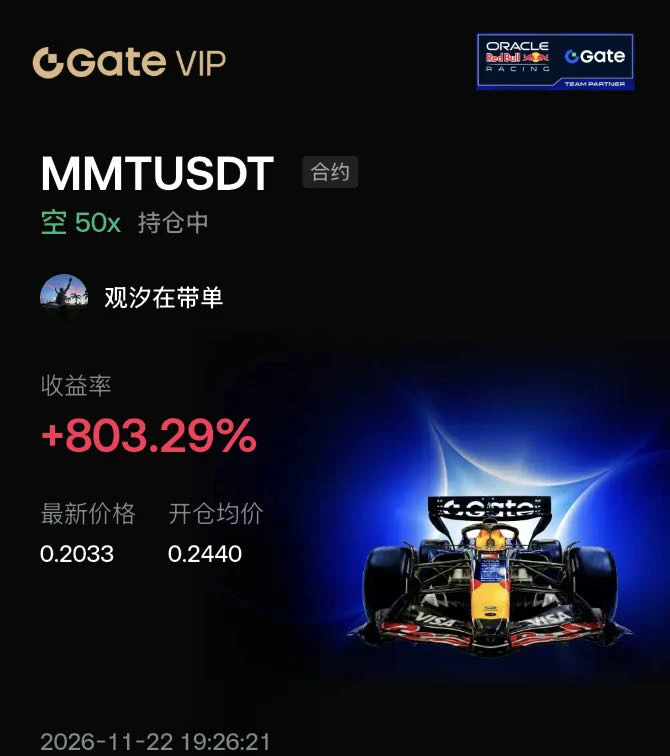
🚀 MMTUSDT Short Trade Pays Off! 50x Leverage Racks Up 800% Returns!
$BTC
Friends, this MMTUSDT short trade was as smooth as a Red Bull race car! Just look at the chart: we decisively opened a short at 0.2440, and the price has now plunged to 0.2033, bringing returns to +803.29%!
$EVAA
After its explosive rally, MMT became severely overbought, and a bearish moving average crossover was confirmed on the 4-hour chart, signaling a clear downtrend. We precisely entered short at the high of 0.2440, taking advantage of the weak rebound and confirmed crossover.
$AKE
The first support level to watc
post-image
BTC-0.65%
EVAA-0.42%
AKE+6.39%
  • 1
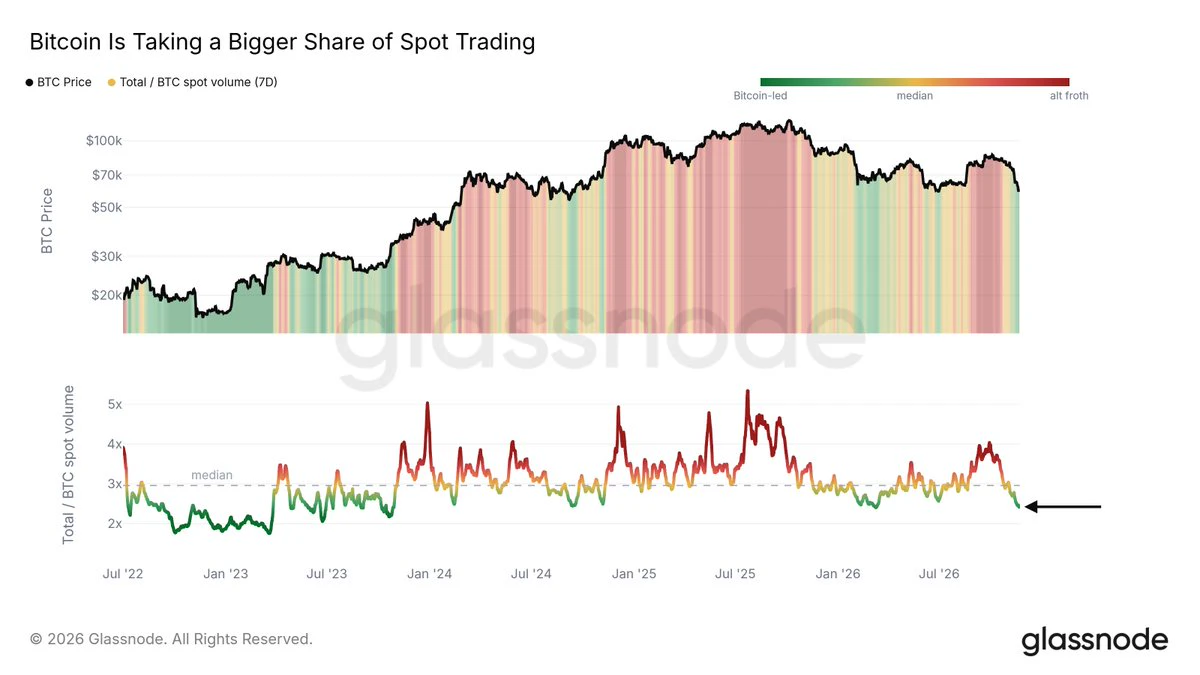
The altcoin froth is gone.
In late September, total spot volume was 4x Bitcoin's. Today that ratio is below the summer lows.
In risk-off markets, capital tends to consolidate into bitcoin:native.
In risk-on markets, this capital moves back into riskier assets.
post-image
BTC-0.67%
$DGAI ‌
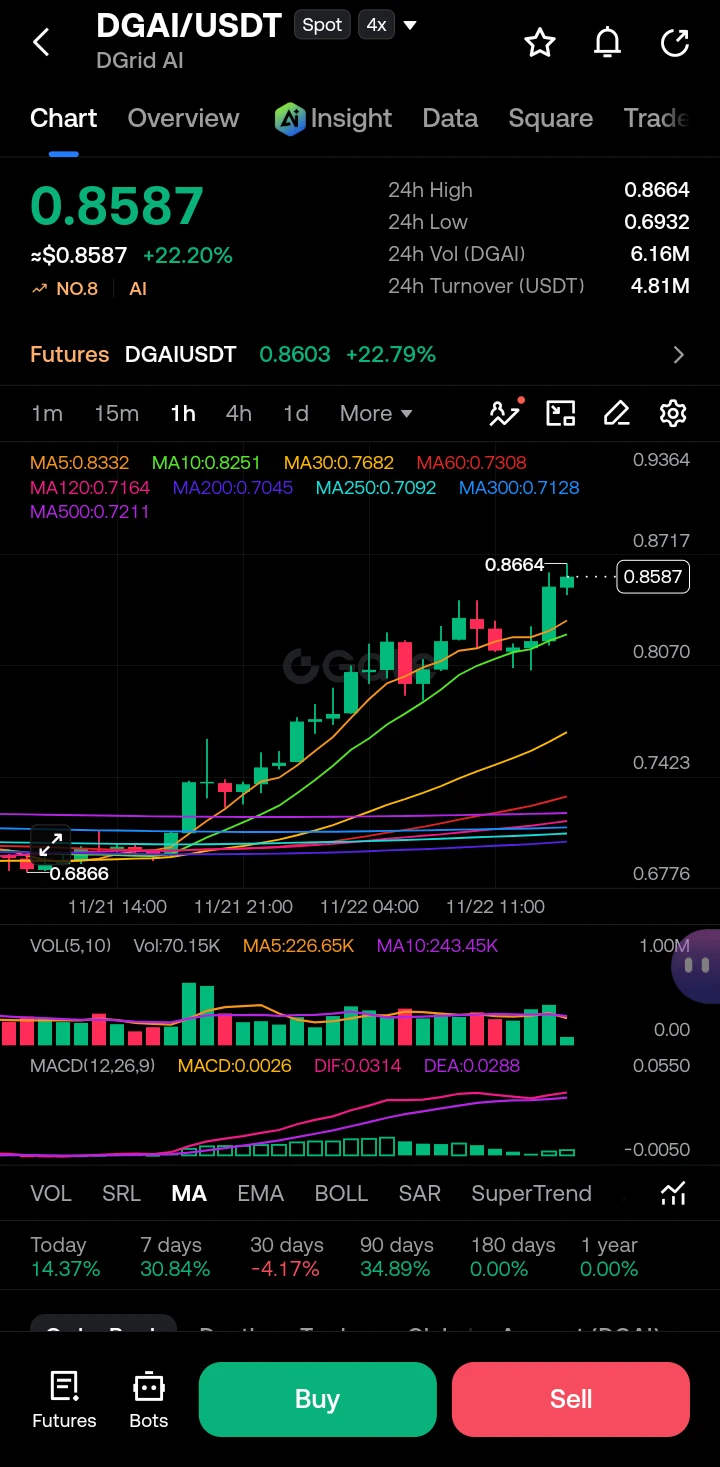
The DGAII/USDT chart is displaying a textbook, aggressive bullish trend, having rallied over 22% in the last 24 hours to reach a current price of 0.8587. Price action is forming a series of higher highs and higher lows, riding a strong uptrend. The moving averages (MA) are in a perfect bullish fan, with the short-term MA5 (0.8332) and MA10 (0.8251) acting as dynamic support below the current price. We are currently testing the 24-hour high resistance zone at 0.8664. Volume has been noticeably elevated during this upward push (Vol MA5 is 226.65K), confirming the buying pressure behind
post-image
DGAI+0.67%
  • 4
  • 1
📊 Crypto Daily | Evening of Nov 22: Above 61,000! $BTC short-squeezes from 55,126, liquidating 85,000 people, with shorts accounting for 85%—has it cleared the 60,000 hurdle?

Guys, the market move from earlier today has finally continued. BTC has rebounded all the way from 55,126, breaking above **61,000** at 17:56 (up 1.58% on the day) and now trading **around 61,100**, up about 2% over 24 hours. The main driver was short covering: $249 million in BTC liquidations over 24 hours, with shorts accounting for 85%; around $380 million liquidated market-wide, affecting more than 85,000 people; at
post-image
BTC-0.65%
ETH-1.26%
Load More

Join 40 M users in our growing community

⚡️ Join 40 M users in the crypto craze discussion

💬 Engage with your favorite top creators

👍 See what interests you

Trending Topics

BTCReboundFaces60KTest

2.1M Views30.1K Discussing

BTC rebounded from around $55,300 on November 21, briefly reclaiming $60,000 before pulling back to around $59,300. The $60K level is back in focus as traders assess whether the recovery can last. Is this rebound a sign of stabilization or a short-lived recovery? Would reclaiming and holding $60K be enough, or do you need confirmation from trading volume and fund flows?

PCEAndGDPDataNextWeek

259.2K Views2.6K Discussing

GateDirectIPOPhase3ANTAllocates92100Shares

831.8K Views5K Discussing

View More