Square
Following
Hot
News
Notifications
Profile
Share your thoughts
placeholder
Article
$ZEC Currently trading at 732.08, down 14.15% over 24H. The 4h RSI is at 24, indicating oversold conditions. There’s demand for a bounce, but the trend remains weak. Key support is at 679.48; if it breaks, watch for the next leg down. Only consider a bounce if support holds. Volume is just 1.15x the average, so don’t trust a one-off move above the level. I’m watching only 679.48 for now; I’ll reduce my position if it breaks down. Without volume confirmation in the short term, a bounce could easily fizzle out. Wait patiently for confirmation before deciding, and don’t rush to buy the dip. This
post-image
ZEC+1.16%
WHALE ADD 10.2 MILLIONIN LONG SLIVER POSITION
live-cover
LIVE2,184
BTC-0.67%
Trenches
FIONA
F
bade
b
FIONA
B34n...pump
Market Cap
$.
Change
.
24h Vol
$.
Holders
.
PIEVERSE
P
bade
b
PIEVERSE
0x0e...25a9
Market Cap
$.
Change
.
24h Vol
$.
Holders
.
mihao
m
bade
b
mihao
4Cxj...pump
Market Cap
$.
Change
.
24h Vol
$.
Holders
.
CLAUDIA
C
bade
b
CLAUDIA
2j5S...W2ZM
Market Cap
$.
Change
.
24h Vol
$.
Holders
.
IDOL
I
bade
b
IDOL
0x3b...ab07
Market Cap
$.
Change
.
24h Vol
$.
Holders
.
🏆 2026 Creator of the Year | Top 20 Live Rankings Are Out!

🔥 The race for annual glory is heating up! Rankings keep changing—who will come out on top?

🎁 Every 100 Support Points submitted unlocks 1 lucky draw chance!
🏅 Top 100 supporters also win rewards!
🚀 Support your favorite creator and help them climb the rankings!

⏰ Support Deadline: Dec 1
👉 https://www.gate.com/competition/Annual-Gala
📢 Rankings as of Nov 20. Results are not final.
‍#Gate #GateAnnualGala
post-image
  • 4
  • 1
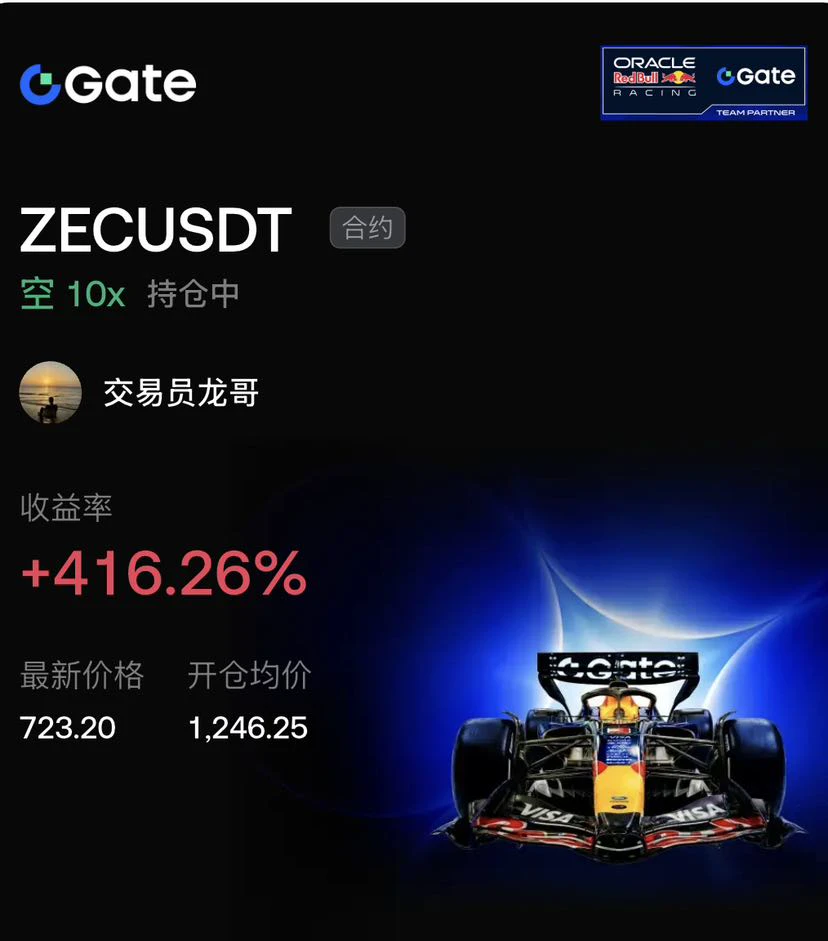
When everyone was calling to buy the dip$ZEC , I increased leverage on my short position to 10x.

Opened a short at 1246.25; the price fell to 723.20, for an unrealized gain of 416.26%. The 1-hour moving averages are in a bearish alignment; going against consensus is the source of excess returns. The logic is simple: high-level sideways trading with stalled gains, declining volume, and exhausted bulls. Enter after a descending channel forms. The price fell on heavy volume, completing the main downtrend wave. With 10x leverage, any rebound is a trap.

Profits are substantial, but a doji at the
post-image
ZEC+1.29%
BTC-0.65%
SOL-0.74%
Nvidia$NVDA flash-crashes 14%! Did blowout earnings become a death knell?

Once all the good news is priced in, it becomes bad news. Even the top AI player fears scrutiny.

The one-hour chart has broken below all key levels, with severe short-term oversold conditions. The outflows are even more painful: 229 million flowed out in one day and 785 million in seven days. Selling just won't stop.

Despite earnings beating expectations, rumors of an SEC investigation and news of Jensen Huang's resignation sent the stock crashing—a classic emotional sell-off.

Mr. Zhang's view: There could be a reco
NVDA-0.35%
  • 2
  • 1
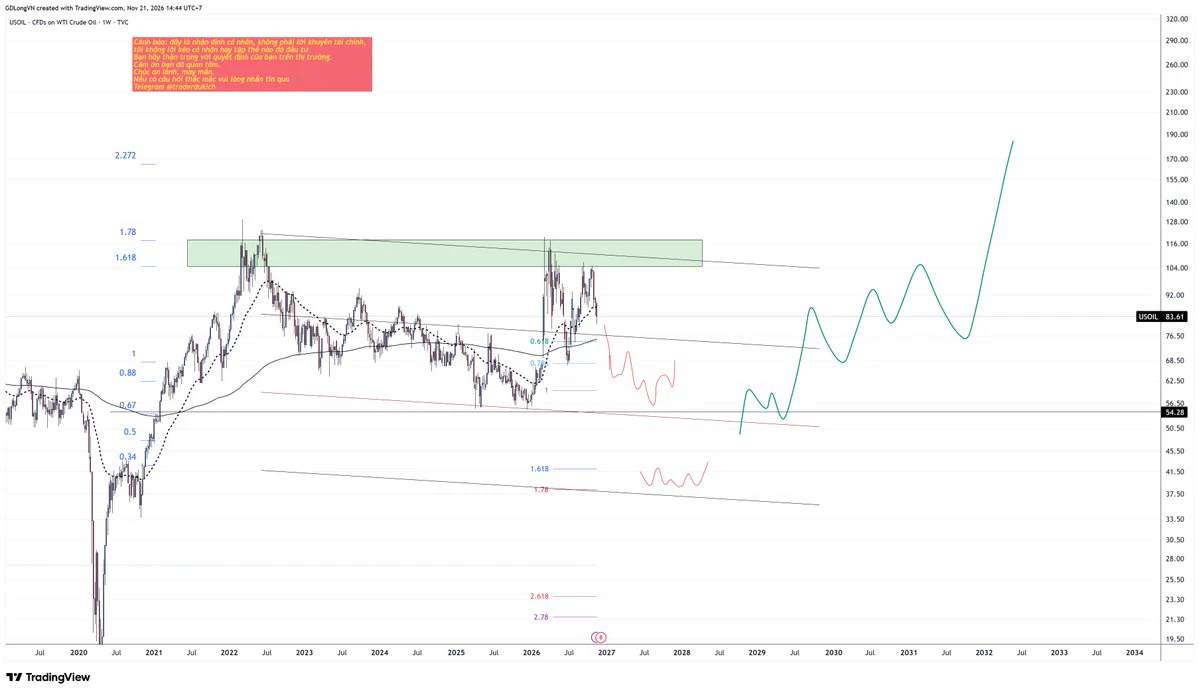
Symbol #USOIL
Current time: 14:42 on 21.11.2026 Vietnam time
Analysis timeframe: W
Analysis data: #TVC
Chart status: displayed
May you be at peace.
May you be happy.
May you have enough to eat.
Sending hearts, bang… bang
Warning: this is my personal opinion, not financial advice. I am not encouraging any individual or group to invest.
I am not responsible for any of your trading activities in the market. So please be careful with your decisions in the market.
You can ask me questions by clicking the link I pinned on my profile.
#giapduclong
post-image
With three leaders present at the same time, how would you address them?
post-image
#BTCBreaksBelow60K #ShareWeekly #WCTCS9
Bitcoin Breaks Below $60K: Temporary Correction or a New Bearish Trend?

Bitcoin has lost the $60,000 level, one of the most watched psychological supports of this cycle. The latest snapshot showed BTC around $58,370, down about 5.7% over 24 hours. Traders are now reporting fills near $56,000, which is roughly 6.7% below $60,000 and about 4% below the snapshot price. Whichever print you use, the message is the same: the market has moved from defending $60,000 to testing what sits underneath it.

The 24-hour range shows how fast this happened. The hig
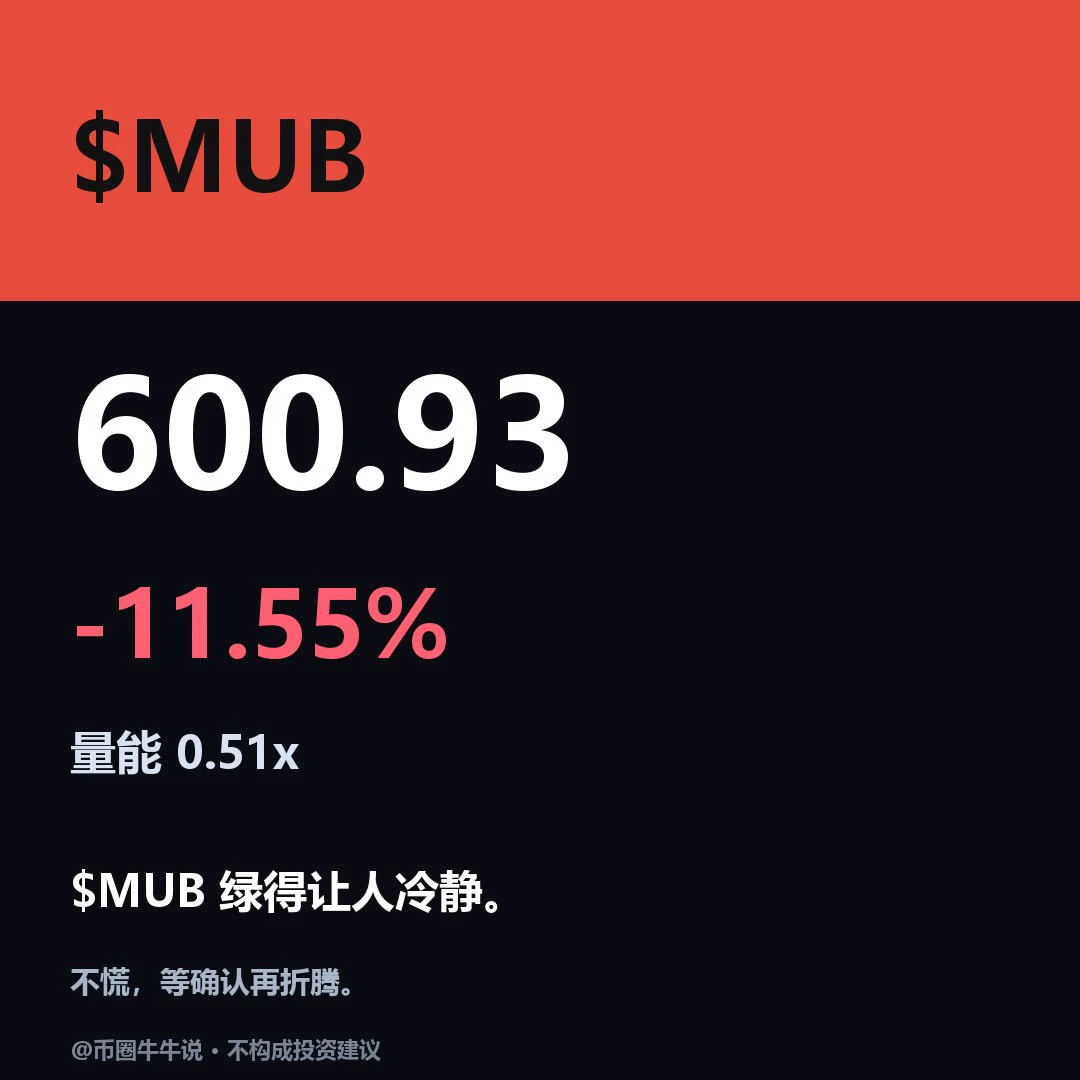
$MUB Currently trading at 600.93, down 11.55% over 24H. The 1h RSI is 42, so it’s not oversold yet. Volume is only 0.5x the average, making a rebound unlikely. Key support is 584.96; if it breaks, watch for the next downside level. Only if it holds can we consider a rebound to 675.06. Don’t rush to buy the dip—wait for volume confirmation before deciding. For now, keep an eye on 584.96 and reduce your position if it breaks. Without a surge in volume, any short-term rebound is likely to fizzle. Not investment advice
#MUB
post-image
Put that way, it really does seem like there’s no need to have kids. Just look at Japan—quite a few people in their 70s are still working.
post-image
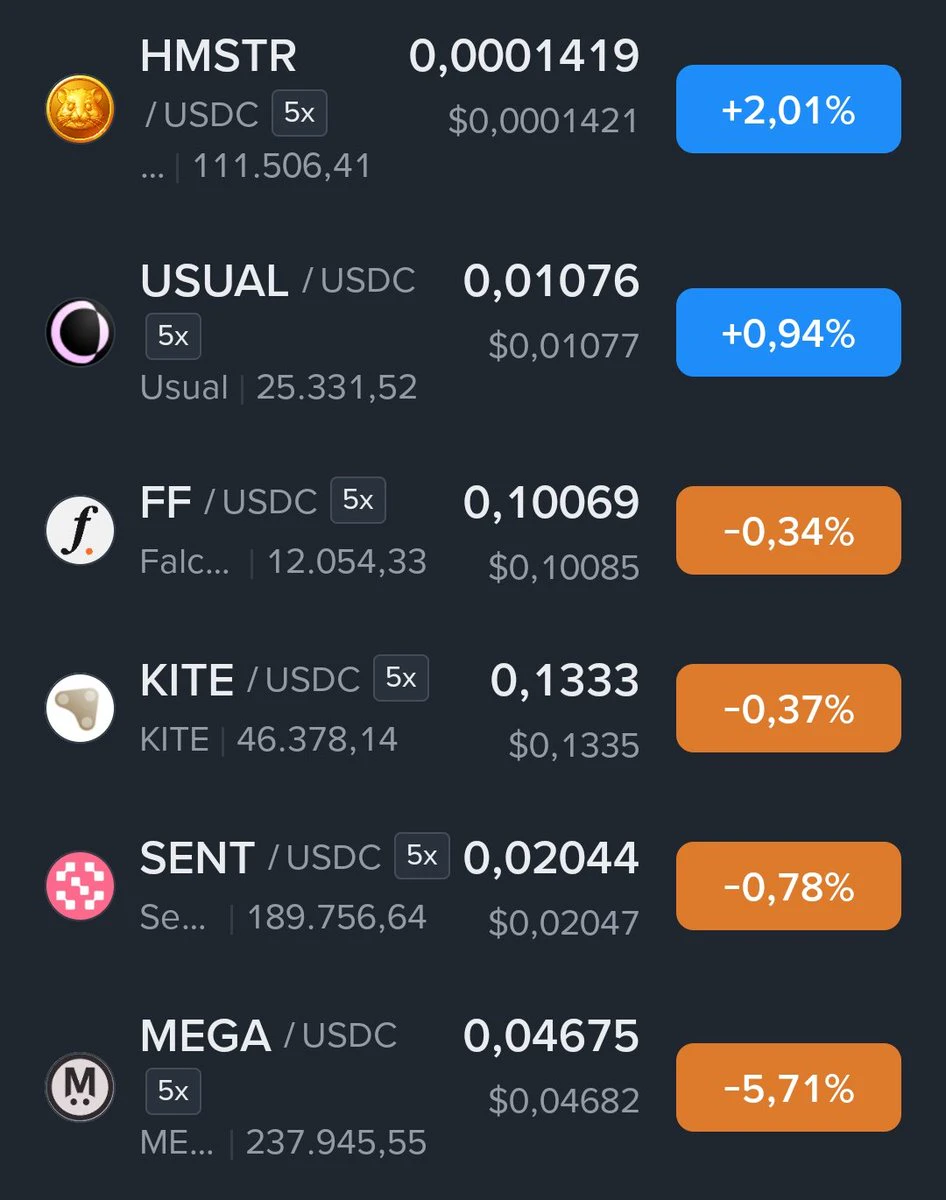
#altseason vibes?
No F way
$hmstr $usual $ff $kite
#sent
#코르티스
post-image
HMSTR-1.98%
USUAL+4.14%
FF-0.26%
KITE-0.15%
Took the dog to the vet, and it really hit me that I should get pet insurance...
Even a quick checkup costs several hundred 😂
Whatever hardship you endure, you’ll definitely make it up from others in one way or another.
post-image
BTC Falls Below 58,000 USDT, Down 7.75 percentage in 24 Hours
live-cover
LIVE1,531
BTC-0.67%
ETH-1.26%
SOL-0.77%
All of DCTY’s gains came in the 36 hours between the November 18 livestream and the November 19 launch—that’s a textbook case of “buy the rumor.” The game officially launched on November 19, and expectations were fully priced in. After that, the market had just one question: could the Easter egg in the game turn into on-chain cash flow?

The answer is no. Rockstar didn’t integrate Web3; the token is on-chain, the meme is in the game, and there’s no bridge between them. So every hour after launch was a sell-off on the premise that “there’s no next leg.”

The comparisons are right nearby: DACITY
DCTY
DCTYDaycity Coin
Pump.Fun
MC:$1.88KHolders:1
26.08%
BTC-0.65%
ETH-1.23%
SNDK-0.18%
  • 1
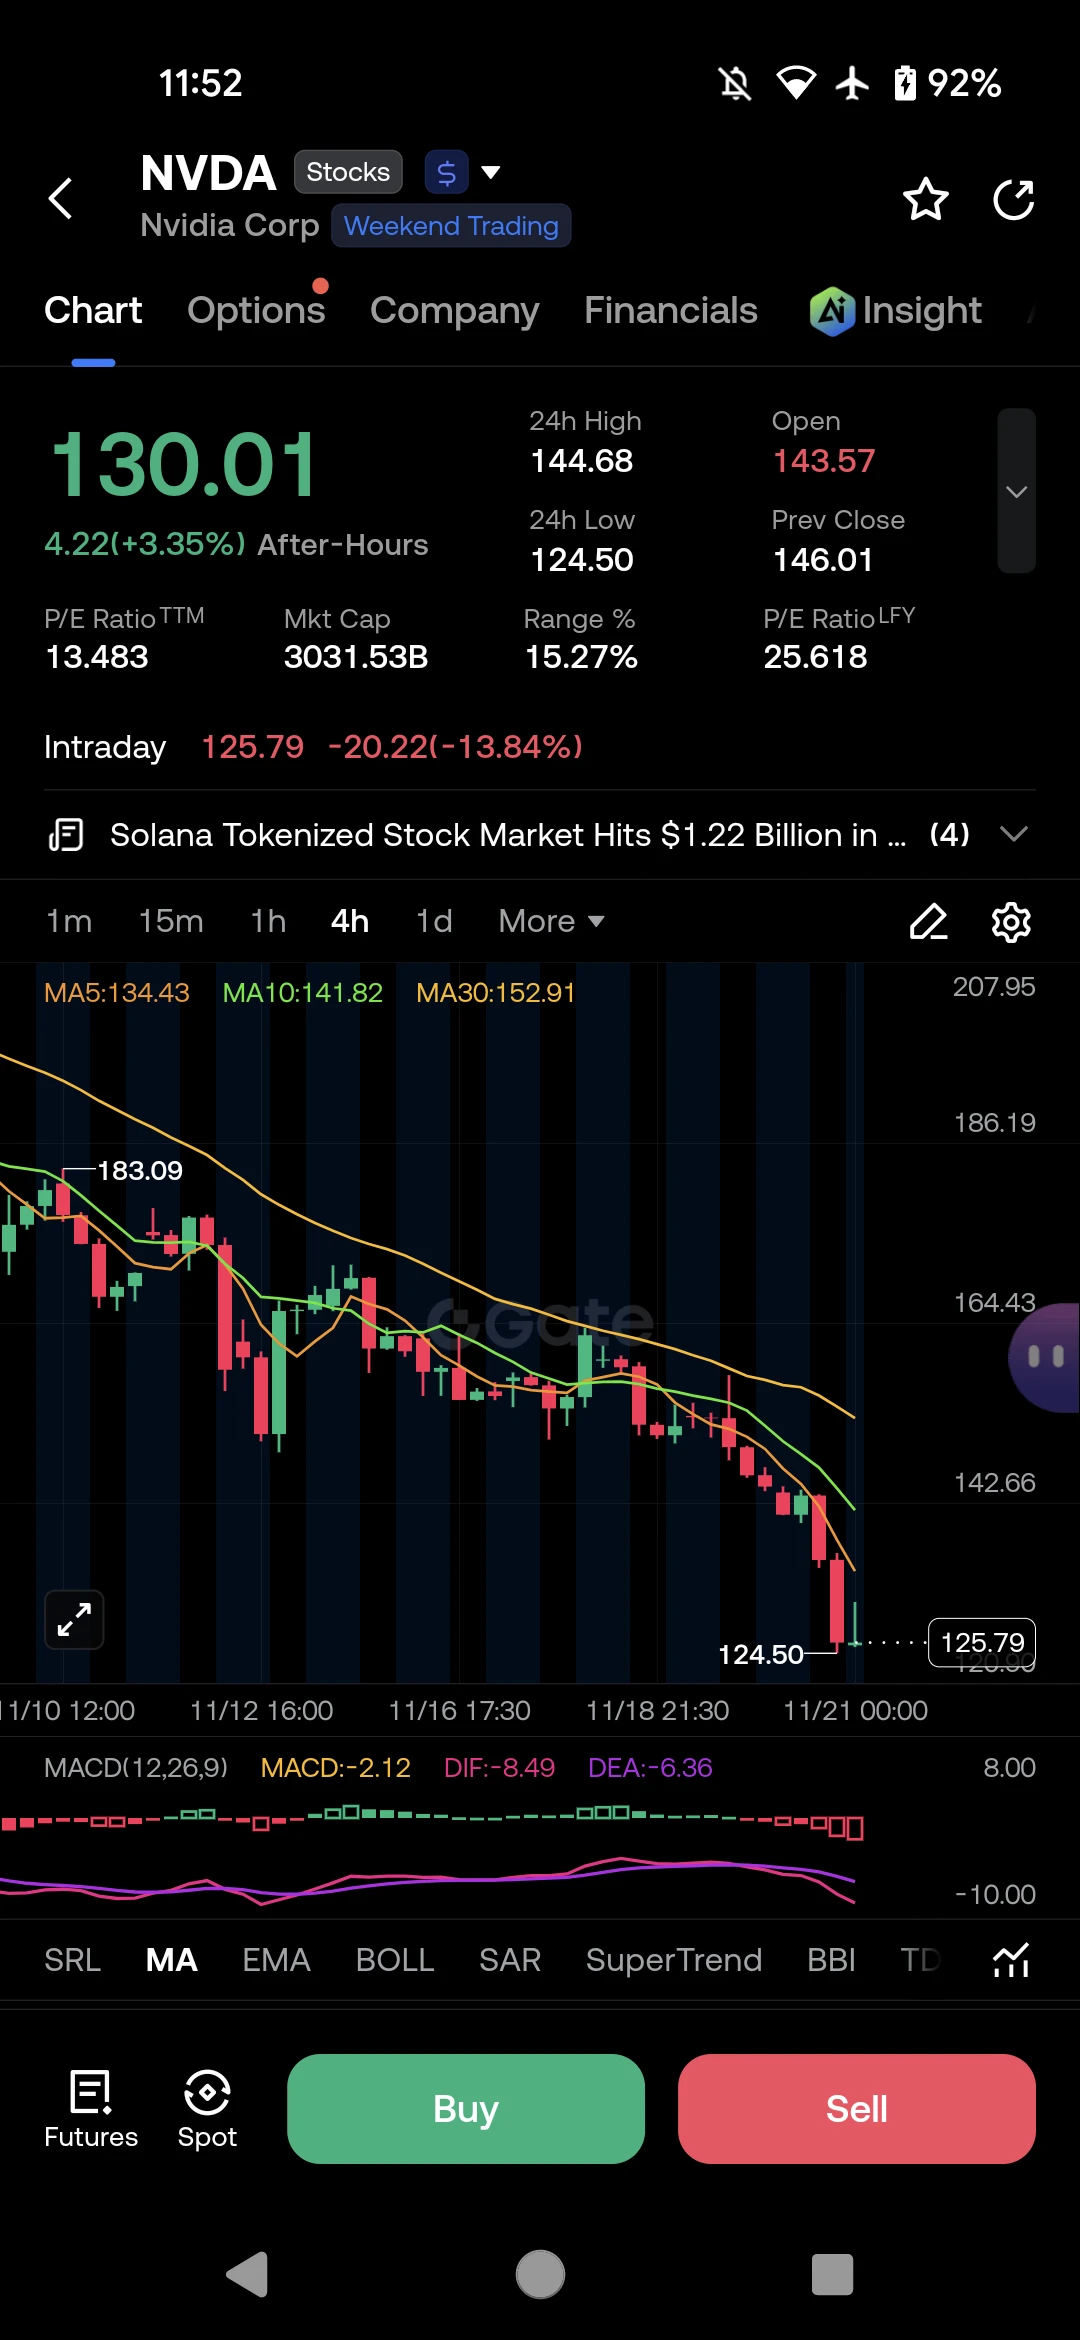
$NVDA ‌ Bleeds: Is the AI King Cracking?"

Nvidia is taking a massive hit today! The stock plunged intraday by nearly 14%, dropping from $146 to a low of $124.50. This is a bloodbath for the AI leader.

Let us look at the technical damage on the chart:

· The Trend: A clear and violent breakdown.
· Moving Averages: Price is completely destroyed below the MA5 (134.43), MA10 (141.82), and MA30 (152.91).
· MACD: Deep in the red at -2.12, showing strong bearish momentum.

My Strategy:
I am NOT trying to catch this falling knife just yet. $124.50 is the immediate support. The after-hours are showi
post-image
NVDA-13.84%
Trading is still too difficult
There’s a huge gap between seeing it right and getting it right
post-image
This long position is just like we said in the livestream! There was 800 points of upside; I’ve taken half the profit off the table, and I’ll hold the rest with a breakeven stop until Monday!! If V gets above 60k, the gains will be huge; even if it hits breakeven, that’s fine!

The livestream also gave everyone some short-term trades: go long on BTC around 55,500 and ETH around 1,550! #BTC跌破6万美元关口 #英伟达单日重挫近14%
BTC-0.67%
NVDA-13.84%
Weekly Strategy Review

The rhythm throughout the week stayed in sync with the market, and every resistance zone identified for each trade was tested precisely by price action.

BTC: We laid out a short strategy from the highs. Each rebound stalled at the anticipated levels; after meeting resistance, price continued lower, repeatedly breaking through our preset targets. The expected bullish rebound never gained momentum. Once the weak structure was confirmed, shorting rallies in line with the trend provided ample room.

ETH followed the bearish trend throughout as well. Each rebound touched th
BTC-0.65%
ETH-1.23%
Crypto 🔻
US S&P 500 🔻
US ETFs 🔻
China Shenzhen Component Index 🔻
South Korea KOSPI 200 🔻
Please, give me a reason to believe. 🙏
SPX500+0.19%
  • 1
Load More

Join 40 M users in our growing community

⚡️ Join 40 M users in the crypto craze discussion

💬 Engage with your favorite top creators

👍 See what interests you

Trending Topics

BTCBreaksBelow60K

2.1M Views29.3K Discussing

BTC fell below $60,000 on November 20 for the first time since July, alongside a tech stock selloff and broader pressure on risk assets. Will $60K become resistance, or can BTC quickly reclaim it? What price or volume signals would convince you that selling pressure is easing?

GateDirectIPOPhase3ANTAllocates92100Shares

743.3K Views4.8K Discussing

NvidiaDropsNearly14Percent

312K Views7.5K Discussing

View More