Square
Following
Hot
News
Notifications
Profile
Share your thoughts
placeholder
Article
$ETH #比特币跌破7万美元 2026.11.15
Daily entry point: 1840
Resistance above: 1853–1863-1874-1884-1897
1900-1910-1920-1928-1936-1956
Support below: 1830-1824-1820-1810-1800
At all support and resistance levels, stop out on the first break; if the level holds, take a rebound, and once price stabilizes, follow the trend. If price stabilizes above 1853-1881, or breaks below 1824-1800, follow the move short; otherwise, buy low. Personal opinion for reference only.
ETH-1.23%
When trapped in a position, the worst thing you can do is stubbornly hold on! You won't get unstuck by toughing it out; you'll only sink deeper.
Many people feel increasingly anxious the longer they hold a losing position: they can't bear to cut their losses and exit, yet keep waiting for a rebound that will get them back to break-even.
The market never moves according to anyone's expectations, and you can't get unstuck just by waiting it out. First get a clear read on the market's rhythm, find the right direction and approach, and plan ahead—that's how you can gradually turn a passive situati
post-image
BTC-0.65%
ETH-1.23%
Trenches
mihao
m
bade
b
mihao
4Cxj...pump
Market Cap
$.
Change
.
24h Vol
$.
Holders
.
IDOL
I
bade
b
IDOL
0x3b...ab07
Market Cap
$.
Change
.
24h Vol
$.
Holders
.
Snoopy
S
bade
b
Snoopy
7mEh...47Cn
Market Cap
$.
Change
.
24h Vol
$.
Holders
.
NIO
N
bade
b
NIO
7SL2...pump
Market Cap
$.
Change
.
24h Vol
$.
Holders
.
FOOD
F
bade
b
FOOD
FTu5...pump
Market Cap
$.
Change
.
24h Vol
$.
Holders
.
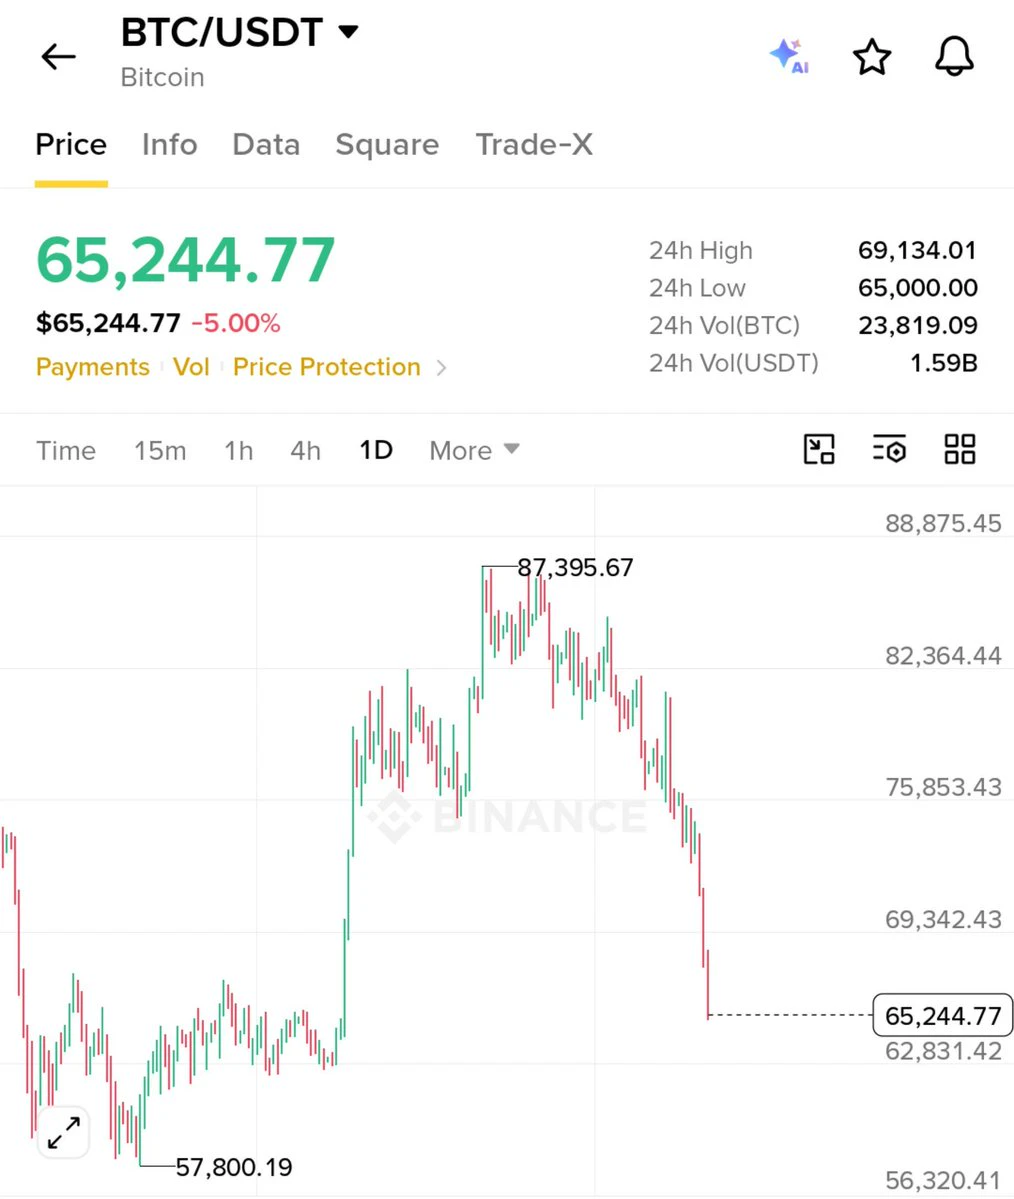
- Bitcoin is facing strong selling pressure.
- $BTC has dropped nearly 5% and is trading around $65,244.
- The $65K level is important support.
- Losing this level could bring more downside.
- Bulls need a strong recovery to regain control.
post-image
BTC-0.67%
Join the Discussion in my live stream now...
post-image
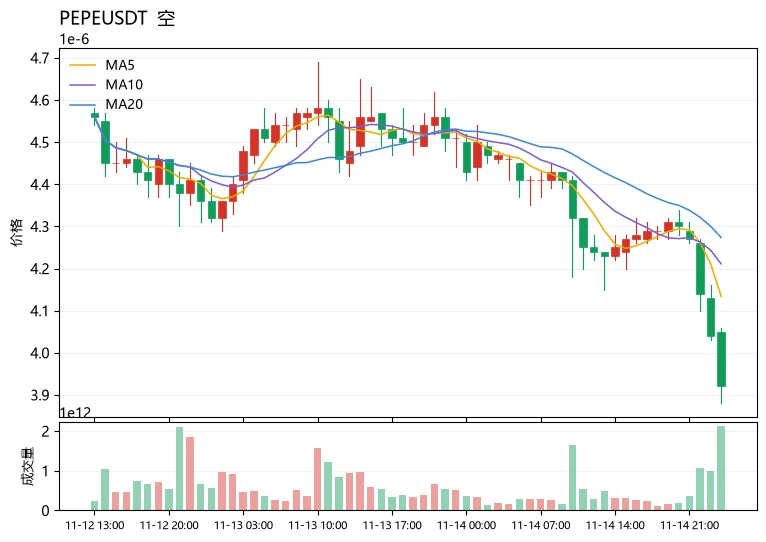
$PEPE Current price 3.92e-06, key levels: 4.03e-06 above (Bollinger lower band), 3.80e-06 below (extended support at the previous low). The current price has broken below the Bollinger lower band at 4.02641e-06; MA5 at 4.134e-06 is below MA20 at 4.2735e-06, with moving averages in bearish alignment. RSI is only 15.9, and the MACD histogram at -2.782e-08 remains bearish. The 30-candle range is about 18.88%, volatility is elevated, and the Fear and Greed Index at 13 is in extreme fear territory—oversold does not mean a bottom is in. Buying the dip now would mean catching a falling knife against
post-image
PEPE+0.97%
PUMP-1.06%
UNI+3.05%
BTC falls below 68,000 USDT, down 4.95 over the past 24 hours
live-cover
LIVE2,412
$XAU Shows a Potential Bullish Recovery From Support
Gold ($XAU) is attempting to recover after bouncing from a key support area. Buyers are showing renewed interest, and the next move will depend on whether bullish momentum can sustain itself.

Key figures

- Take Profit: $3,923.481
- Stop Loss: $3,856.893

A continued hold above support could strengthen the bullish outlook, while a break below the support region may weaken the recovery and bring further downside into focus.

Price confirmation remains important before expecting a stronger upward move.

#GateIPOAccessAnthropic
XAU+0.38%
  • 3
#晒出我的持仓收益 $BTC $ETH
What’s going on now? Hurry up and drop for me ‌ ‌
post-image
BTC-0.65%
ETH-1.23%
$AR is now heavily shorting, planning to sell at $3.386 later. Entry price: $2.675, short $AR 👇
post-image
AR-1.14%
$HOME This trade went from “free money” to “cutting losses” in just three days.
The day before yesterday, I watched it fall from 0.0052 to 0.0046. I thought it had dropped nearly 10%, so it had to bounce, and I entered with a 30% position at 0.0046. But after I bought, it just went sideways like a dead fish. Yesterday afternoon, a single bearish candle sent it straight down to 0.0043. I watched the order book, hoping for a rebound before exiting, but it never came. 24-hour trading volume was 5.7M, and volume kept shrinking, leaving fewer and fewer buyers.
The lesson is simple: in a downtrend,
HOME-0.31%
  • 1
  • 1
The first time I read *Poor Charlie’s Almanack* was in Chengdu in 2021.
Back then, Bitcoin was in a bull market. In the blink of an eye, it’s 2026, and we’re now in a bear market.
Five years have flown by. I’ve not only lived through a full bull-bear cycle, but grown a lot as well.
How many five-year stretches do we get in life? So make every day count.
What I’ve come to realize is: Every day that goes by without dancing is a waste of life.
Looking forward to the next five years. bitcoin:native
post-image
BTC-0.67%
So, does Jiangsu really have the most dysfunctional education system in all of China?
post-image
Sometimes I think about how much money you can really save by taking a single sentence to heart.

I've been saying for two weeks straight that I don't recommend buying the dip.

During this time, I've watched the market fall again and again, and seen plenty of people hold losing positions and get liquidated. Several people who've recently talked to me about the market had just been liquidated.

Often, it's not that there were no warnings—it's just hard to see clearly when you're in the thick of it.

A small drop feels like an opportunity; another drop feels like a golden buying opportunity. Yo
BTC-0.65%
ETH-1.23%
Let me start with the key point: The data was bullish, but Bitcoin didn’t rise—instead, it fell below 70,000~
The U.S. October PPI was up 6.5% year over year, versus 6.6% expected and 6.3% previously; it rose 0.3% month over month, versus 0.4% expected.
Both figures came in below expectations, and traders immediately lowered their expectations for Fed tightening. By textbook logic, this should be good news for risk assets, but $BTC wasn’t buying it…
After the data came out, Bitcoin plunged to a low of 68,943, with 1.088 billion in long positions liquidated.
Why did it fall despite the bullish
post-image
BTC-0.67%
ETH-1.26%
  • 1
Total cryptocurrency market capitalization exceeds $2.32 trillion, with Bitcoin dominance at 59.7
live-cover
LIVE1,955
August’s market move didn’t materialize until November, while my positions had long since dwindled to zero. My favorite crypto market taught me a crystal-clear lesson with two slaps, one from each side. Looking back over these five years, I put more than 4,000 U into it all told—which is nothing compared with the heavy losses some guys have taken. But I did reach a peak, so I just can’t shake that lingering sense of regret. Whether on the other exchange or OK, I briefly made it onto the trading leaderboard. Back then, I was genuinely proud of it, thinking I could at least prove to the market t
post-image
BTC-0.65%
#BitcoinDropsBelow$70K
The break of the 70,000 dollar level was not read as a price move alone, and the market priced this break as a sign of a period in which fear regained power.

On 13 November, Bitcoin fell below the 70,000 dollar level, this move was seen for the first time since 19 August, it fell to the 67,628 dollar level with a fall of up to 5.4 percent in the day, and on 14 November the fall went on to the 66,456 dollar level.

The weekly picture also shows the size of the pressure, because Bitcoin shows a loss of up to 11 percent in the week, the fear and greed gauge fell to the 20
post-image
BTC-0.67%
GT-2.41%
ETH-1.26%
SOL-0.77%
XRP-1.15%
  • 10
  • 1
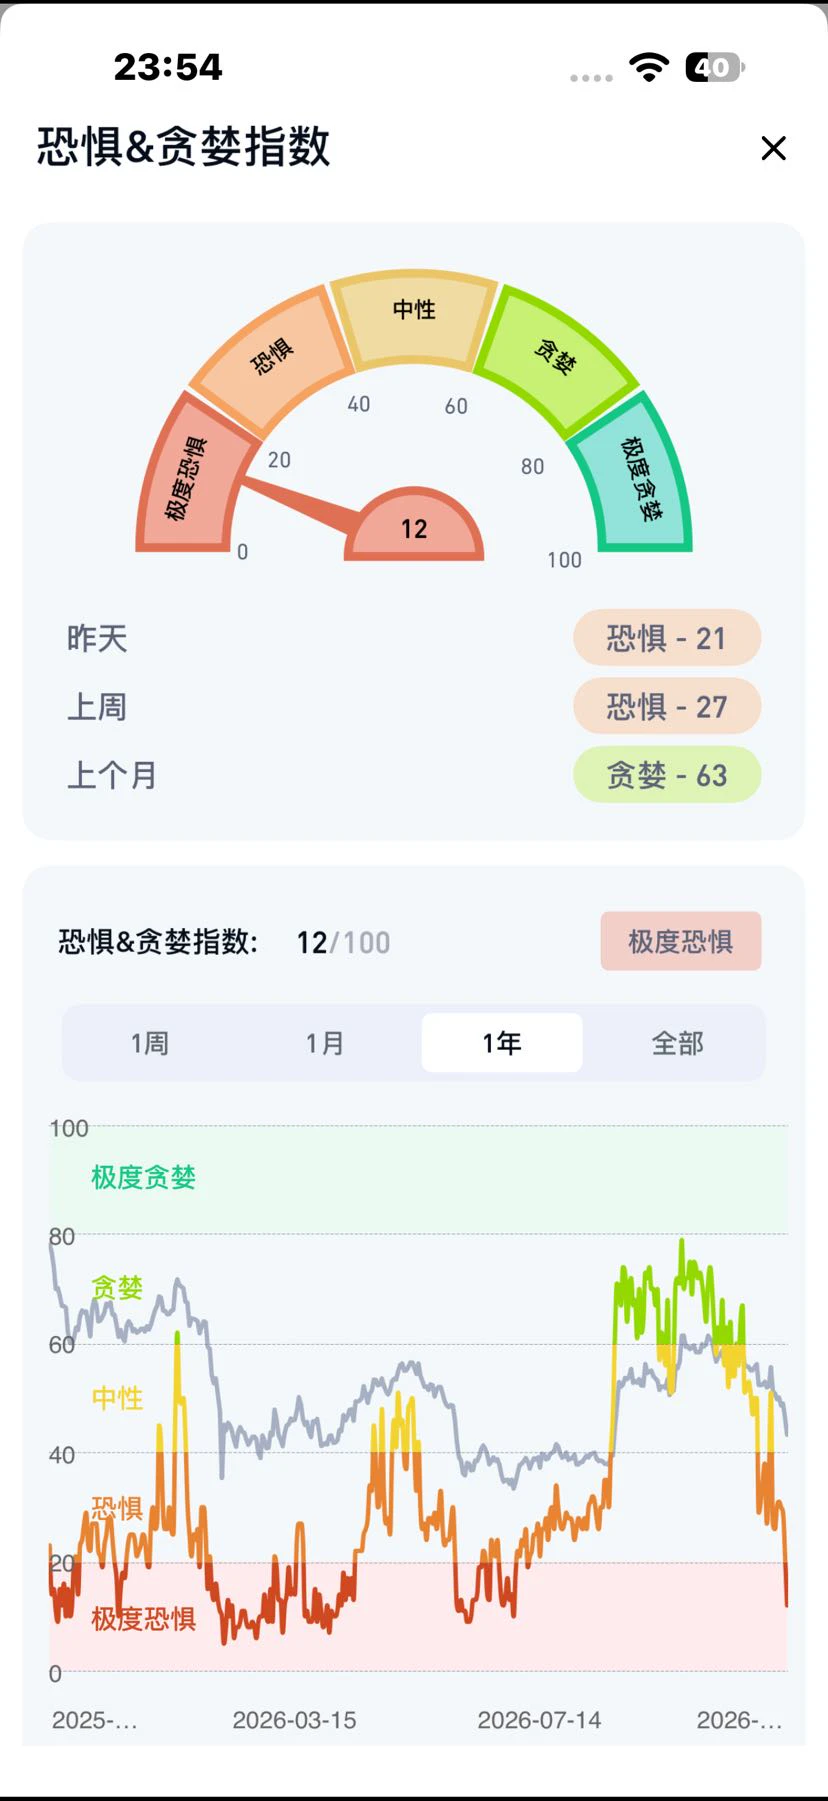
The Fear Index fell to 12, already near its levels in February, April, and July 2026. Prices have deviated from the mean under the influence of fear, but that doesn’t mean an immediate reversion; mean reversion takes time to play out#比特币跌破7万美元
post-image
BTC-0.67%
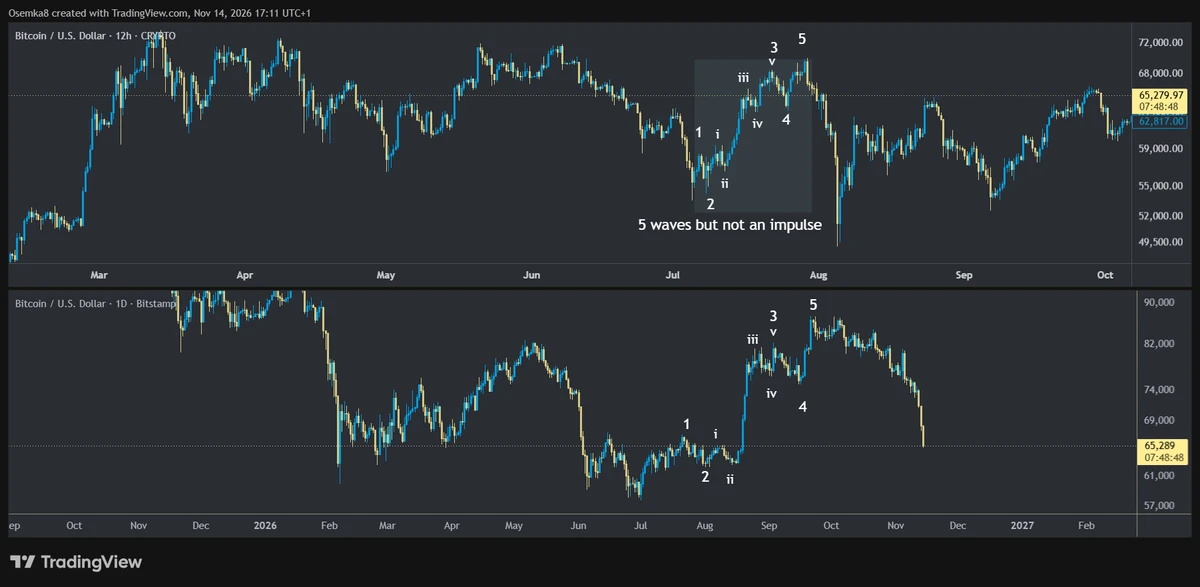
I think these two $BTC moves are quite similar from the EW perspective. Just because there are 5 waves up, doesn't mean it's an impulse
Everyone was counting 1-5 moves in the 2024 range as a first impulse (you can even cleanly subdivide them, exactly as now), but it went to sweep the low after. And I'm treating it the same here too. We could as well sweep the low or come just shy of it, but I'm of a belief this move, from July to Oct, was not a wave 1, but a part of a complex correction.
post-image
BTC-0.67%
Ether Nears $2,000 as Weekly Loss Outpaces Bitcoin's
Ether's four-week decline is deepening faster than bitcoin's. The ether price has fallen 14.7% over roughly four weeks, compared with bitcoin's 9.9% drop, and US ether ETFs have now seen net withdrawals for a fifth straight session. The underperformance marks a widening gap between the two largest digital assets.
⚠️ Personal market analysis only. NFA — manage risk and DYOR.
Educational content, not investment advice or a recommendation to buy, sell, deposit, or withdraw any asset. No paid promotion or referral/affiliate links.
post-image
BTC-0.67%
Load More

Join 40 M users in our growing community

⚡️ Join 40 M users in the crypto craze discussion

💬 Engage with your favorite top creators

👍 See what interests you

Trending Topics

GateIPOAccessAnthropic

320.2K Views2.9K Discussing

Gate IPO Access Phase 3 features Anthropic (ANT), with USDT subscription interest starting from 100 USDT. Successful allocations will be delivered as real shares to Gate Stock Accounts. Indicative price: $70–$78/share Subscription: Nov 12–17 (UTC+8) Allocation is not guaranteed. Please manage risk accordingly.

Dr.HanOxfordUnionSpeech

148.4K Views637 Discussing

USOctoberPPIBelowExpectations

467.1K Views1.6K Discussing

View More