Square
Following
Hot
News
Notifications
Profile
Share your thoughts
placeholder
Article
The Swing King’s skill isn’t found in a single analysis, but in the everyday calls made over the years! Last October, Qingyao told you to short for the long term, and you missed the 20,000-point black swan. This October, Qingyao warned everyone again that a black swan was coming! In November, the power of the bears was proven once again! BTC: 22,000 points; ETH: 1,000 points; gold: 400 points; SanDisk: 1,000 points; SOL: 40 points; ZEC: 700 points! Catch just one of these and you can take off!

At this point, someone’s bound to say, “You’re pretty happy about getting one call right, huh!” Hone
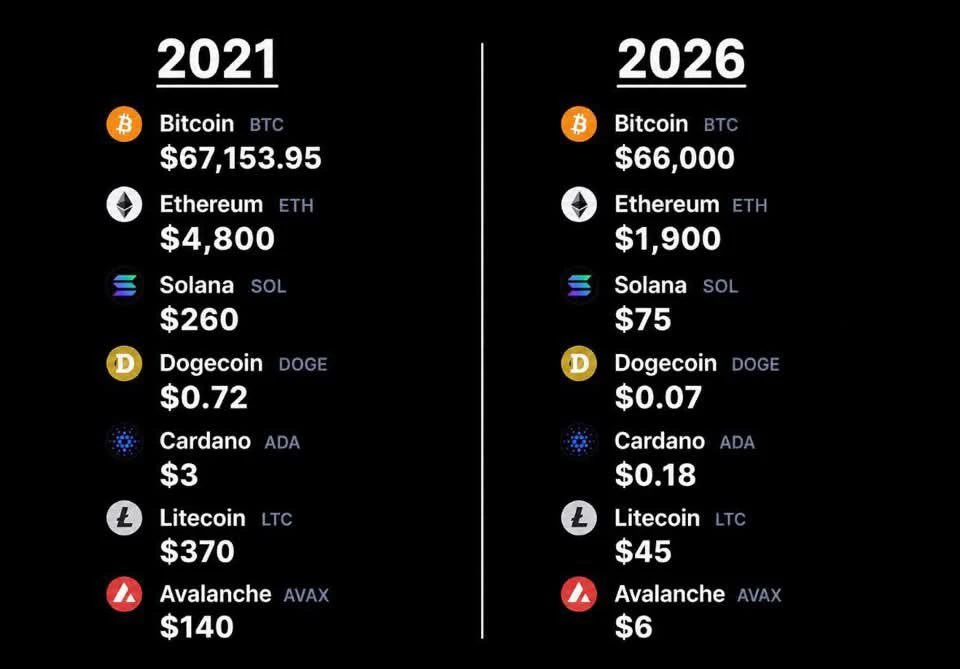
The 2021 Bitcoin bull market—we were riding high. What a great time. Then what happened? The 2022 bear market, the Bitcoin ecosystem in 2023, memes and Trump launching a coin in 2024. 2025 was volatile all year. And 2026—another year of volatility? What exactly happened over these five years?
post-image
BTC-0.67%
MEME-0.94%
TRUMP-0.95%
Trenches
mihao
m
bade
b
mihao
4Cxj...pump
Market Cap
$.
Change
.
24h Vol
$.
Holders
.
IDOL
I
bade
b
IDOL
0x3b...ab07
Market Cap
$.
Change
.
24h Vol
$.
Holders
.
Snoopy
S
bade
b
Snoopy
7mEh...47Cn
Market Cap
$.
Change
.
24h Vol
$.
Holders
.
NIO
N
bade
b
NIO
7SL2...pump
Market Cap
$.
Change
.
24h Vol
$.
Holders
.
FOOD
F
bade
b
FOOD
FTu5...pump
Market Cap
$.
Change
.
24h Vol
$.
Holders
.
$HOME This trade went from “free money” to “cutting losses” in just three days.
The day before yesterday, I watched it fall from 0.0052 to 0.0046. I thought it had dropped nearly 10%, so it had to bounce, and I entered with a 30% position at 0.0046. But after I bought, it just went sideways like a dead fish. Yesterday afternoon, a single bearish candle sent it straight down to 0.0043. I watched the order book, hoping for a rebound before exiting, but it never came. 24-hour trading volume was 5.7M, and volume kept shrinking, leaving fewer and fewer buyers.
The lesson is simple: in a downtrend,
HOME-0.31%
  • 1
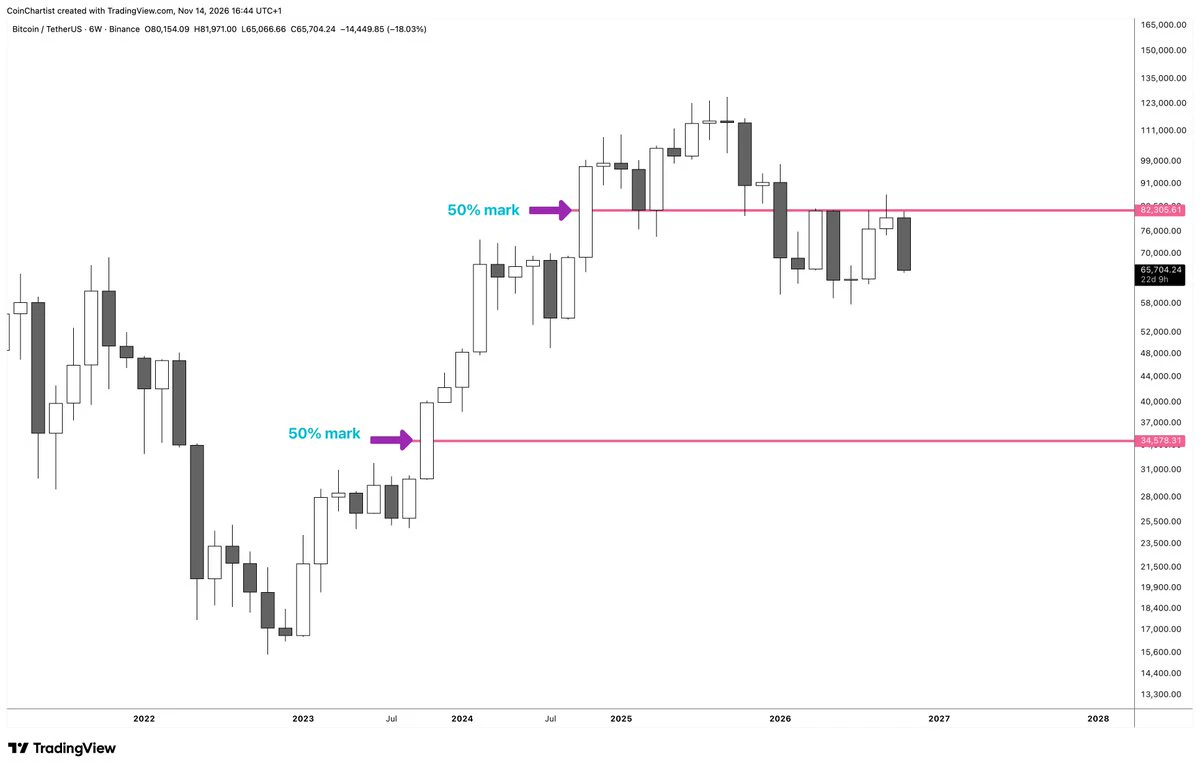
I strongly believe Bitcoin goes lower, and lower, and much lower ultimately over time
In the meantime, that bitcoin:native $34,500 target will be hit very soon
post-image
BTC-0.67%
crypto future market Update
live-cover
LIVE2,257
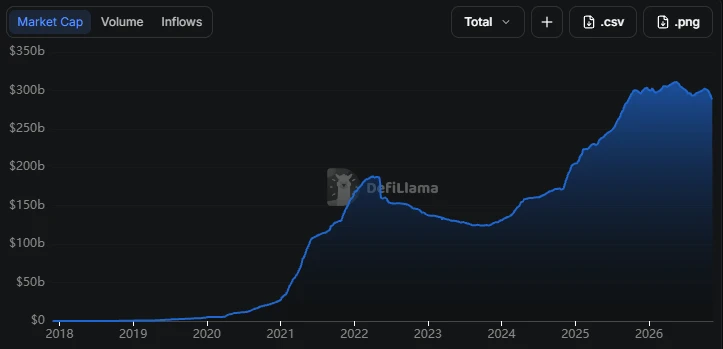
Stablecoin supply just dropped $17 billion in a month.
Biggest drop since 2022.
Think of stablecoins as the chips sitting on the poker table, guys. When people cash out, there's less money left to bet with.
Glassnode's read is simple. Bull markets need money coming in, and right now it's walking out the door.
So is this the final flush, or are we still early in the drain?
post-image
JUST IN: Petition to reinstate Jensen Huang as CEO of Nvidia $NVDA reaches 100,000 signatures.
NVDA-1.92%
#晒出我的持仓收益 What a shame, I bought too few put options the first time
post-image
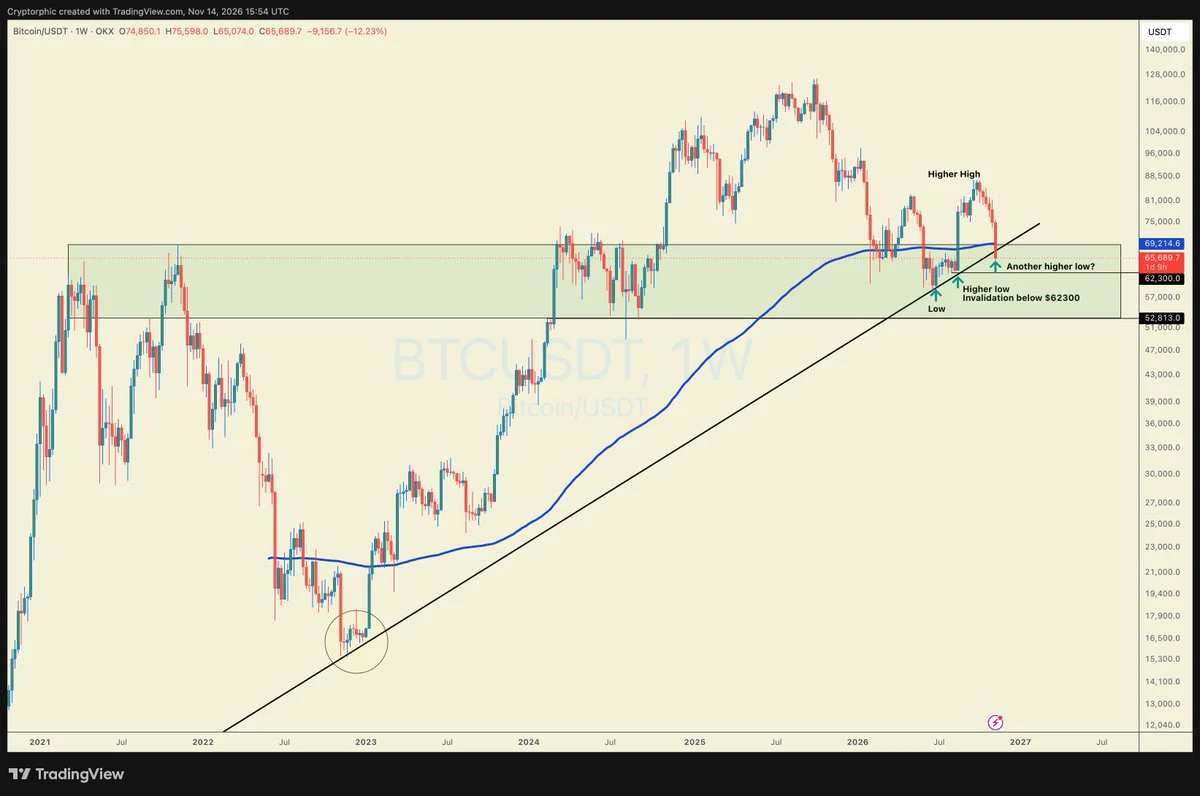
bitcoin:native Keeping it simple: The last few days have been absolute carnage for both BTC and altcoins. Honestly, I didn't expect this to happen so soon, so most of my recent charts got invalidated.
My friends on CT didn't see it coming either.
Fear is at extreme levels. I'm seeing charts projecting new lows below $57K. I'm not saying that can't happen, but IMHO, that's not necessarily how the market works.
I might be wrong, but I'm going to trust my charts, even in this mess.
My view remains simple:
$57K was the bottom.
BTC's most recent higher low (HL) was around $62,300.
As long as we hol
post-image
BTC-0.67%
Short-term opportunity? Key signals in the bull-bear showdown
live-cover
LIVE2,199
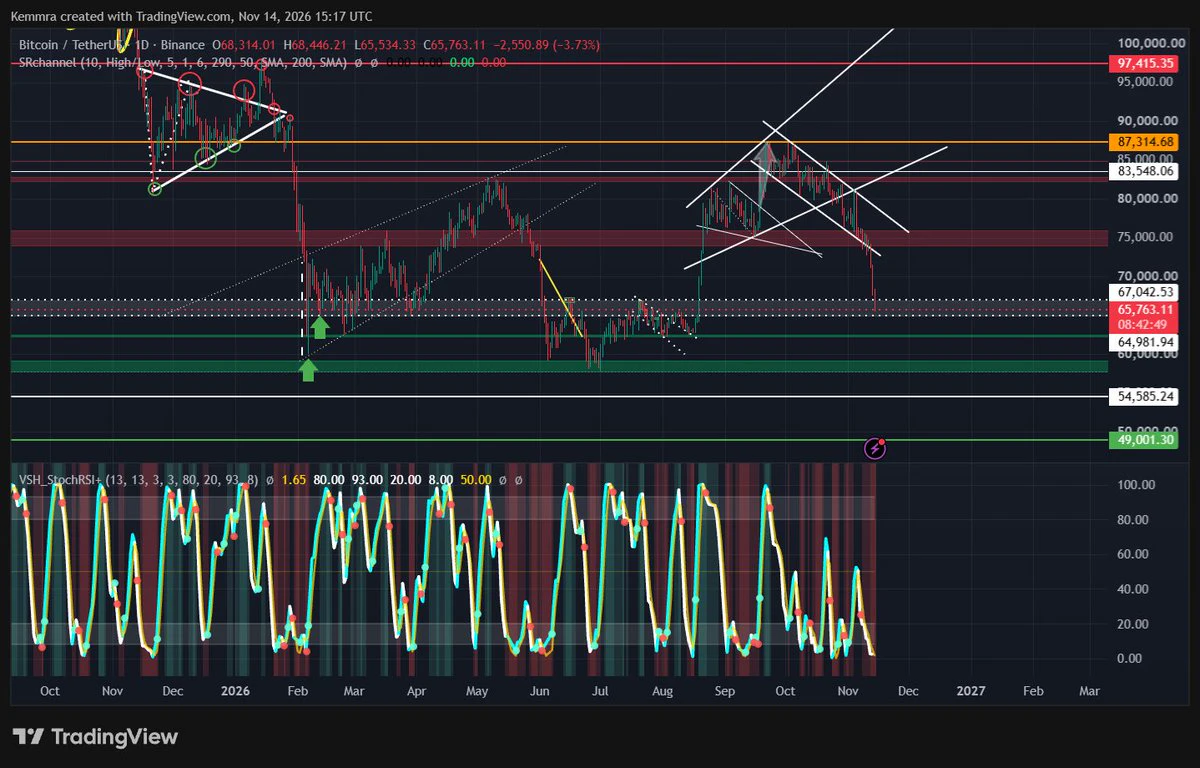
Bitcoin price loses $68K trendline: Can buyers defend $66K?

Bitcoin has fallen to around $67,200 on Nov. 14, losing more than 10% so far this week and slipping beneath its 200-week moving average as selling continues below $70,000.

TradingView’s $BTC /USDT charts show Bitcoin touching $66,456 before recovering toward $67,194 in the Nov. 14 snapshot. The daily candle was down 1.64%, while the weekly chart showed a 10.24% decline from an opening price near $74,851.

Bitcoin trades below its 200-week moving average

On the weekly chart, Bitcoin’s 200-week simple moving average stood at $67,992,
BTC-0.65%
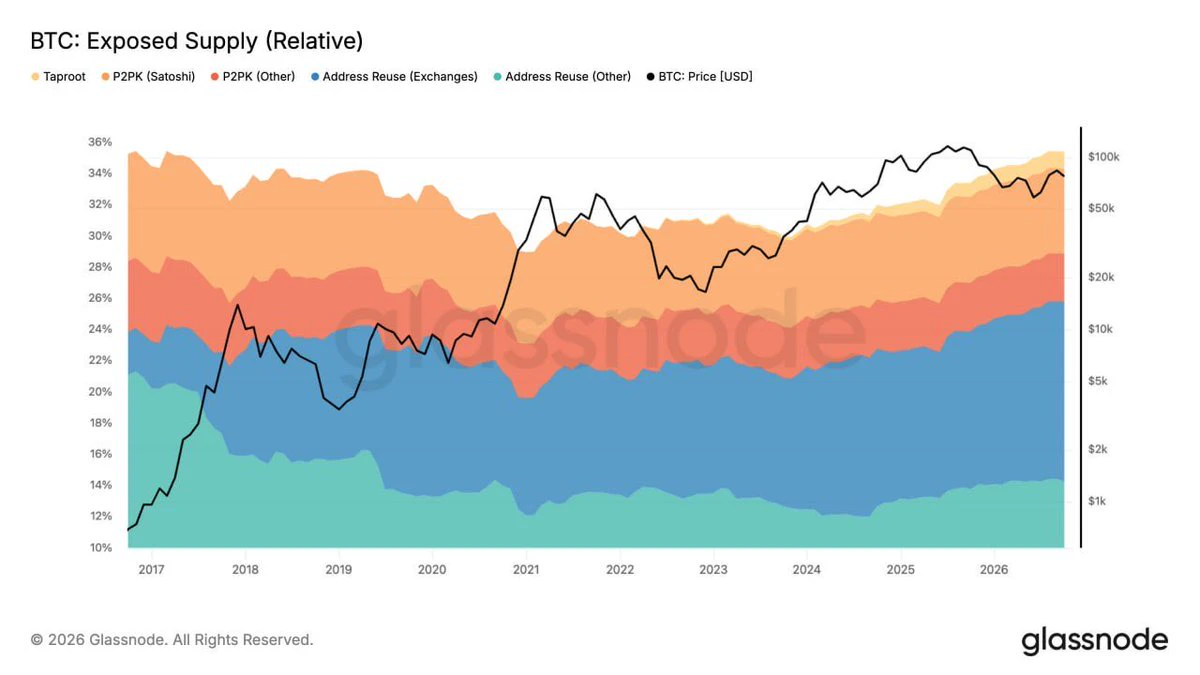
35.4% of Bitcoin’s supply (7.12M BTC) could face potential quantum computing risks due to exposed public keys.
post-image
BTC-0.67%
Stablecoins play an important role in the crypto ecosystem.
Designed to maintain a relatively stable value against another asset, often a currency like the US dollar, they can support digital payments, trading, and transfers.
But remember, stablecoins still carry risks, including issuer, reserve, and regulatory risks.
Understanding how they work matters. 💡
#Stablecoins #CryptoEducation #DigitalFinance
post-image
STABLE-1.39%
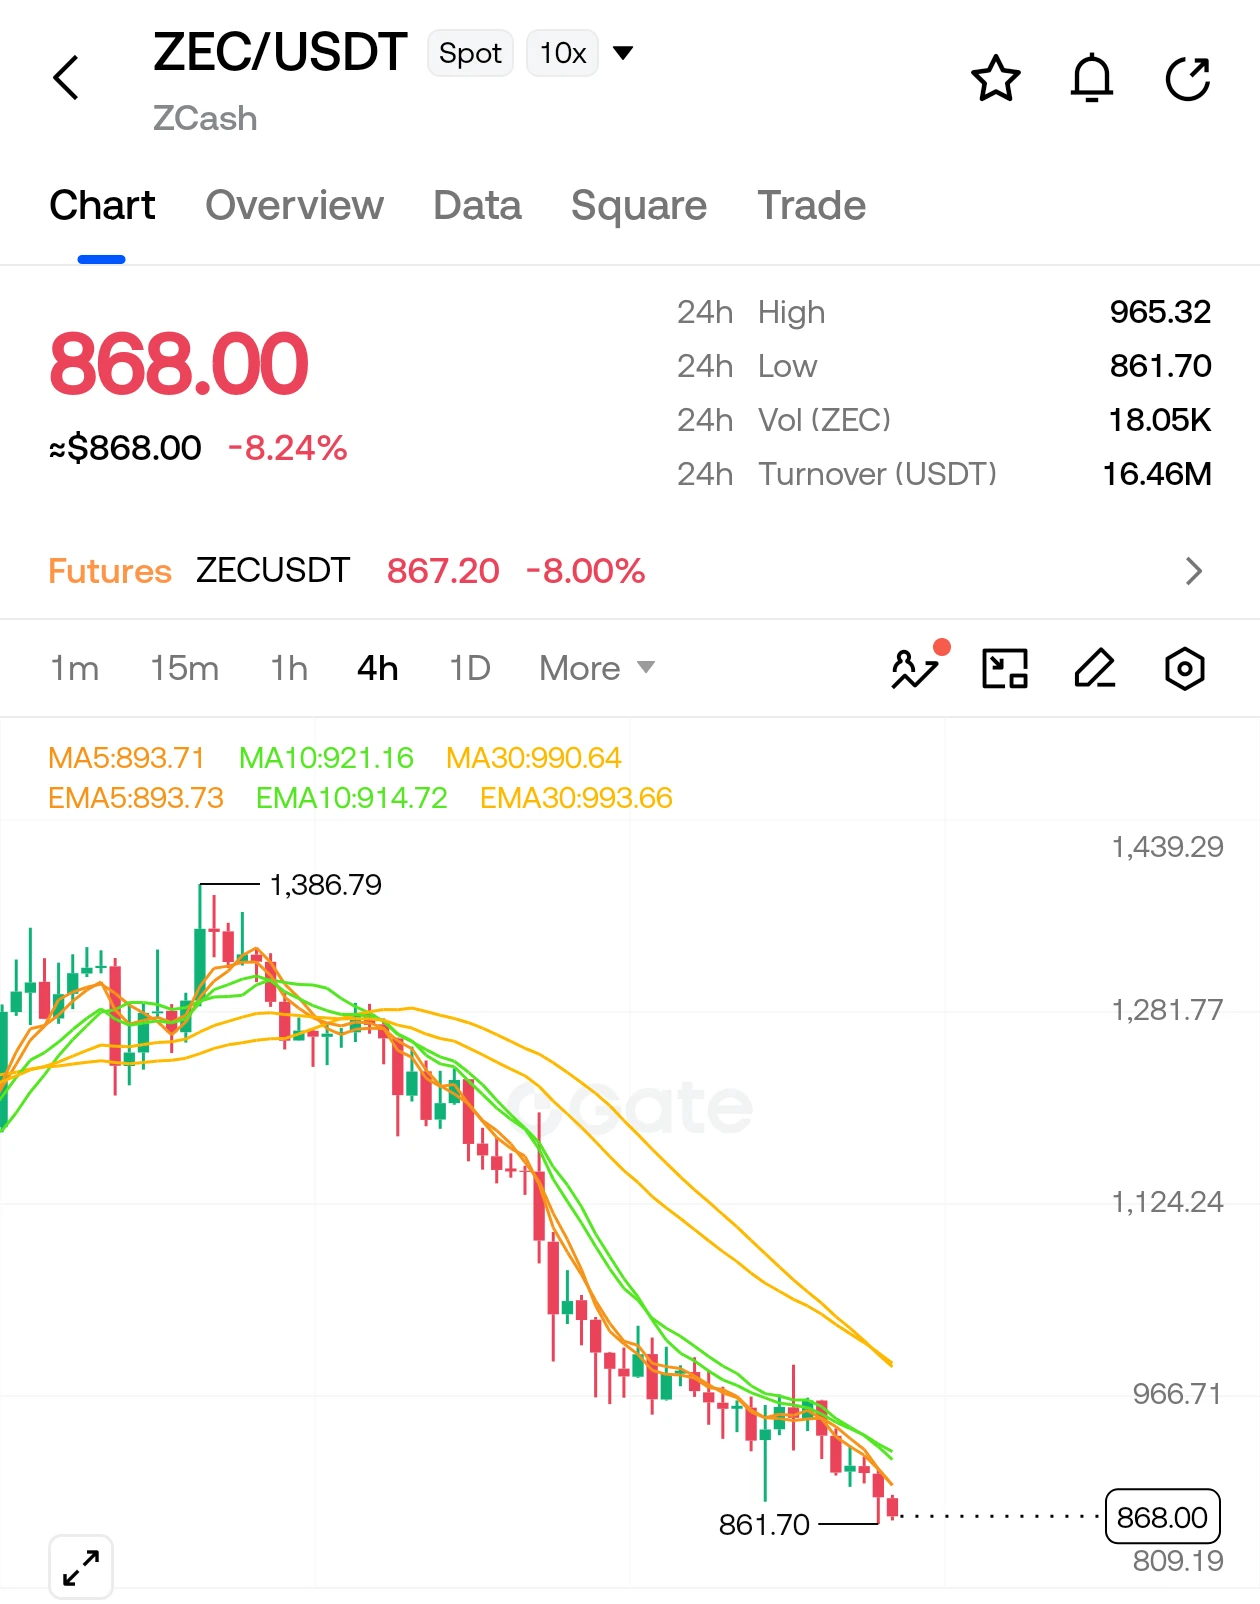
$ZEC is under heavy distribution on the 4H chart, trading at 868.00 (-8.24%) below all key moving averages. Following a tight consolidation phase beneath the 965.32 resistance ceiling, downward momentum accelerated and sliced cleanly through range support, testing the 861.70 demand floor.

The 860.00–862.00 zone is the final line of defense. Losing this level opens up serious breakdown risk toward the 809.19 liquidity pocket. Any dead-cat bounce faces stacked dynamic resistance at EMA5 (893.73) and EMA10 (914.72).

Smart money fades weak bounces here rather than catching falling knives. Lookin
post-image
ZEC+1.16%
🚨 BREAKING: Bitcoin $BTC plunges BELOW $66,000 as selling pressure continues across the crypto market! 📉
BTC-0.67%
Electricity bills are the most honest poll. When the blue wave rolls in, the first things to get turned upside down are electricity prices and subsidies. When energy policy shifts, the books for both traditional oil and gas and renewables have to be recalculated. Have your power bills gone up? I’m keeping an eye on the pace of subsidy phaseouts.
post-image
  • 1
  • 1
The evolution of mass fear:
👽 Aliens -> Finally, intelligent life.
🤖 Terminators -> Can they do my taxes?
☢️ Nukes -> Priced in.
🌎 Climate change -> Short winter.
⚡ Power grid collapse -> Touch grass.
🏦 Banks hacked ->> WHAT DO YOU MEAN MY $47 IS GONE?!!
post-image
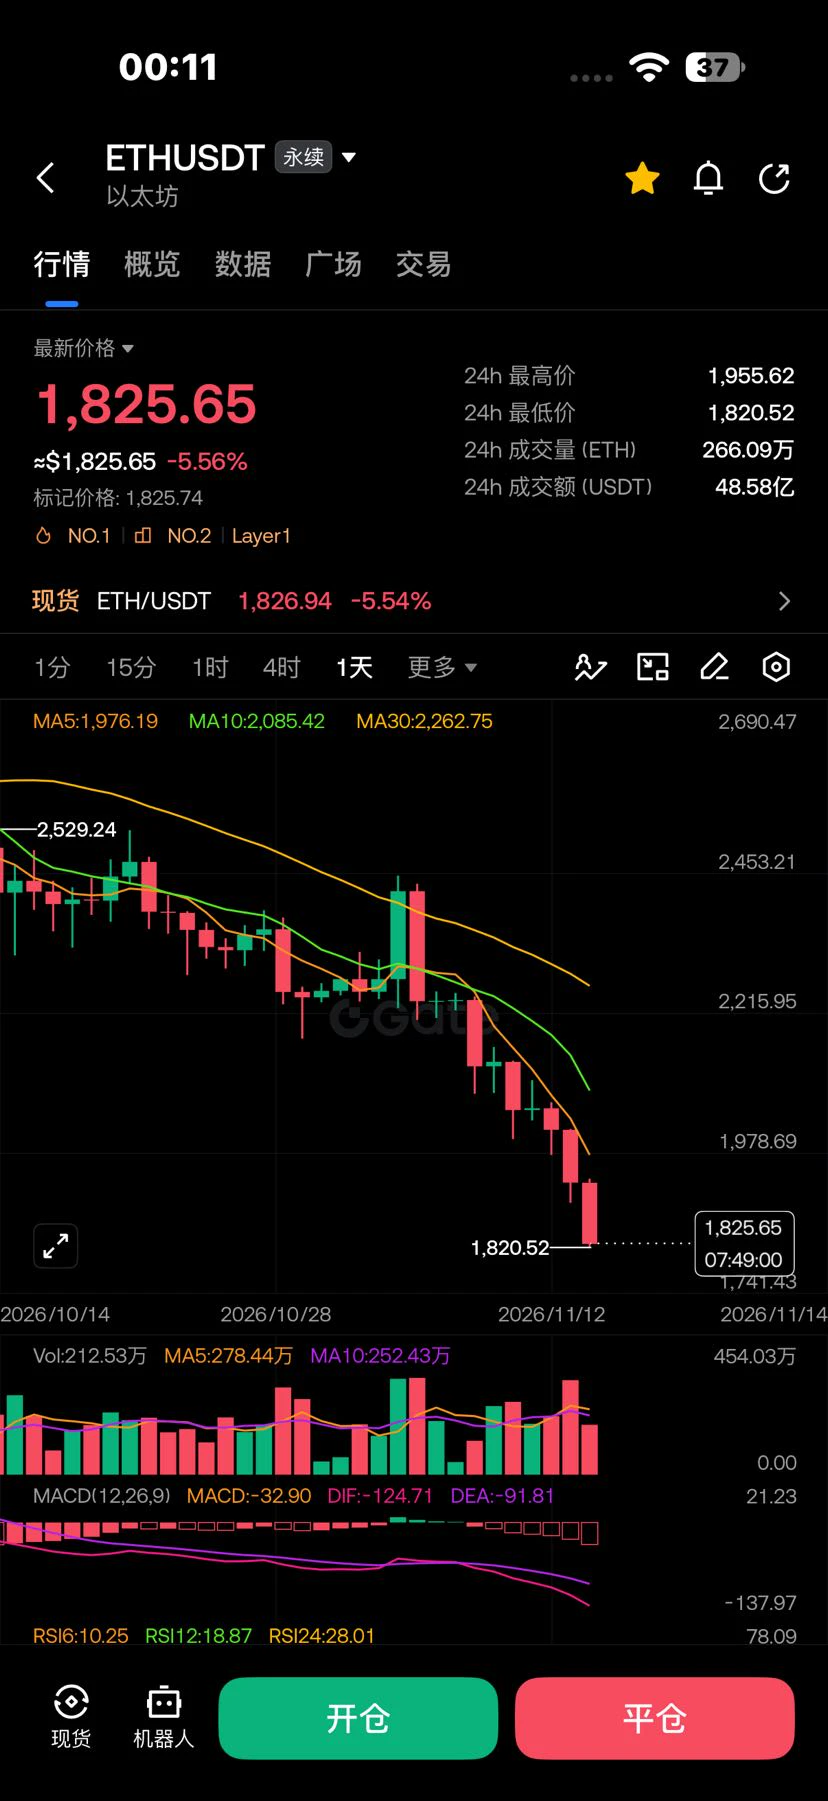
Ethereum is accelerating downward on the daily chart, and the high-volume sell-off has triggered successive liquidations. It is still falling in the short term on the 15-minute chart; a powerful wick that liquidates long positions is needed to stop the decline
post-image
ETH-1.23%
  • 2
For anyone who needs hopium.
$DOT and $ADA can close their eyes. 🫣
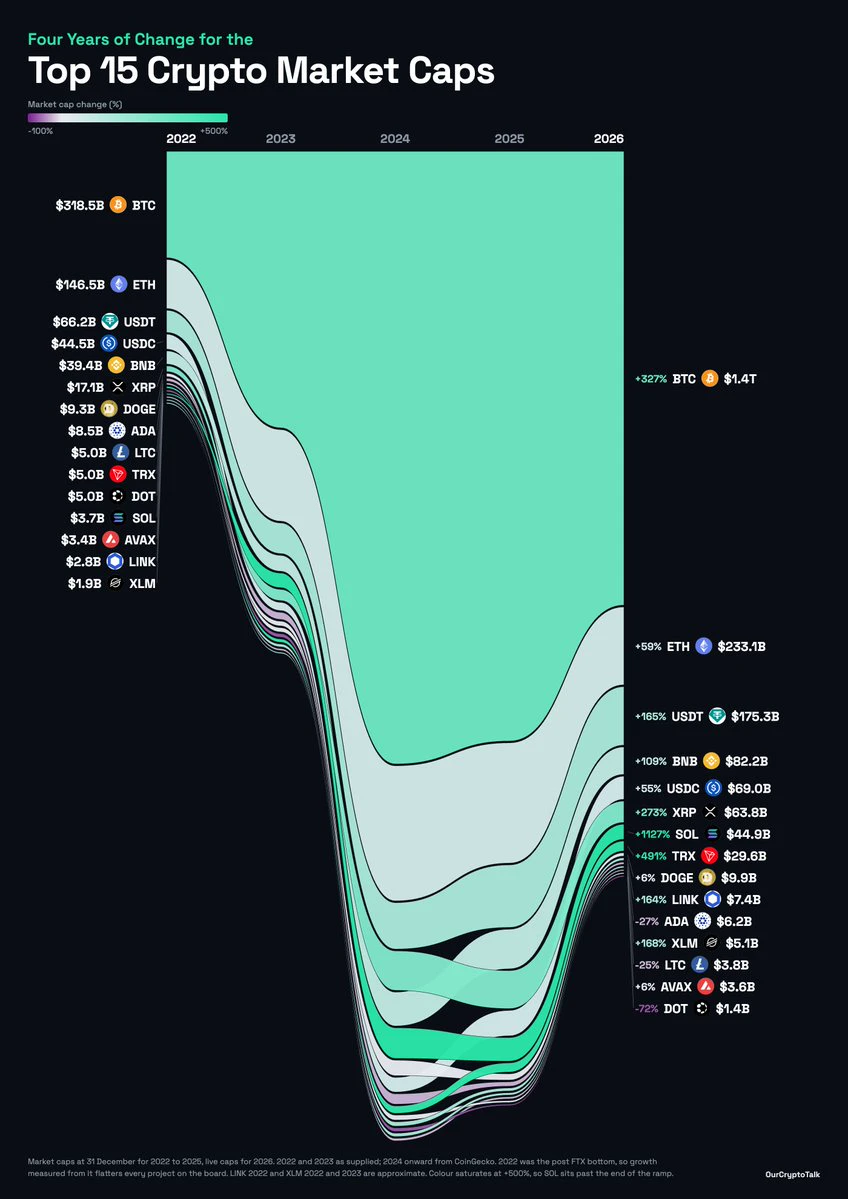
Crypto Market Cap Evolution (2022–2026)
1. Bitcoin (BTC)
2022: $318.5B | 2023: $827.8B | 2024: $1.83T
2025: $1.77T | 2026: $1.36T
Change: +327%
2. Ethereum (ETH)
2022: $146.5B | 2023: $274.2B | 2024: $404.7B
2025: $360.1B | 2026: $233.1B
Change: +59%
3. Tether (USDT)
2022: $66.2B | 2023: $91.7B | 2024: $138.8B
2025: $187.2B | 2026: $175.3B
Change: +165%
4. BNB
2022: $39.4B | 2023: $47.4B | 2024: $101.4B
2025: $118.5B | 2026: $82.2B
Change: +109%
5. USD Coin (USDC)
2022: $44.5B | 2023: $24.5B | 2024: $43.8B
2025: $76.0B | 2026:
post-image
DOT-1.51%
ADA-1.48%
BTC-0.67%
ETH-1.26%
USDT+0.00%
buying Crypto here is not a bad idea $btc
post-image
BTC-0.67%
Load More

Join 40 M users in our growing community

⚡️ Join 40 M users in the crypto craze discussion

💬 Engage with your favorite top creators

👍 See what interests you

Trending Topics

GateIPOAccessAnthropic

320.2K Views2.9K Discussing

Gate IPO Access Phase 3 features Anthropic (ANT), with USDT subscription interest starting from 100 USDT. Successful allocations will be delivered as real shares to Gate Stock Accounts. Indicative price: $70–$78/share Subscription: Nov 12–17 (UTC+8) Allocation is not guaranteed. Please manage risk accordingly.

Dr.HanOxfordUnionSpeech

148.4K Views637 Discussing

USOctoberPPIBelowExpectations

467.1K Views1.6K Discussing

View More