





Square
Following
Hot
News
Notifications
Profile
Share your thoughts
placeholder
Article
[Trending Topic] Jensen Huaung Could Face Removal
live-cover
LIVE1,708
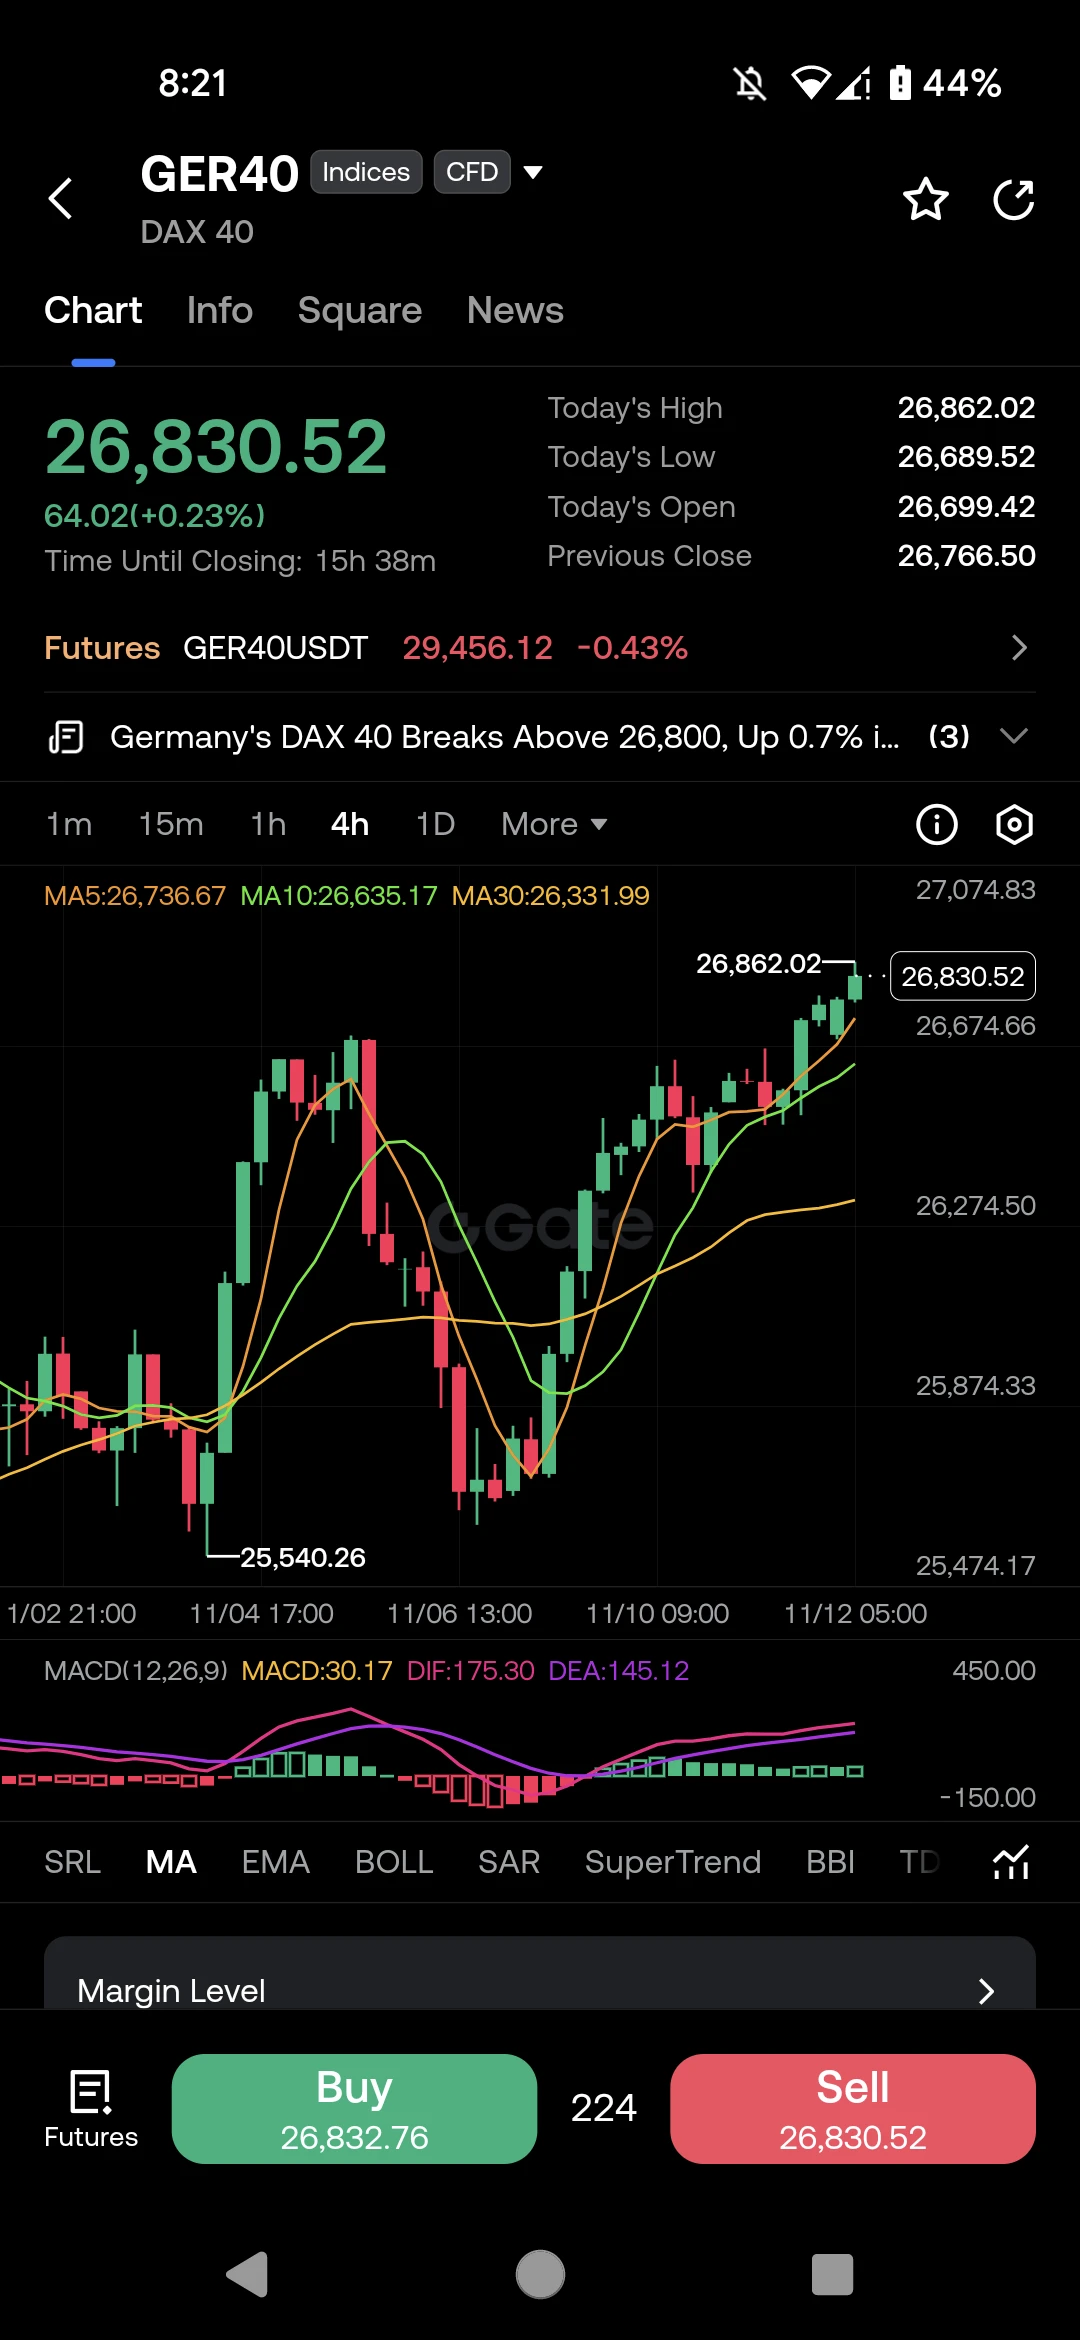
$GER40 ‌ (DAX) Breaking Out: Is 27,000 the Next Target?"

The German DAX is showing massive strength today! GER40 is currently trading at 26,830.52, up +0.23%, and it just broke above a major resistance zone.

Let us look at the technicals on the 4H chart:

· The Trend: Price has recovered beautifully from the 25,540 low, forming a strong staircase pattern.
· Moving Averages: The price is riding above the MA5 (26,736) and MA10 (26,635), with the MA30 far below at 26,331. This is a textbook bullish alignment.
· MACD: Positive at 30.17 with the DIF crossing above the DEA. The momentum is clearl
post-image
GER40+0.42%
Trenches
Max
M
bade
b
Max
5qaP...pump
Market Cap
$.
Change
.
24h Vol
$.
Holders
.
mihao
m
bade
b
mihao
4Cxj...pump
Market Cap
$.
Change
.
24h Vol
$.
Holders
.
AGT
A
bade
b
AGT
0x5d...e274
Market Cap
$.
Change
.
24h Vol
$.
Holders
.
DacityCoin
D
bade
b
DacityCoin
DKYc...pump
Market Cap
$.
Change
.
24h Vol
$.
Holders
.
Max
M
bade
b
Max
HPSp...h53z
Market Cap
$.
Change
.
24h Vol
$.
Holders
.
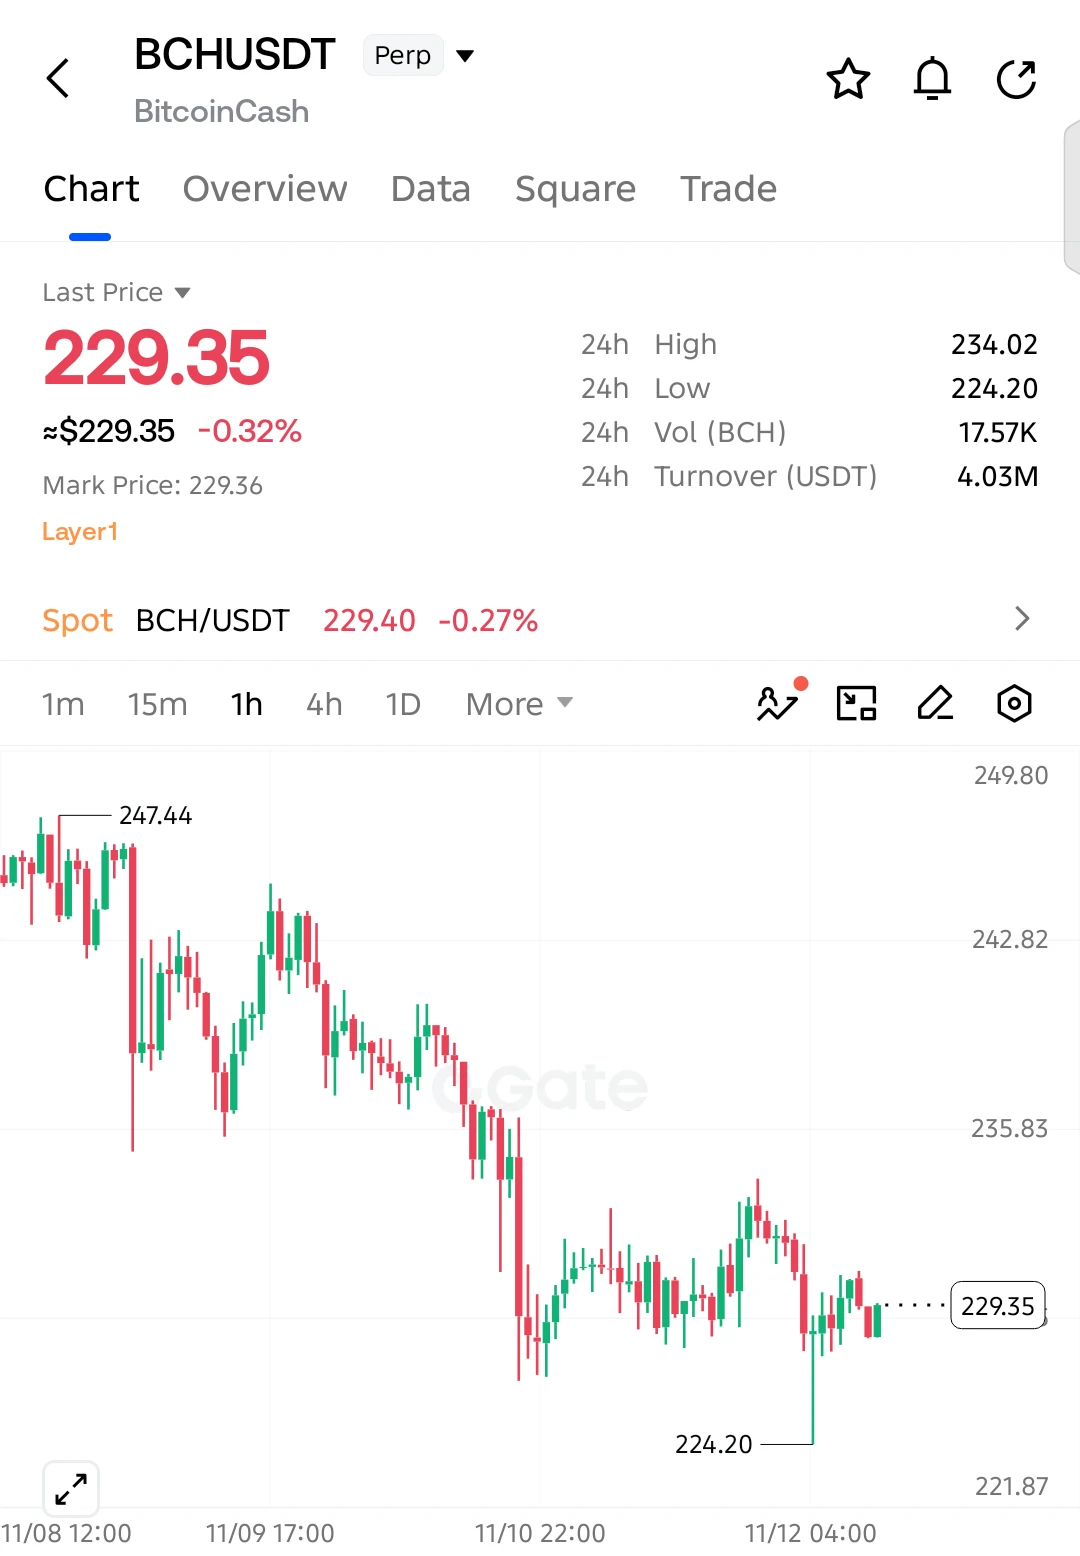
$BCH SHORT SETUP — BEARS STILL HAVE THE UPPER HAND!

Entry: 229.35
SL: 233.50

TP1: 226.50
TP2: 224.20
TP3: 221.90

$BCH remains under selling pressure after falling from 247.44. The recent recovery attempts have failed to reverse the bearish trend, with sellers defending higher levels. A breakdown below 224.20 could open the door for another decline toward 221.90.

Invalidation: A sustained recovery above 233.50 weakens the bearish setup.
post-image
BCH+1.05%
  • 6
Friends who followed SanDisk last night,
you know best.
You’re already up nearly 60 points.
I trade the medium to long term,
so manage your take-profit (TP) based on your own positions.
I never close out my entire position. Even when I stop out, I don’t sell everything; I always trade in batches.
So I give you the overall direction, but I can’t give you specific price levels. Am I right, friends?!
Everyone trades differently and has a different view of the market (and different levels of understanding). After all, only you know your own positions and price levels, and I can’t operate your phon
post-image
SNDK+13.75%
  • 1
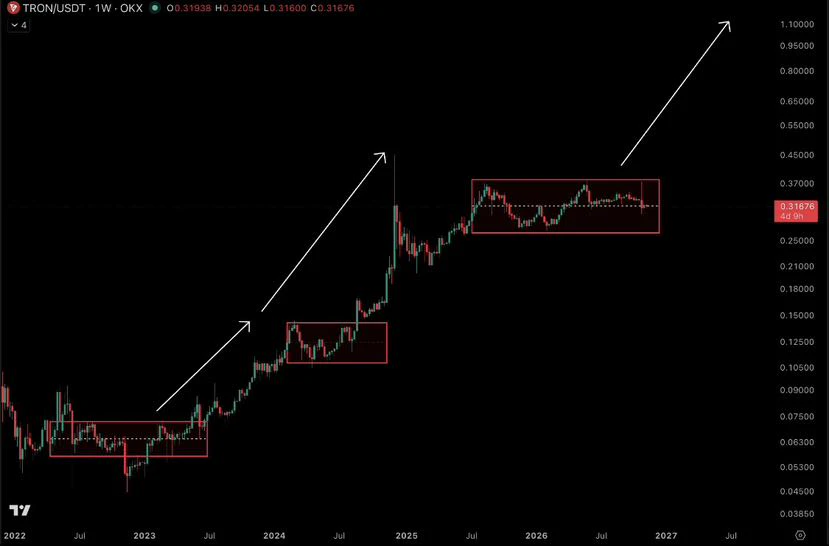
$TRX has been building a habit of turning boring charts into expensive lessons

three major accumulation zones, two historic expansion moves, and now another range around $0.25–$0.37

is the third breakout going to make the previous ones look small?
post-image
TRX+0.42%
  • 7
Why Doesn’t the Price Necessarily Rise When Open Interest Keeps Increasing?

In the crypto derivatives market, open interest (OI) is often used to gauge the level of market participation.

When OI keeps increasing, some traders believe that more and more capital is entering the market and that a move may be about to begin.

But there is a key question here:

An increase in open interest reflects an increase in open positions, not necessarily an advantage for buyers.

Why?

First, every open contract has both a long and a short side.

In derivatives markets such as perpetual futures, each open
post-image
BLSH+2.72%
CRYPTO MARKET OVERVIEW
live-cover
LIVE2,108
As the crisis deepens, Nvidia's board is set to decide Jensen Huang's fate

What’s most noteworthy isn’t that Nvidia’s board is actually deciding whether Huang will stay on, but that this has pushed the bedrock of a company with a market cap as high as $4 trillion to the edge of a cliff😂

Reuters reports that the board will meet later Wednesday to decide whether to remove CEO Jensen Huang. Compared with Sunday's “confident” statement, this is a stunning reversal. What lit the fuse? The Wall Street Journal reported that the company is preparing to fire him, amid reports of his extramarital aff
post-image
NVDA-5.72%
Why Do Spot and Futures Prices Trade at a Premium or Discount?

When you open a cryptocurrency trading platform, you may notice that the spot and futures prices for the same asset, such as BTC, are not exactly the same.

Why does this difference occur? Does it mean there is an arbitrage opportunity?

To understand this, we first need to clarify how the spot and futures markets work.

I. What Are Premiums and Discounts?

When the futures price is higher than the spot price, it is generally called a futures premium; when the futures price is lower than the spot price, it is generally called a fu
BTC-0.65%
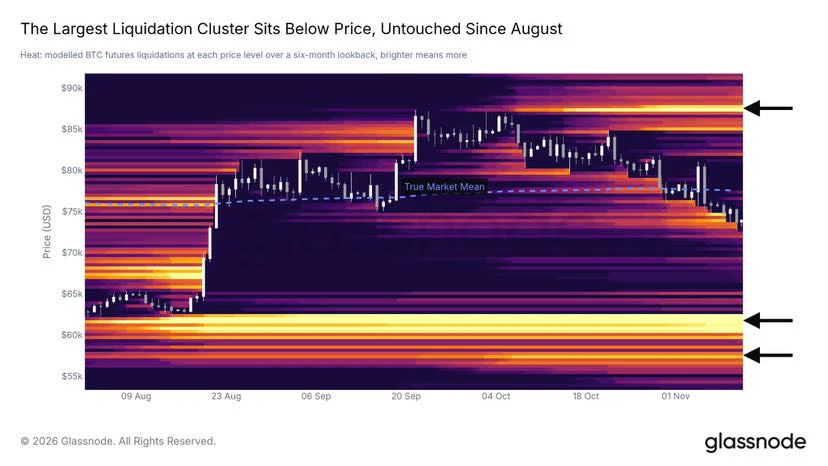
Bitcoin’s largest liquidation cluster is located around $60,000.

These are long positions opened near the bottom, and since prices surged in August, the market has yet to test their entry points.

Patient buyers often find opportunities in forced selling, and a sweep down to $60,000 would create plenty of them.
post-image
BTC-0.65%
Not every promising conversation starts in a massive crypto community.
Smaller groups can bring together passionate builders, curious learners, and creative thinkers who genuinely want to contribute.
Numbers matter, but meaningful participation matters too.
What's more important to you in a crypto community: size, knowledge, or engagement? 👇
#CryptoCommunity #Web3 #Blockchain
post-image
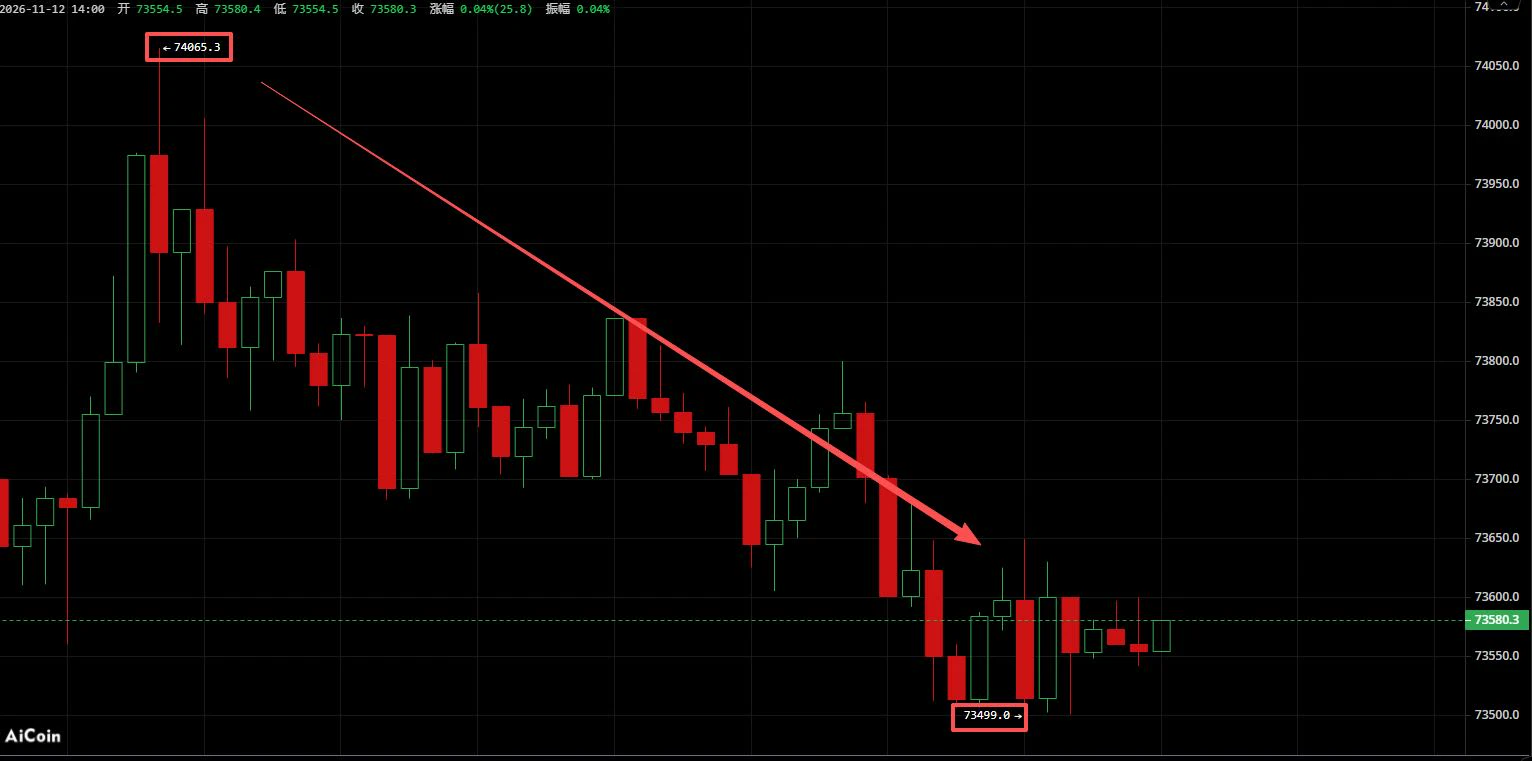
$BTC Bitcoin morning short trade setup played out!
The predicted high of 74771.4 formed an LH, creating a lower-high bearish structure. Shorts were placed at 73700-74200, with a target retest of 73350. The market dipped to a low of 73499, landing precisely in the target zone.
Price failed to break above the 74150 resistance, and every rebound offered an entry window for bears. The trend-following short captured this pullback. #ZEC跌破1000美元
post-image
YaoYao
$BTC YaoYao | 11.12 BTC Outlook
Entry range: Around 73,700–74,200
Band: Above 74,500
Levels above: 74,500–74,770
Pullback target: 73,350; if it breaks below, watch 73,000
After this rally peaked at 74,771.4, each subsequent rebound has peaked below the previous one, forming a classic LH bearish structure. The bulls failed to hold their gains after making a new high, and consecutive large bearish candles drove prices down, signaling heavy overhead selling pressure and weak buying support. The rebound is merely a recovery within the decline, not a reversal.
The short-term resistance zone is 74,150, which is the upper edge of our band. As long as the rebound fails to hold above this level, every bounce higher will offer bears another opportunity to press their advantage. This is the dividing line between bulls and bears; if price cannot break above it, the downtrend structure will remain intact.#美伊谈判出现新进展

BTC-0.65%
Why Does a Transaction Show as Successful While the Assets Still Haven’t Arrived? Understand These 5 Key Stages

In cryptocurrency transactions, one situation is especially likely to cause anxiety:

Your wallet shows the transaction as successful, and the blockchain explorer also shows a transaction record, but the assets still haven’t appeared in the receiving account.

Some people think the platform has swallowed their funds, some suspect the transaction failed, and others, worried their assets are lost, rush to transfer them again.

But in reality, a successful on-chain transaction does not
post-image
Gm gm fams
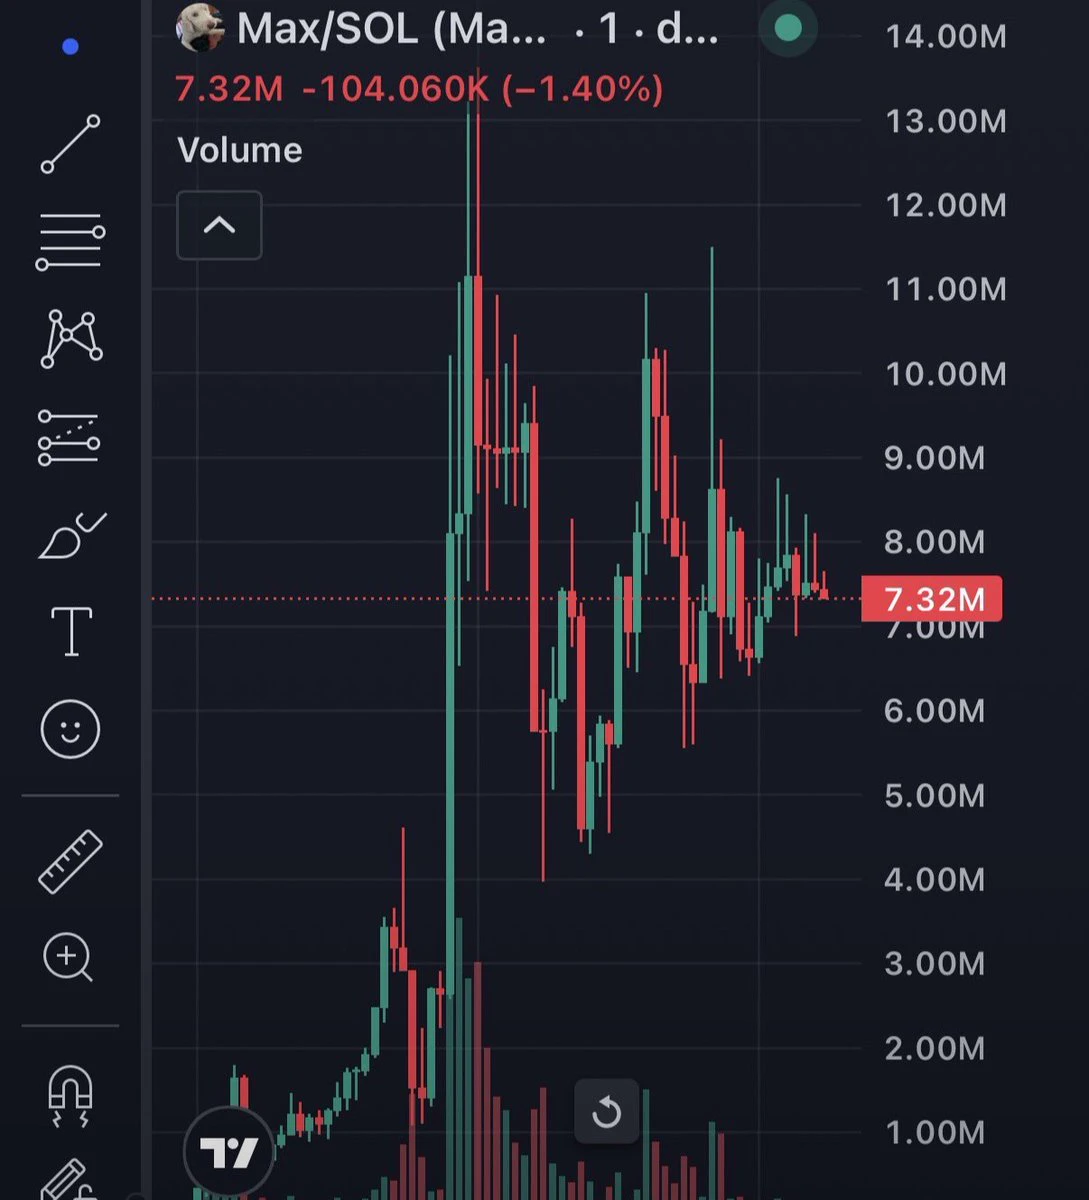
The $MAX lore is getting ridiculous
One rumour about Elon Musk’s son and people started trading like they had a seat at the Musk family dinner
Now the chart is down bad and everyone suddenly wants proof
Moral of this story: never let a billionaire’s family tree become your trading strategy
Now everyone is waiting for the Musk family reunion to save their bags
post-image
MAX-3.22%
#美国就业数据今晚公布
Yes. In fact, a stronger U.S. economy could have a bearish impact on both BTC and U.S. stocks in the short term. This is one of the most intriguing macroeconomic paradoxes in today’s markets.

The key point here is not necessarily whether the employment data is strong or weak, but rather how this data shifts expectations regarding the Federal Reserve’s (Fed) interest rate policy.

Three possible scenarios

Unemployment claims Potential market reaction
Below 194,000 Strong labor market; higher likelihood that interest rates will remain elevated for longer. Downside risk for BTC and
post-image
BTC-0.67%
SNDK+13.75%
HK50-0.39%
AMD+7.27%
MU+12.02%
  • 7
  • 1
Why Do Profitable Traders Still Experience Consecutive Losses?

Many people believe that once they master an effective trading strategy, they should be able to make money consistently. But anyone who has actually traded BTC knows that even a strategy with positive returns over the long term does not mean every trade will be profitable, nor does it mean consecutive losses are impossible.

Why does this happen?

First, market conditions are constantly changing. A strategy suited to trending markets may generate frequent false signals in a choppy market, while a method suited to choppy markets ma
post-image
BTC-0.67%
When judging the BTC trend, should you look at the daily or 4-hour chart?

In BTC trading, many people look at candlestick charts every day but often run into the same problem: the daily chart looks like it’s moving up, while the 4-hour chart has already started falling; the 4-hour chart shows a buy signal, while the daily chart is still in a downtrend.

Which timeframe should you trust?

In fact, the daily and 4-hour charts do not contradict each other; they serve different purposes.

First, the daily chart is mainly used to determine the overall direction. It can help us see whether the mark
post-image
BTC-0.67%
Why can oracle price deviations put an entire DeFi protocol at risk?

In the DeFi world, smart contracts can automatically execute lending, trading, and liquidations, but they do not inherently know the prices of real-world assets.

For example, a lending protocol needs to determine how much a user's ETH collateral is worth in order to calculate how much the user can borrow and when liquidation needs to be triggered.

So where does price information come from?

This involves a key component: the oracle.

Oracles provide external data to blockchain applications, but if price data deviates, smar
post-image
ETH-1.26%
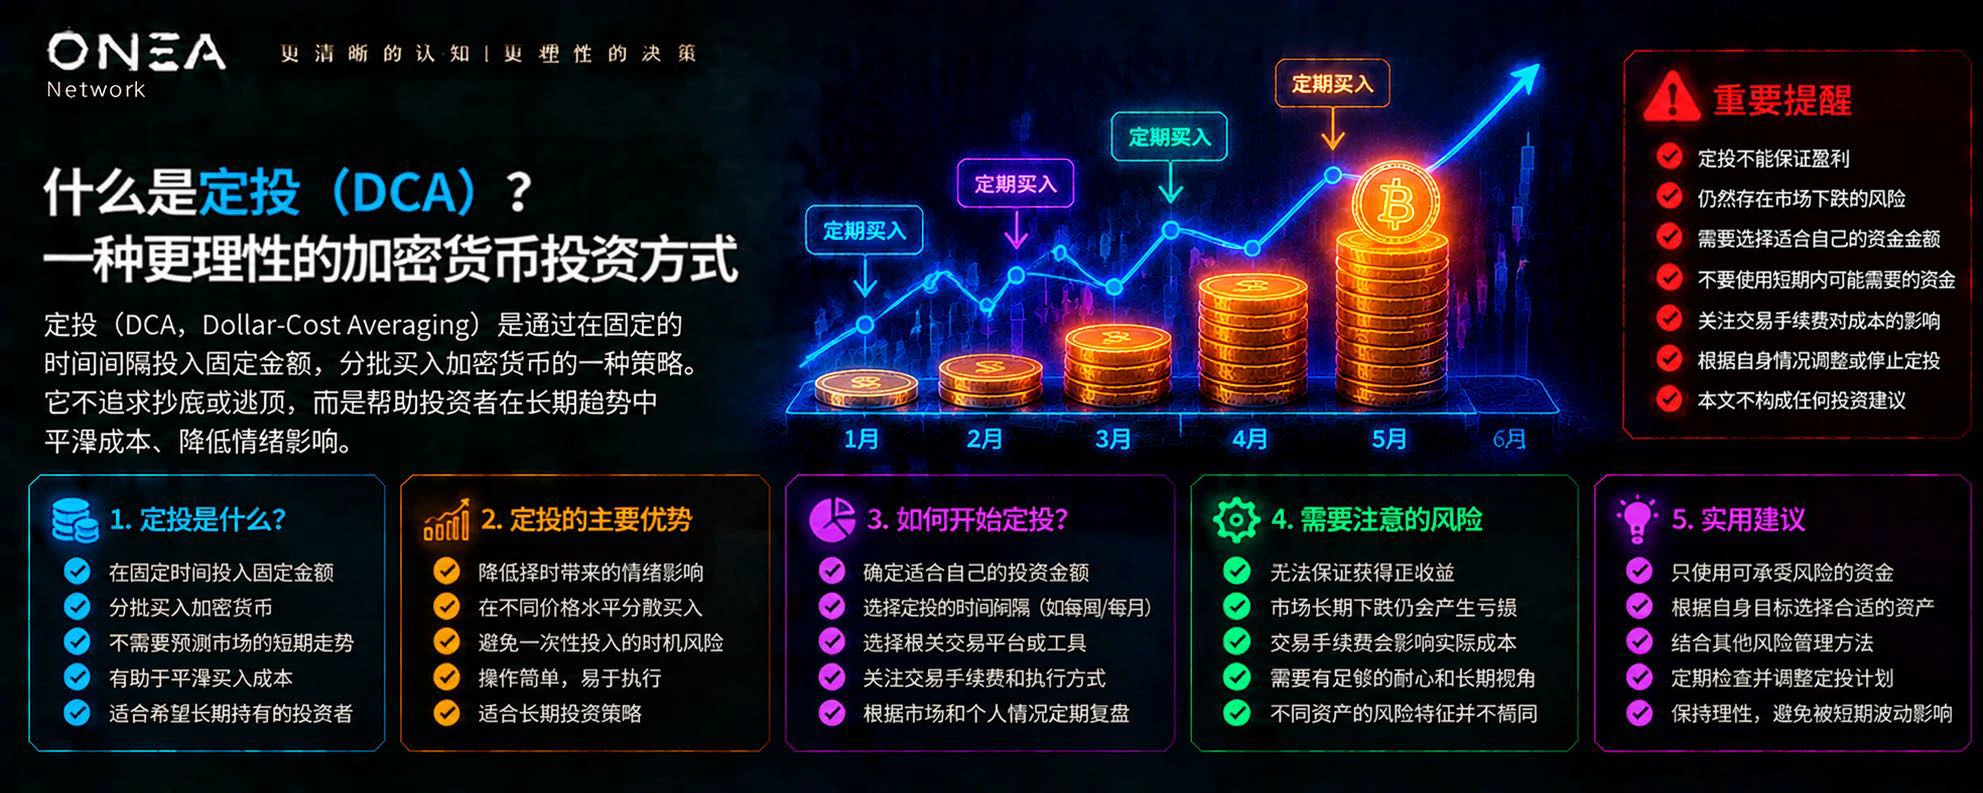
What Is Dollar-Cost Averaging (DCA)? A More Rational Way to Invest in Cryptocurrency

In the cryptocurrency market, some people try to find the lowest entry point, others keep chasing rising prices, and some invest a large amount in a short time because they are afraid of missing out.

But market movements are difficult to predict accurately. For those who want to participate in the market over the long term, is there an investment method that avoids having to frequently judge when to buy and is easier to stick with?

Dollar-cost averaging (DCA) is a strategy worth learning about.

1. What is
post-image
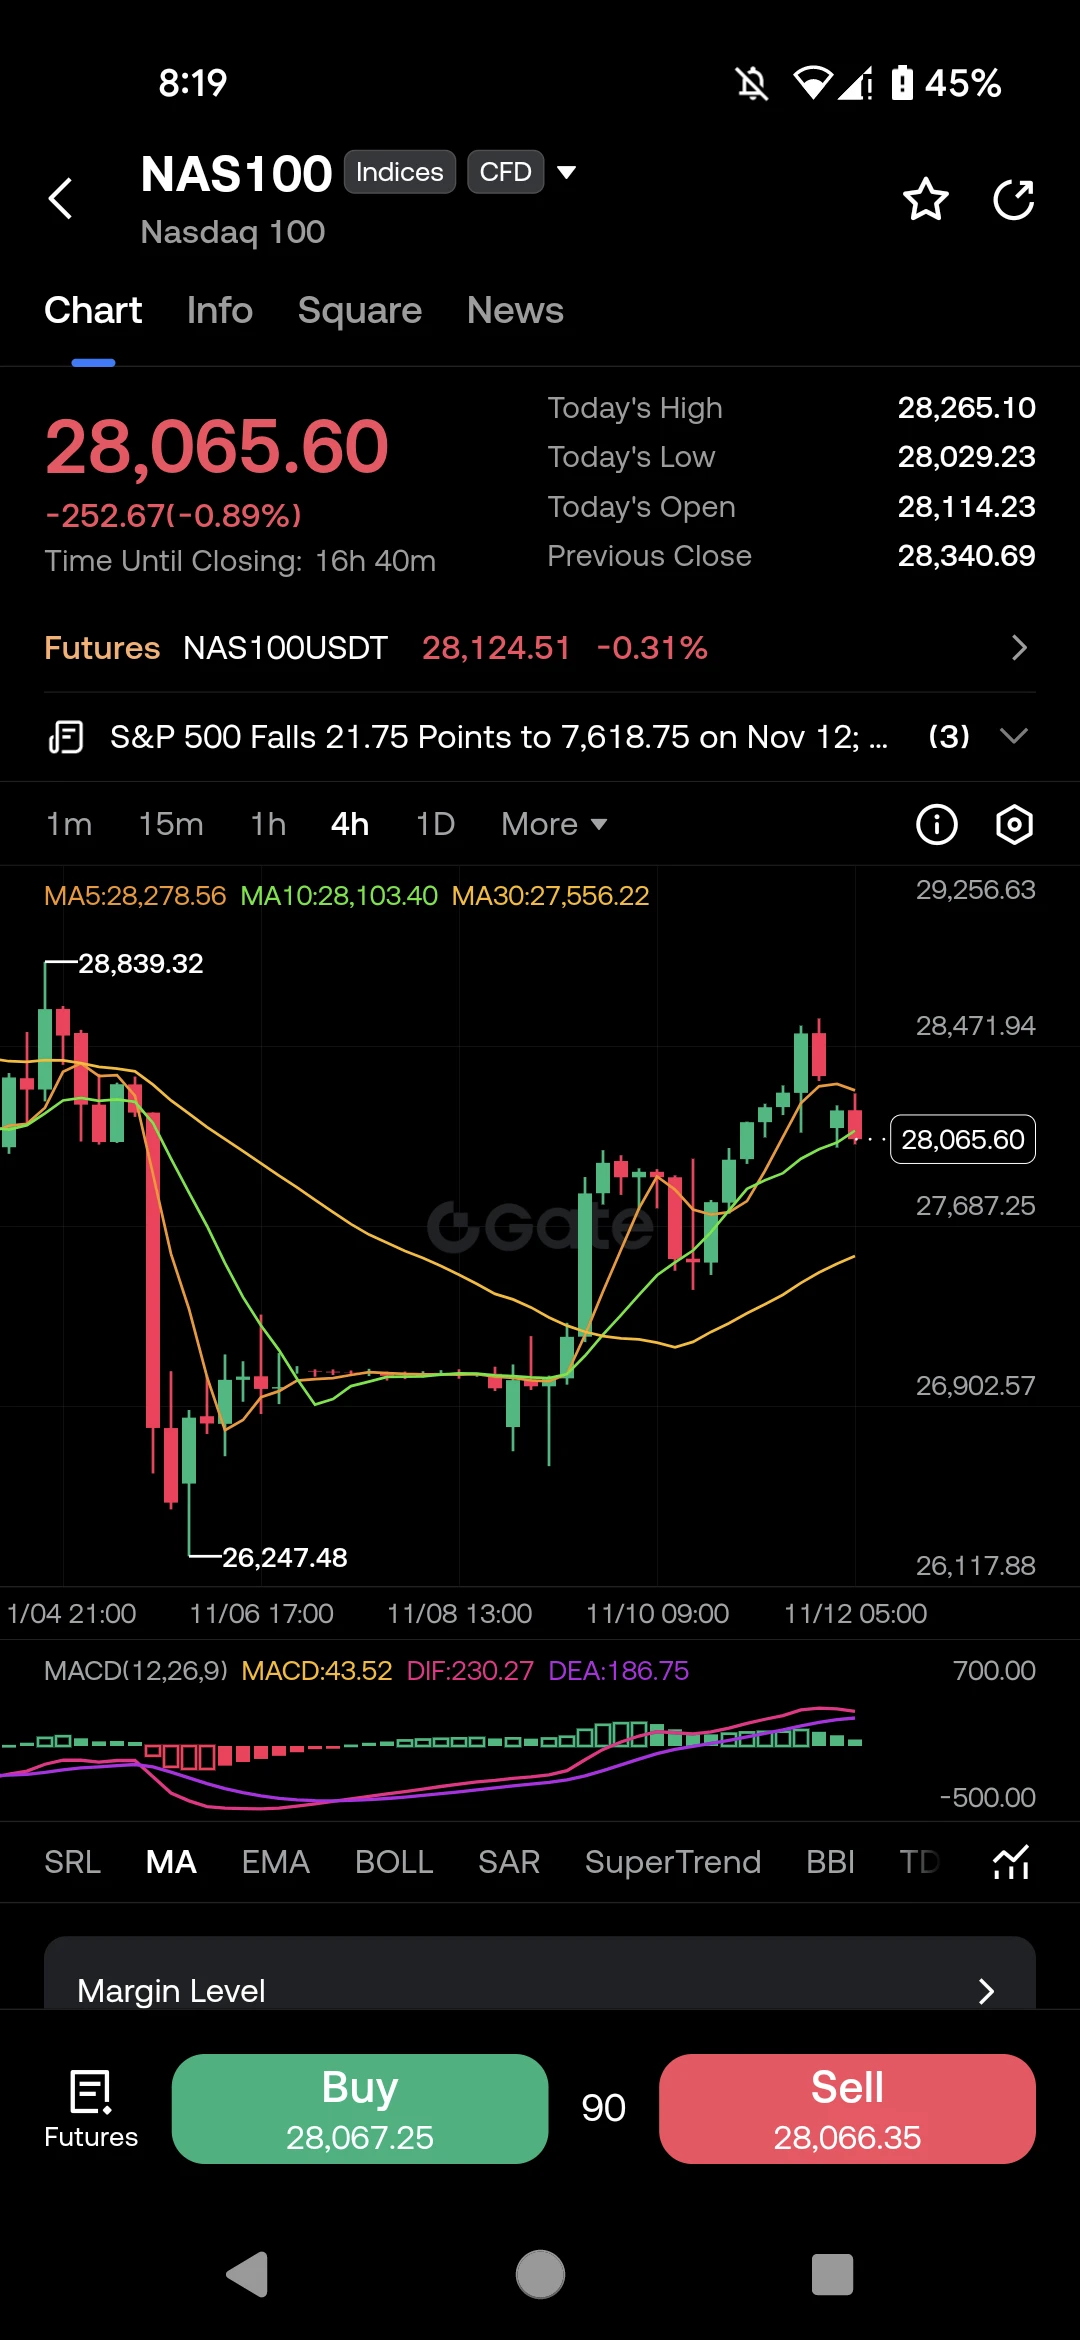
$NAS100 ‌ Pulls Back: Is This Just a Healthy Correction?"

The tech rally is taking a breather today. NAS100 is currently trading at 28,065.60, down -0.89% after a massive run-up from the 26,200 lows.

Let us look at the technical picture on the 4H chart:

· The Trend: The price hit a local peak near 28,839 and is now pulling back.
· Moving Averages: We just broke below the MA5 (28,278) and we are testing the MA10 (28,103). The MA30 remains far below at 27,556, which is a strong long-term support.
· MACD: Still positive at 43.52, but the histogram is shrinking. This indicates that the bullish
post-image
NAS100-0.76%
Load More

Join 40 M users in our growing community

⚡️ Join 40 M users in the crypto craze discussion

💬 Engage with your favorite top creators

👍 See what interests you

Trending Topics

GateIPOAccessAnthropic

249.8K Views2.3K Discussing

Gate IPO Access Phase 3 features Anthropic (ANT), with USDT subscription interest starting from 100 USDT. Successful allocations will be delivered as real shares to Gate Stock Accounts. Indicative price: $70–$78/share Subscription: Nov 12–17 (UTC+8) Allocation is not guaranteed. Please manage risk accordingly.

USJoblessClaimsTonight

166.6K Views32.8K Discussing

GateOctoberTransparencyReport

238.5K Views1.8K Discussing

View More