






Square
Following
Hot
News
Notifications
Profile
Share your thoughts
placeholder
Article
Prediction played out | Rebound met resistance and fell as expected
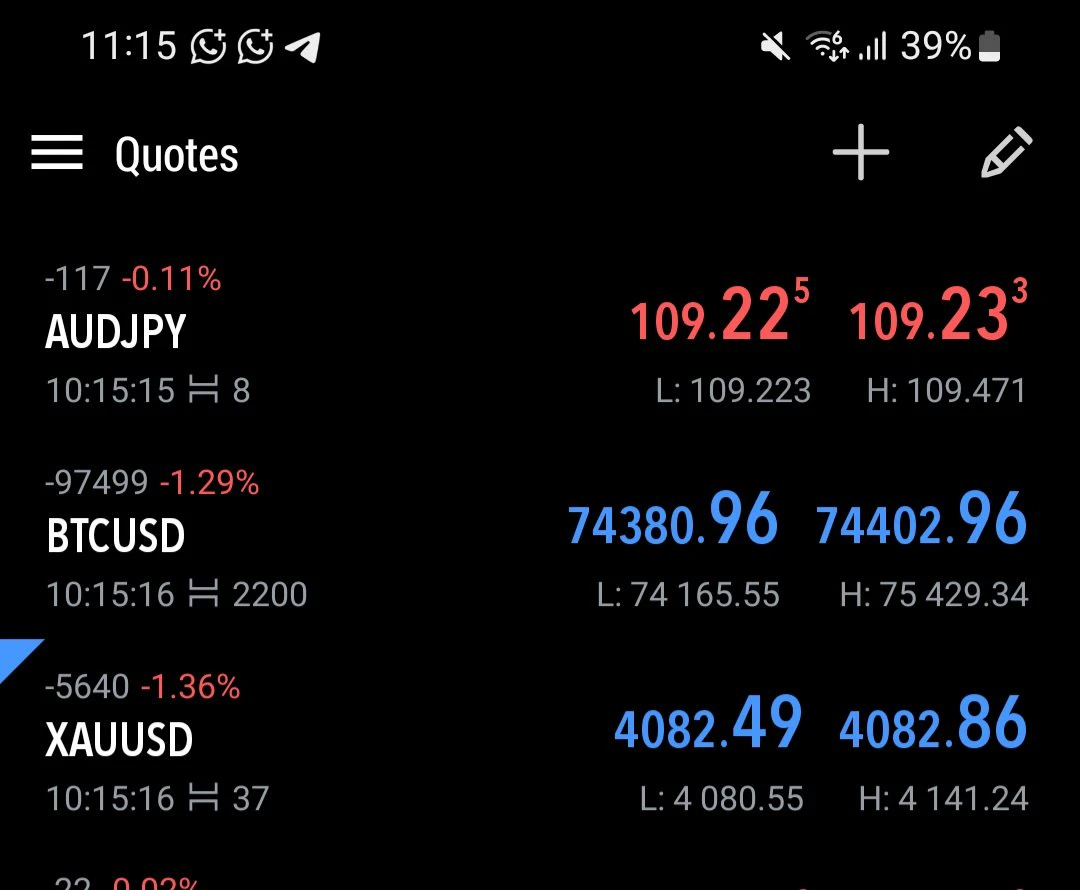
Shorts in the BTC 75500-76000 resistance zone played out, with the price hitting a low of 74142 and offering 1300 points of downside.
A weak rebound doesn’t change the broader bearish structure. Follow the trend and short at higher levels, waiting for the next target.
#USCPIDataIncoming
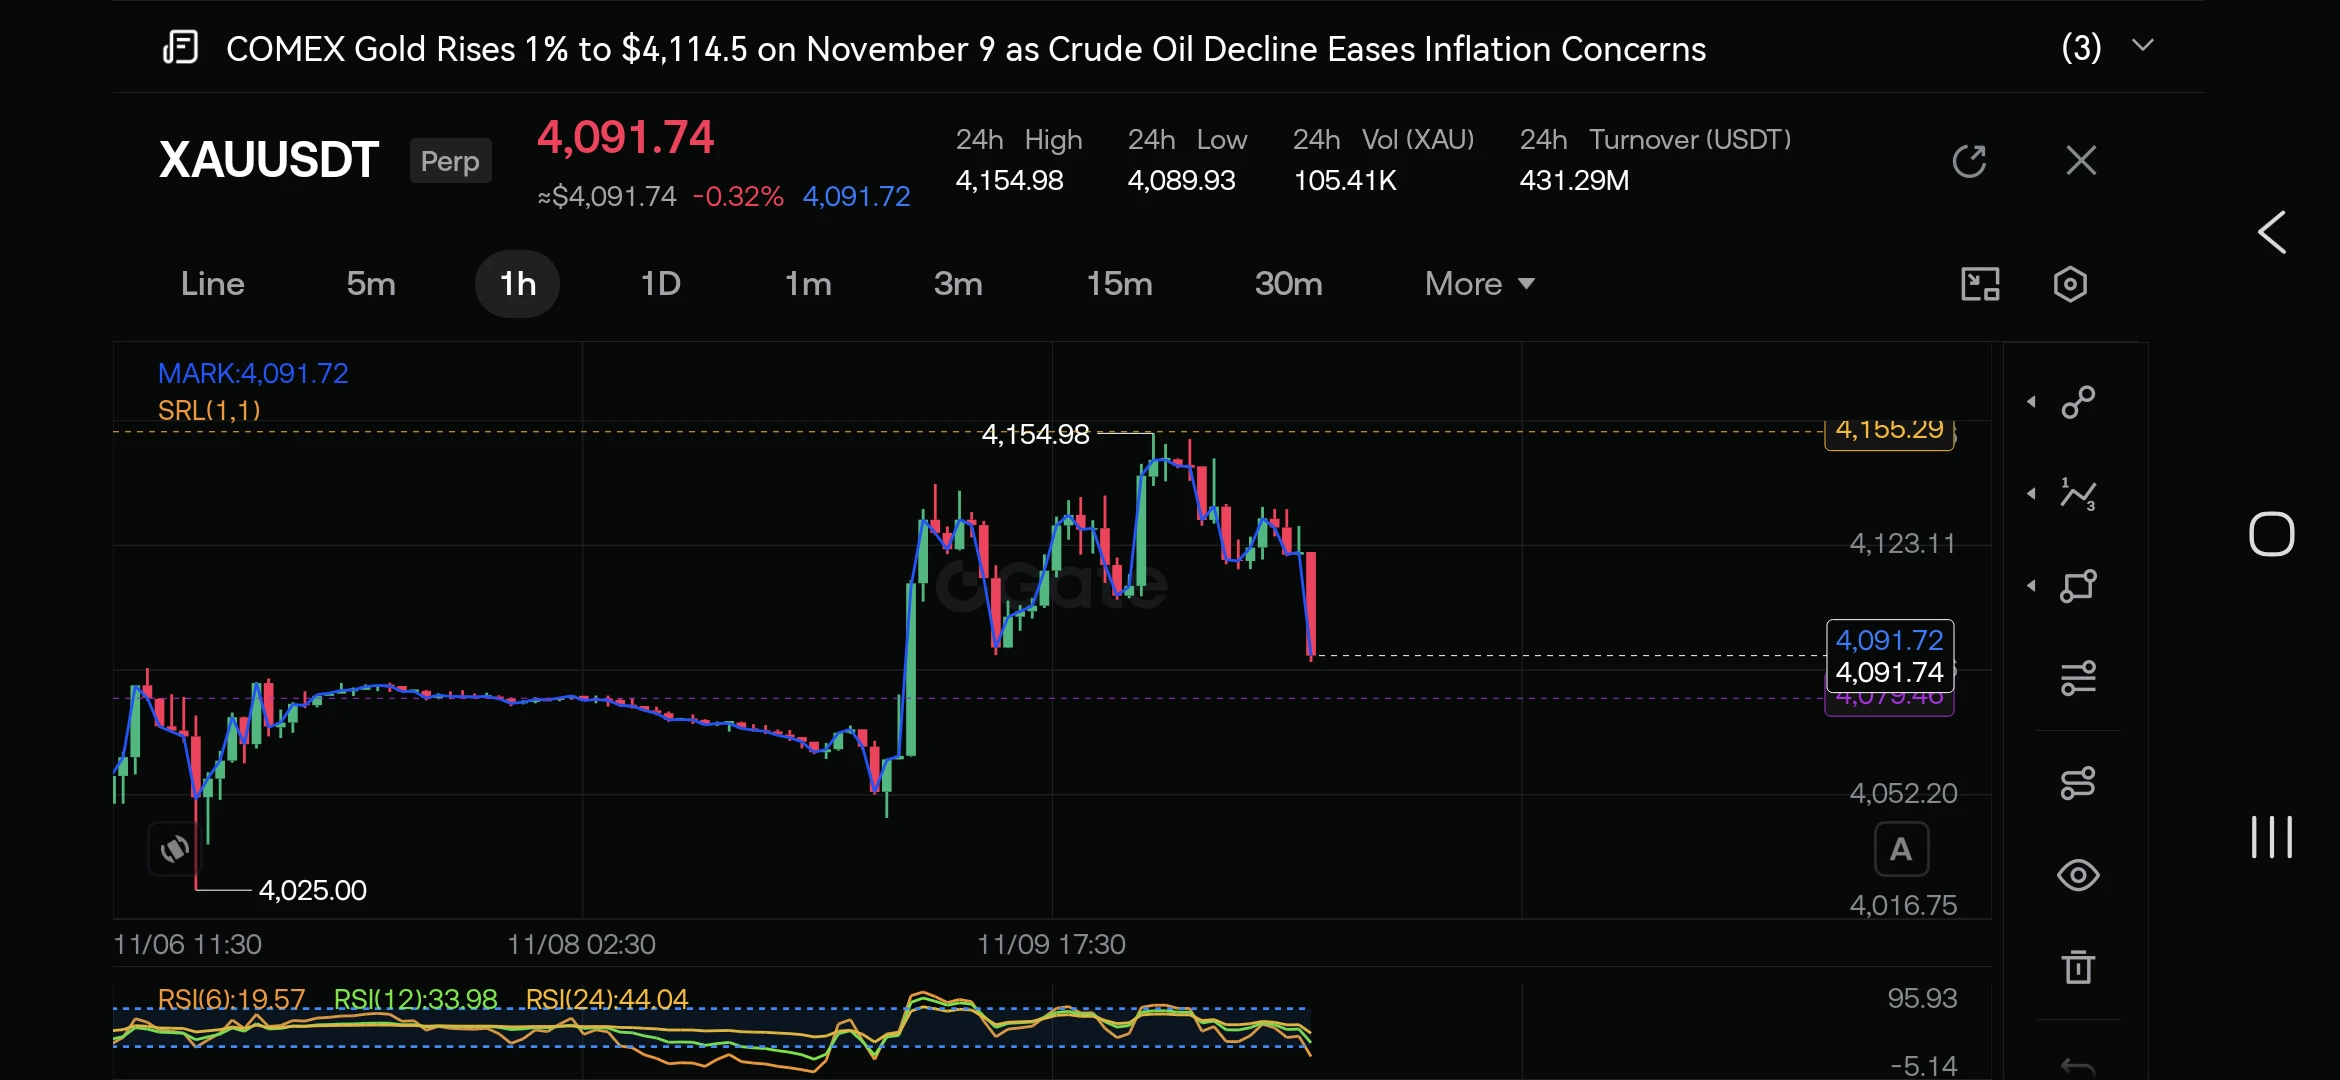
$XAUUSDT Technical Analysis: Critical Support Test Underway
​Gold perpetual contracts ($XAUUSDT) are currently undergoing an aggressive intraday pullback after failing to maintain bullish momentum near the recent session high of $4,154.98. The pair has dropped sharply to trade around $4,091.74, retesting its 24-hour low at $4,089.93.
​Key Technical Levels & Indicators:
​Immediate Support ($4,085 – $4,090): Price action is resting directly on a local horizontal demand pivot. A confirmed break below $4,089 opens downside risk toward the next structural support zone around $4,
post-image
  • 2
Trenches
PIEVERSE
P
bade
b
PIEVERSE
0x0e...25a9
Market Cap
$.
Change
.
24h Vol
$.
Holders
.
牛逼
牛
bade
b
牛逼
0x96...7777
Market Cap
$.
Change
.
24h Vol
$.
Holders
.
ON
O
bade
b
ON
0x0e...1d48
Market Cap
$.
Change
.
24h Vol
$.
Holders
.
STONK
S
bade
b
STONK
6GmA...UNgx
Market Cap
$
Change
.
24h Vol
$.
Holders
.
FLOAT
F
bade
b
FLOAT
Bv1a...BMmr
Market Cap
$.
Change
.
24h Vol
$.
Holders
.
What Is a False Breakout? Why Might Prices Quickly Reverse After Breaking Through a Key Level?

In cryptocurrency trading, when BTC suddenly falls after breaking through resistance, or quickly rebounds after breaking below support, these movements may be related to false breakouts. A false breakout can lead traders to mistakenly believe a trend has formed, causing them to enter at the wrong level. Therefore, understanding how false breakouts form and how to identify them is an important part of managing trading risk.

First, what is a false breakout?

A false breakout occurs when the price bri
post-image
BTC-0.67%
@ warns iPhone users!
An iOS flaw called "worse_query" could expose your seed phrases and private keys to malicious apps.
Delete untrusted apps and update your iOS immediately. Stay safe!
What Is a Classification Threshold? Why Can Changing a Probability Cutoff Alter an Entire Trading Strategy’s Returns and Risk?

In crypto quantitative trading, a machine learning model might predict a 65% probability that BTC will rise in the next period. But should a trader buy immediately? The answer depends on the classification threshold set by the strategy. A classification threshold is the cutoff that converts the probability output by a model into an actual trading signal. It affects the number of signals, the rate of false predictions, and the final trading results.

First, what is a c
post-image
BTC-0.67%
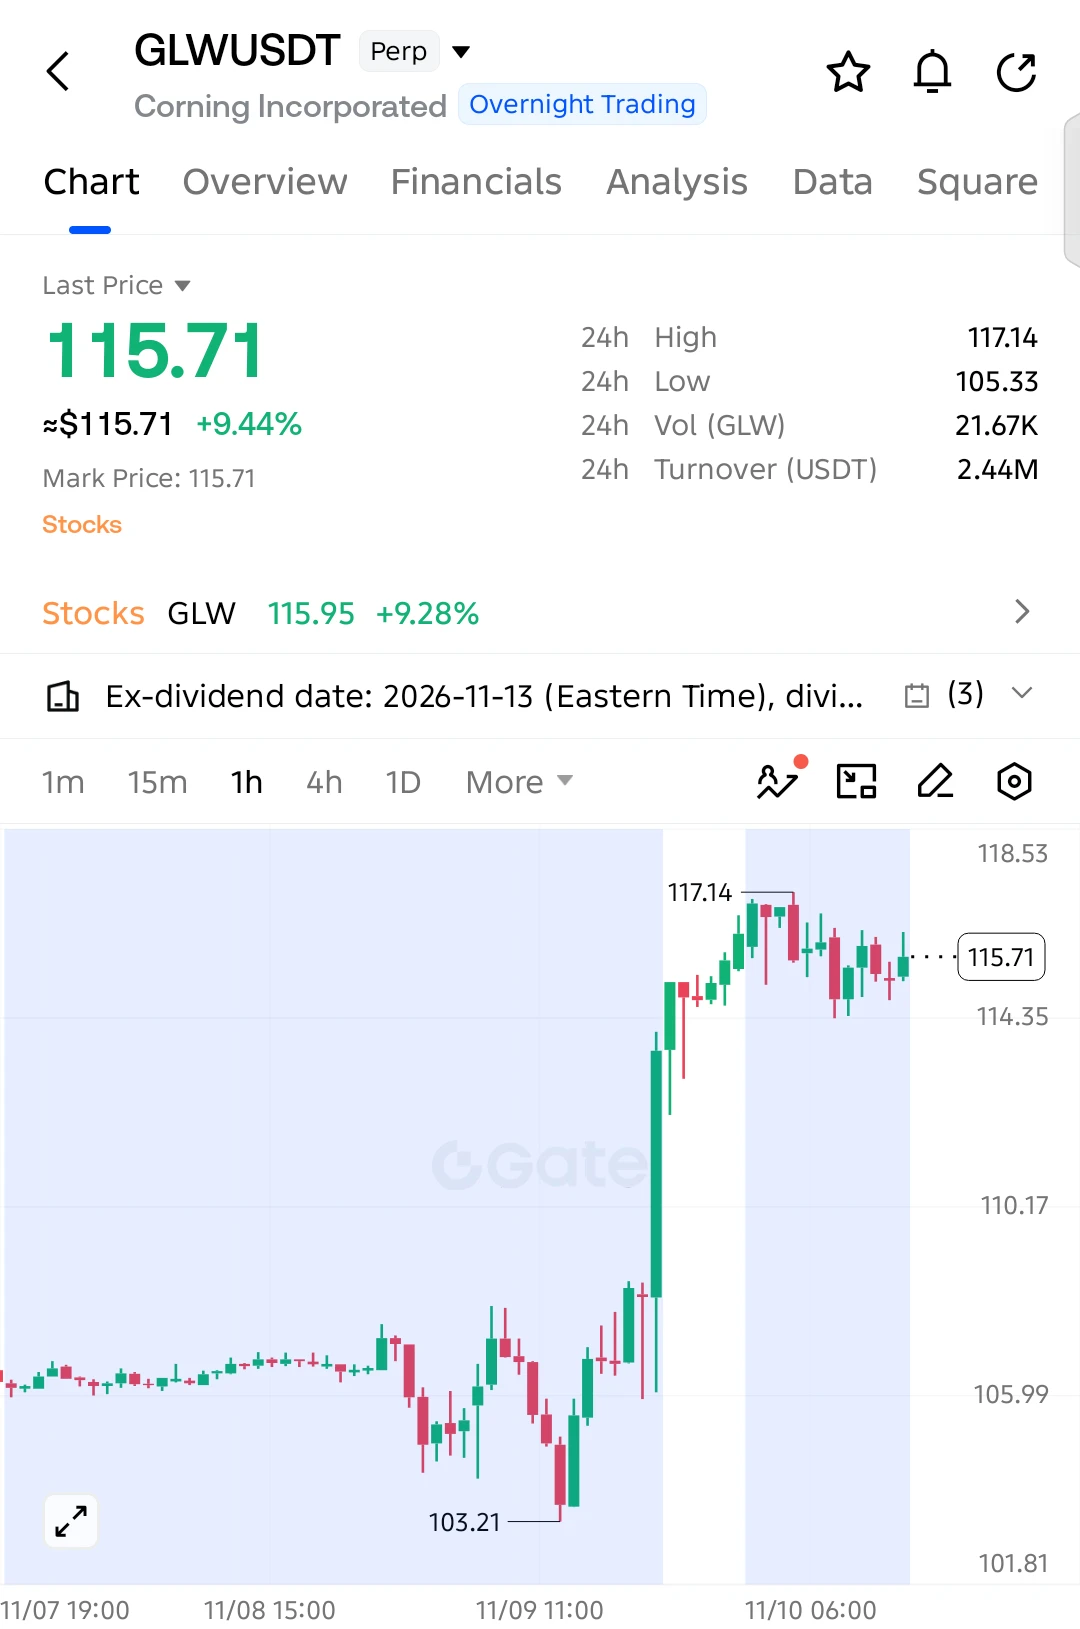
$GLW LONG SETUP — BULLS HOLDING STRONG!

$GLW is showing impressive strength after a powerful breakout. Price is consolidating near its recent highs, suggesting buyers are still in control.

Entry: 115.71
SL: 114.20

TP1: 116.50
TP2: 117.14
TP3: 118.50
Final Target: 120.00

The strong rally from 103.21 has pushed $GLW into a higher trading range. Buyers are defending the 114.35 support area, and a breakout above 117.14 could open the door for another bullish expansion.

Invalidation: Sustained breakdown below 114.20.

$GLW could be preparing for its next leg higher!
post-image
GLW-0.02%
What Is Class Imbalance? Why Can Cryptocurrency Prediction Models Look Accurate Yet Have No Trading Value?

In cryptocurrency quantitative trading, a model’s accuracy can easily be misleading. If most periods in the test data do not feature a strong upward move as defined, a model that always predicts “no rise” may still achieve high accuracy, yet fail to identify real trading opportunities. This is the problem caused by class imbalance.

First, what is class imbalance?

Class imbalance occurs when the number of samples in different classes varies greatly in a dataset. For example, only 100 of
post-image
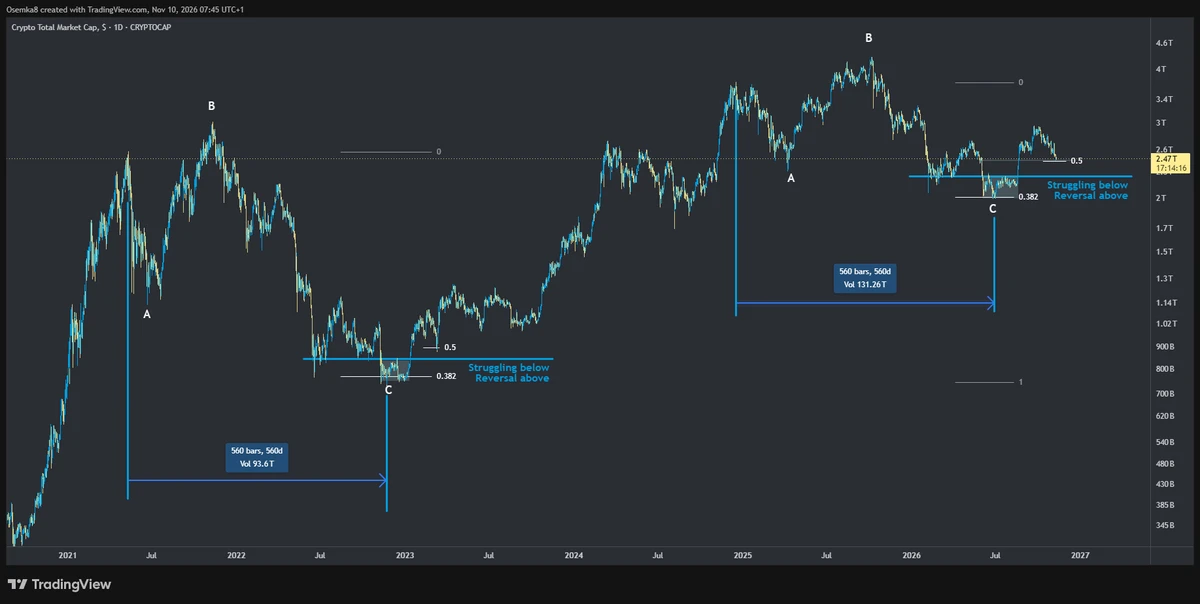
$TOTAL crypto MC keeps doing what it has done from 2021 to 2023, with EXACT time to the day from the top to the absolute bottom.
Now retracing to the same Fib level, while 0.382 was also the level where it bottomed.
post-image
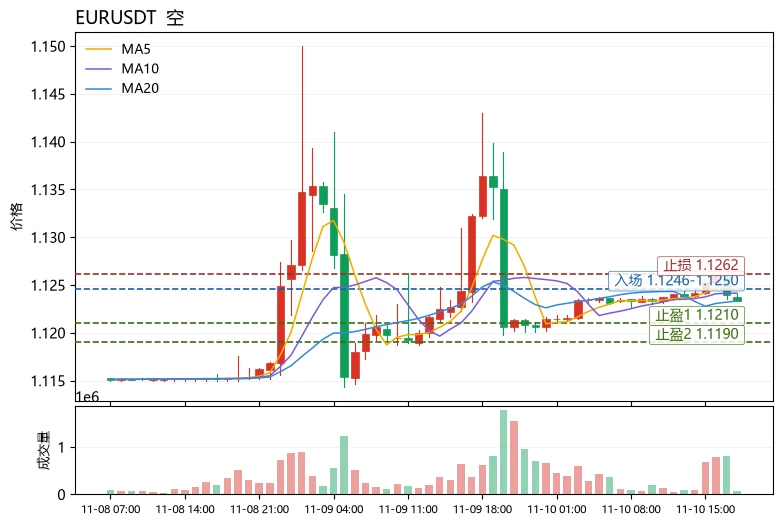
The most unusual detail in today's market is that $EUR 's MA5 (1.12464) is still above its MA20 (1.12333), yet the price has fallen to 1.1233, down 1.38% over 24h. The moving averages have not yet formed a death cross, but the price has already lost the MA20—a typical case of “structure lagging behind price,” with the bullish structure passively breaking down. The MACD histogram remains bearish at -7.58e-06, RSI is only 49.0 with no oversold cushion, and the Bollinger Bands have narrowed to [1.12075, 1.12592], with a range of about 2.08% over 30 candlesticks. After volatility compression, the
post-image
QNT+4.79%
NEAR+1.17%
(new streamer )market updates
live-cover
LIVE2,180
Once the value of $PI Pi is determined, its price will jump straight to that level, leaving you no chance to buy in gradually, because Pi is meant for spending, not speculation
post-image
PI-0.60%
  • 3
🏆 Gate ranks among the world's top three—giveaway time! 🎁
According to DeFiLlama (November 9), Gate ranked No. 3 among global CEXs, with a 24-hour net inflow of $40.66 million.
Let's celebrate together 💙
🎁 3 winners × 5 USDT
Join now 👇
✅ Follow @Gate_Livezh and @Gate__Live
❤️ Like + repost
💬 What's a recent win you're proud of? Share below! 🏆
📊 Source:

‍#GateLive #Gate
SpicyHandCoins
🏆 Gate breaks into the global top three—giveaway time! 🎁
According to DeFiLlama (November 9), Gate ranked 3rd among global CEXs, with a 24-hour net inflow of $40.66 million.
Let’s celebrate together 💙
🎁 3 winners × 5 USDT
Join now 👇
✅ Follow @Gate_Livezh and @Gate__Live
❤️ Like + repost
💬 What’s a recent win you’re proud of? Share it below! 🏆
📊 Source:

‍#GateLive #Gate
repost-content-media
$LTC ‌
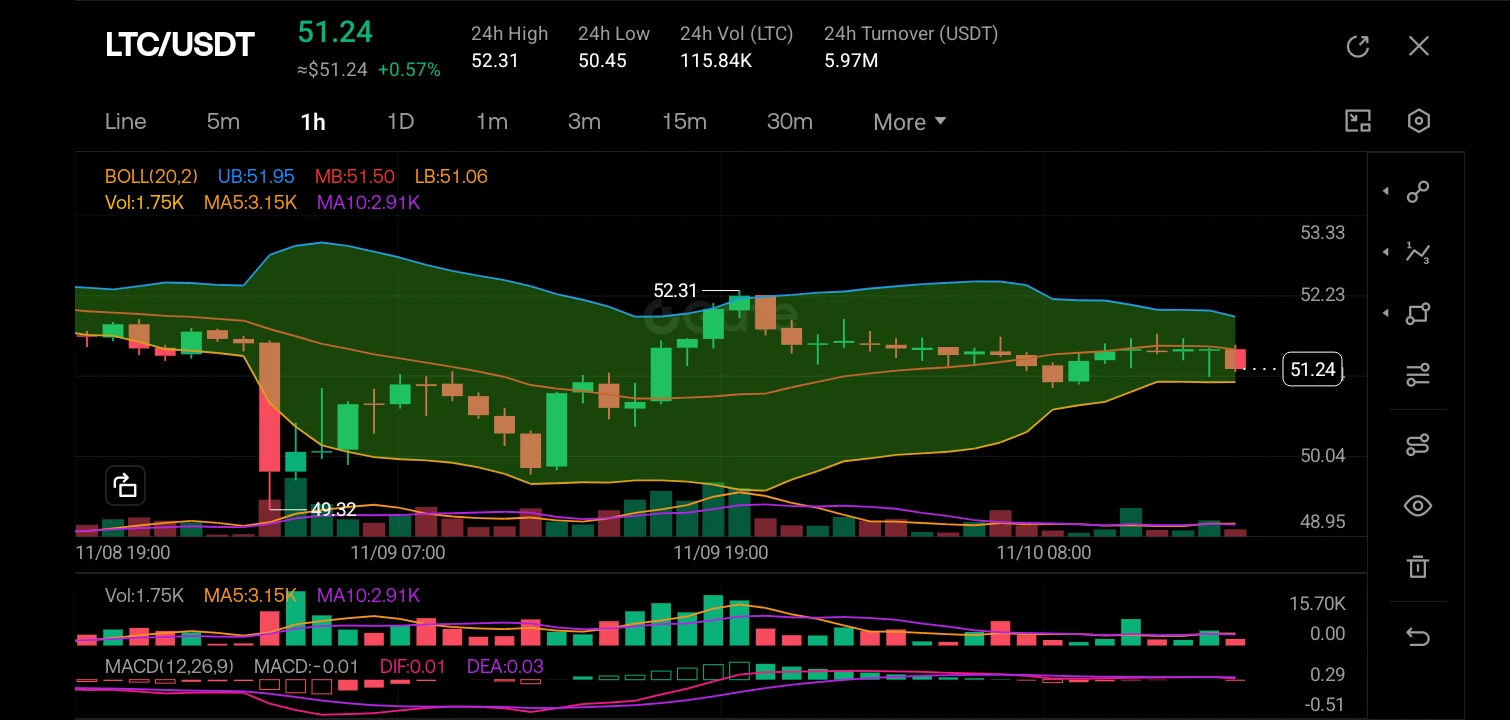
The market structure has transitioned from a sharp bearish breakdown to a steady bullish recovery and consolidation phase. After bottoming out at 49.32, the price has established a higher low structure and is currently compressing near the 51.24 level, indicating a shift in market control from sellers to buyers.

The K-lines show a strong upward impulse followed by a period of sideways consolidation. The price is currently trading right at the Middle Bollinger Band (MB) of 51.50, acting as immediate pivot support. The Bollinger Bands are relatively tight, suggesting low volatility and
post-image
LTC-0.07%
  • 1
#GateStockTalkSeason #WCTCS9
Gate Square Stock Talk: NVDA vs AMD – AI Leaders After the Selloff

Market Overview
AI and semiconductor stocks faced a sharp correction last week. The Philadelphia Semiconductor Index dropped over 11% in one stretch, with trillions in market value erased amid election-related worries about AI data-center buildout, rising yields, and broader risk-off sentiment. Nasdaq and S&P also posted notable weekly losses.
Recovery kicked in toward the end of the week and into Monday. Chip names bounced hard, SOX gained nearly 7% in a session, and many AI-linked names clawed b
NVDA-4.34%
AMD+13.35%
SPX+0.33%
  • 2
7R on XAUUSD today.
A good Tuesday 😊🫶
post-image
One blunt remark from the Fed chair sent all kinds of assets tumbling today.
Gold plunged 1.2%, silver slumped 2%, and Nasdaq futures weakened in response.
A few hours ago, Waller struck a hawkish tone in London, not only breaking the market’s ingrained expectations of easing but also laying out specific conditions for a rate hike:
Even if October’s CPI release tonight shows improvement, he still supports a 25-basis-point hike in December; and if core CPI rises 0.3% or more month over month, the Fed should consider going straight for a 50-basis-point hike, or risk undermining its credibility i
post-image
GLDX-0.40%
PAXG+0.37%
NAS100-0.07%
BTC-1.31%
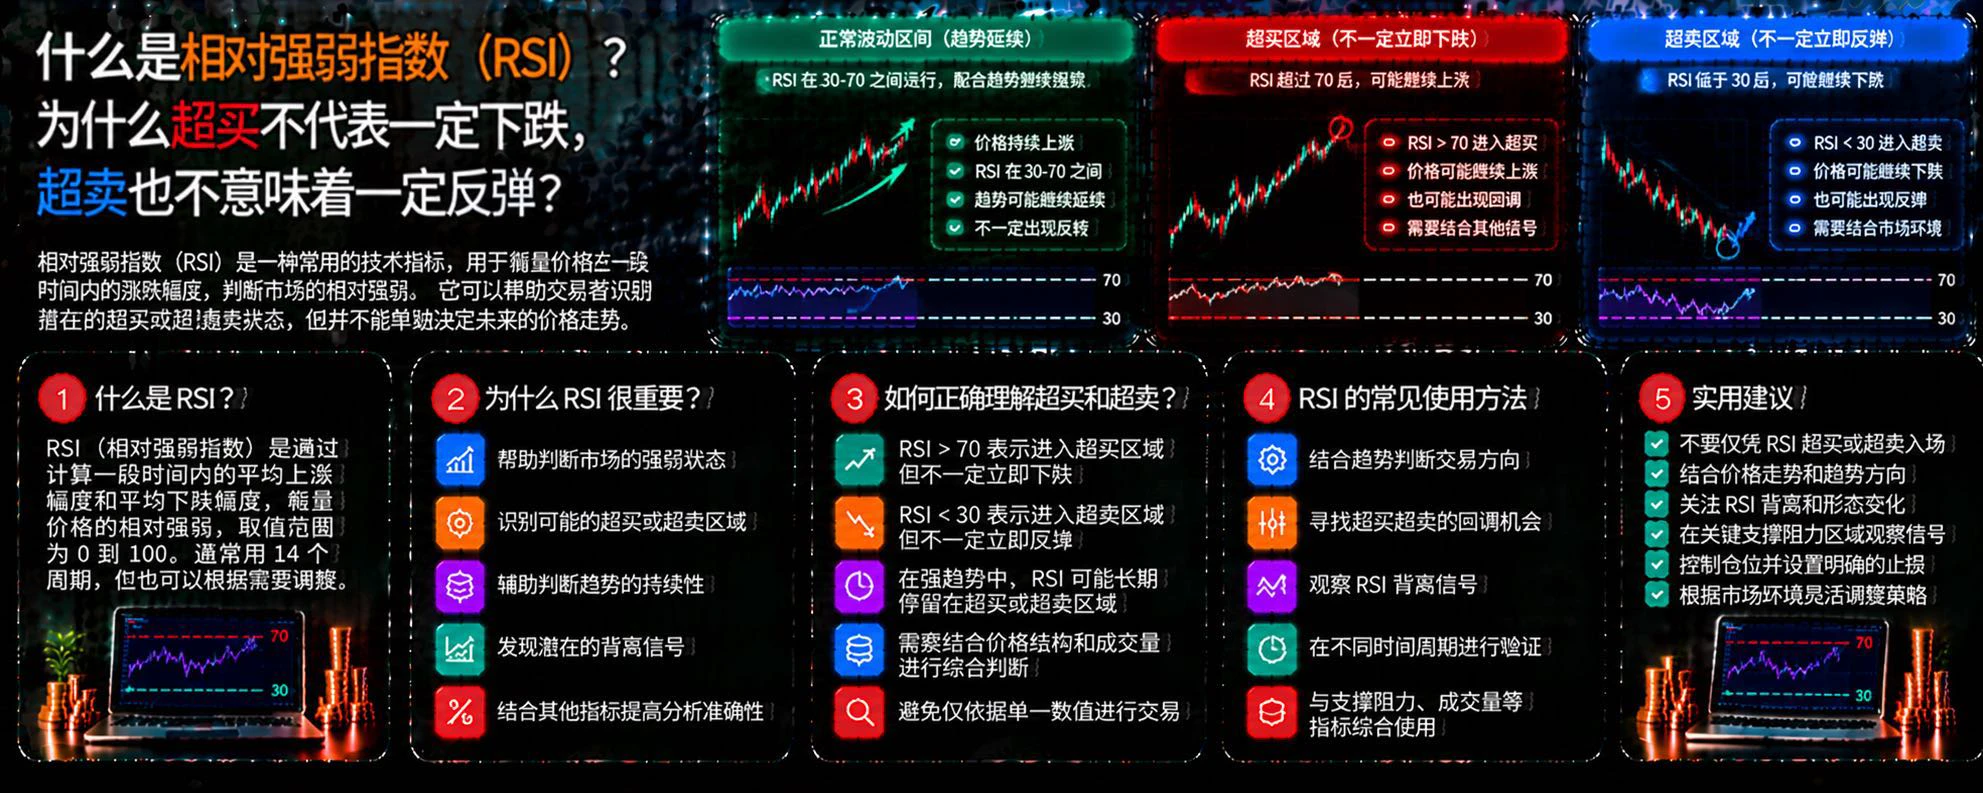
What Is the RSI Indicator? How Can the Relative Strength Index Identify Market Momentum and Potential Overbought or Oversold Zones?

In crypto trading, BTC may suddenly pull back after rising for several consecutive sessions, or rebound after a sustained decline. The RSI (Relative Strength Index) is a common momentum indicator that can help traders observe the relative strength of recent price gains and losses, but it cannot accurately predict every market reversal.

First, what is RSI?

RSI typically ranges from 0 to 100, with 14 periods being a common setting. The indicator reflects recent p
post-image
BTC-0.67%
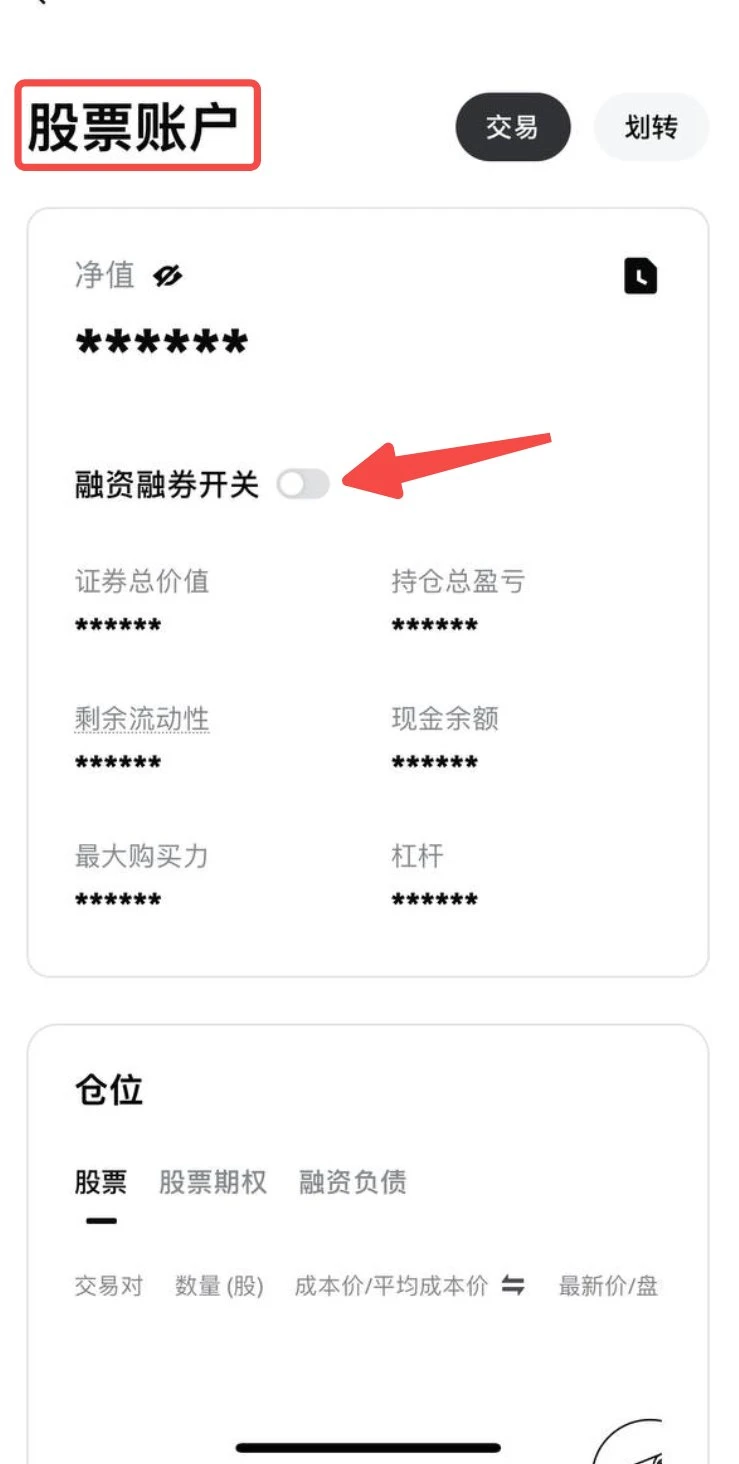
Several clients have asked recently: “Can I short U.S. stocks?” “Is there a way to trade when Hong Kong stocks pull back?”

Now we can finally answer: Yes!

Gate Stock margin trading is officially live. You can go long and short with just one account, covering U.S., Hong Kong, Japanese, and Korean stocks. You can view your financing limit, borrowing costs, and margin ratios all on one page.

A question for everyone: Would you try margin trading to go long first, or short selling?🤔
🔗 https://gate.com/announcements/article/102638
‍#融资融券
post-image
Load More

Join 40 M users in our growing community

⚡️ Join 40 M users in the crypto craze discussion

💬 Engage with your favorite top creators

👍 See what interests you

Trending Topics

GateGlobalComplianceExpansion

167 Views201 Discussing

Gate continues to expand its global compliance footprint, now covering 81 regulated jurisdictions across Europe, North America, Asia, and Oceania. From MiCA and U.S. state-level MTLs to Japan’s FSA, Dubai, and Australia-related regulatory approvals, global exchanges are entering a new stage of compliance competition. Do you think regulatory strength will become as important as products and liquidity for exchanges in the future?

USCPIDataIncoming

55.02k Views2.29k Discussing

USIranTalksShowNewProgress

10.06k Views1.29k Discussing

View More