Square
Following
Hot
News
Notifications
Profile
Share your thoughts
placeholder
Article
this is almost worse than callouts
post-image
Oversold rebound
11.9 $BTC $ETH | Morning market review
Short the rebound
BTC: Currently back around 75,300. This is a typical “V-shaped recovery after a sharp drop,” but the rebound has already hit short-term moving average resistance

ETH: Weaker price action, plunging from 2,247 to a low of 2,079 before rebounding to 2,153. The rebound was smaller than BTC’s, and the candlestick has an upper shadow, indicating clear selling pressure overhead

Short-term trading strategy: Short
BTC: Watch around 76,100; if momentum stalls, consider a small position
ETH: Watch around 2,200; if momentum stal
BTC-0.67%
ETH-1.23%
Trenches
ZIG
Z
bade
b
ZIG
0x8c...1145
Market Cap
$.
Change
.
24h Vol
$.
Holders
.
BTC
B
bade
b
BTC
C5xp...pump
Market Cap
$.
Change
.
24h Vol
$.
Holders
.
STONK
S
bade
b
STONK
6GmA...UNgx
Market Cap
$.
Change
.
24h Vol
$.
Holders
.
牛逼
牛
bade
b
牛逼
0x96...7777
Market Cap
$.
Change
.
24h Vol
$.
Holders
.
ANSEM
A
bade
b
ANSEM
9cRC...pump
Market Cap
$.
Change
.
24h Vol
$.
Holders
.
How can you tell whether a trading strategy truly has an edge, rather than simply benefiting from a favorable market?

If a trading strategy has made money consistently over the past few months, does that mean it has a real edge?

Not necessarily.

It may have genuinely identified a market pattern, or it may simply be suited to a particular market phase; it may have real profit potential, or its backtest parameters may just be overfitted to historical data.

The real challenge is not finding a beautiful equity curve, but determining whether the edge behind it can withstand scrutiny.

I. Start
post-image
The 5 mistakes investors are most likely to make after a crash—have you made any of them?

After a sharp market downturn, what truly tests investors is often not their analytical ability, but their ability to make decisions in the face of panic. Many people have solid investment plans, but one bout of extreme volatility can lead them to do the exact opposite.

The following five mistakes are especially worth watching out for.

First, blindly buying the dip. Seeing BTC fall continuously, they assume the price is already cheap enough. But a steep decline does not mean the market has bottomed out
post-image
BTC-0.65%
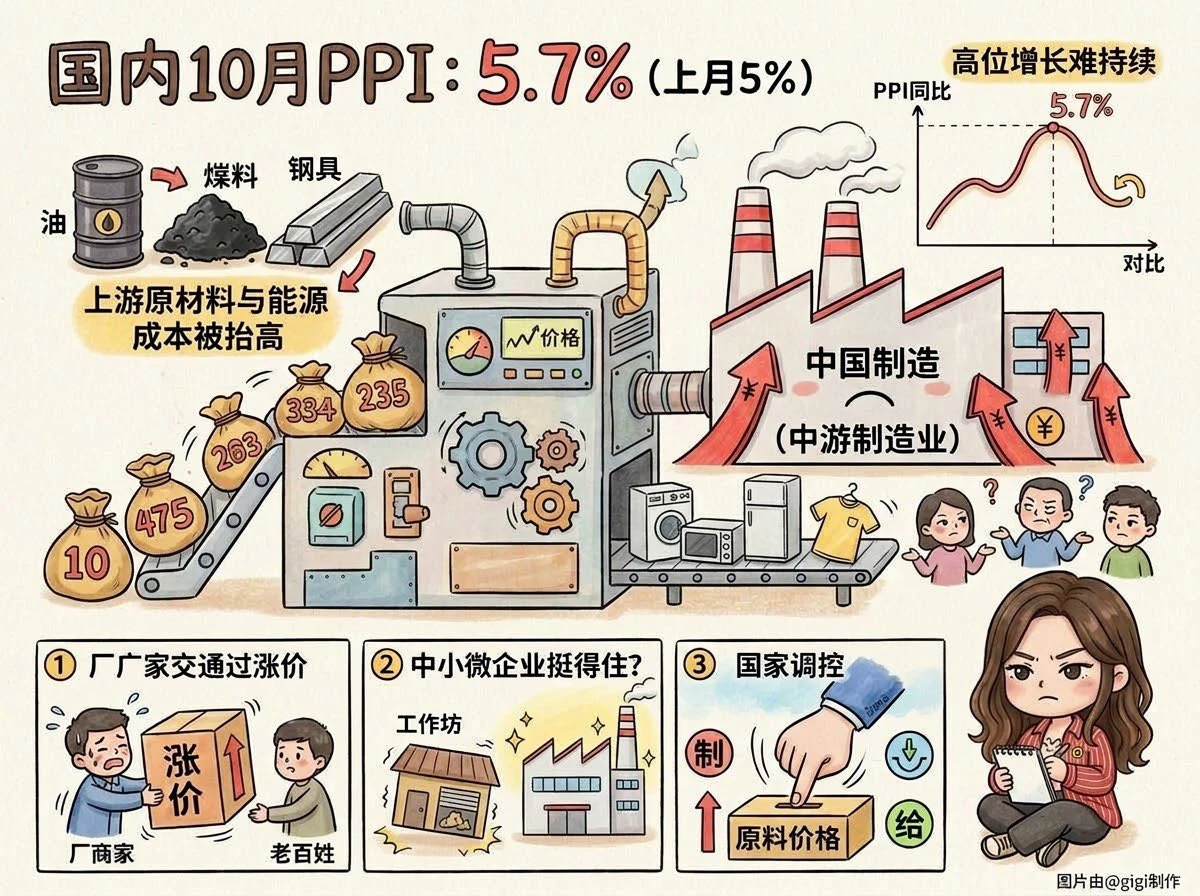
The just-released domestic October PPI data surged to 5.7% year over year, up further from 5% last month
Many people might initially think this means industry is recovering and companies are about to make big profits, but it’s really not that simple
Factory-gate prices were pushed sharply higher this time, mainly not because people are buying more, but because upstream raw material and energy costs were driven up
So what exactly should we keep a close eye on next?
First, whether higher raw material costs can be passed on to ordinary consumers
Upstream raw material prices have risen too much, b
post-image
Why Can Unrealized Profits Keep Increasing While Actual Risk May Be Rising?

Many traders start taking on more risk after making a profit.

A trade makes money, so they increase their position; the account posts consecutive gains, so they raise leverage; the market keeps rising, and they start to think they have figured out how it works.

But one easily overlooked fact is:

An increase in unrealized profits does not mean risk has decreased; the more you earn, the more it does not necessarily mean you can afford to lose.

I. Why Is It Easy to Relax Risk Controls After Making a Profit?

1. Overc
post-image
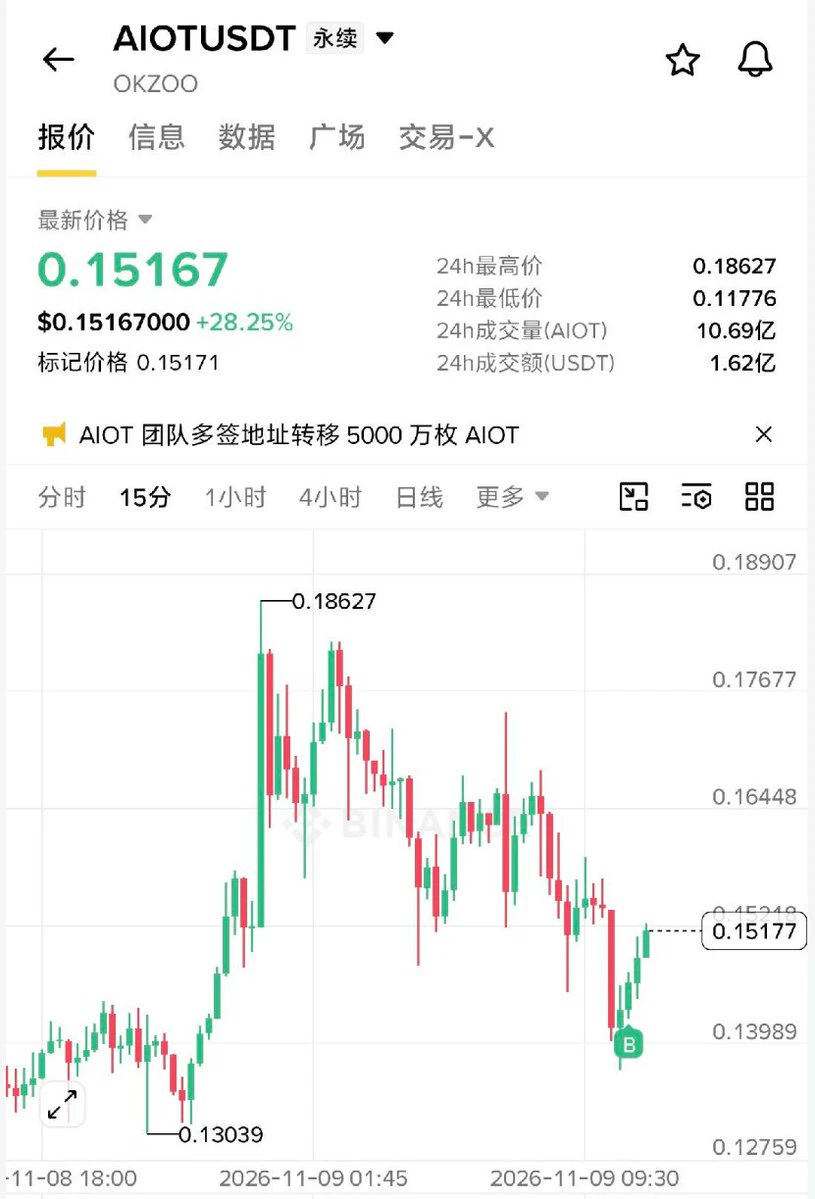
Just went long on $AIOT at 0.1436
Let’s see if it can become a monster coin
post-image
AIOT-2.28%
That comment feels so familiar—no wonder, they share the same roots.
post-image
🎁 Final 3 days! The prize pool has been replenished, and more great prizes are waiting to be won!
The Gate Live livestream raffle carnival is entering its final countdown! Today's prize pool has been replenished, with exciting rewards including iPhone DUO, GT, USDT, futures trial vouchers, and Gate merchandise waiting to be won!
Get 1 raffle entry for every 80 Heat Points! Complete tasks and watch livestreams now to accumulate Heat Points and climb the leaderboard!

🏆 Current Heat Points TOP 10
***Fenban
***yak
***Meisiyu
***Mei Da Kongtou
***a9527
***O
***555
***Cai7268
***OSHI NAKAMATO
***
post-image
GT-2.41%
  • 10
  • 2
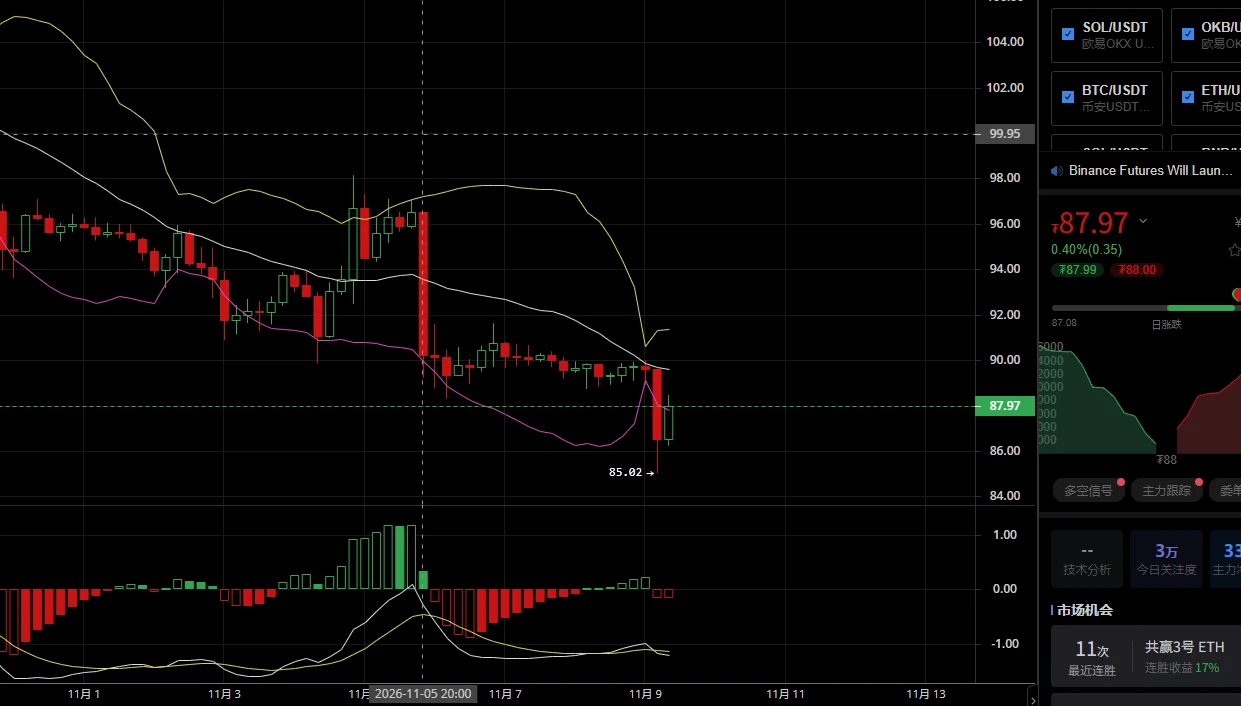
11.9 SOL Trading Strategy
Market Analysis

The K-line chart shows SOL recently dropping sharply, with a low of **85.02** forming a long lower wick. This indicates a short-term sharp decline that released selling pressure. The current price is 87.97, with a slight recovery after the pullback. Support from the lower Bollinger Band is emerging, and the indicators below show signs of bullish divergence. Bearish momentum is weakening, creating an opportunity for a rebound.

Entry Zone

Preferably wait for a pullback to the 86.80–87.20 range and enter long in batches;
Aggressive approach: Open a
post-image
SOL-0.74%
Top Crypto Rewards: Invite Friends to Trade Futures and Win a Share of $50,000 in BTC and ETH https://www.gate.com/campaigns/6917?ch=9497&ref_type=132&utm_cmp=0UCtzoY1
post-image
BTC-0.65%
ETH-1.23%
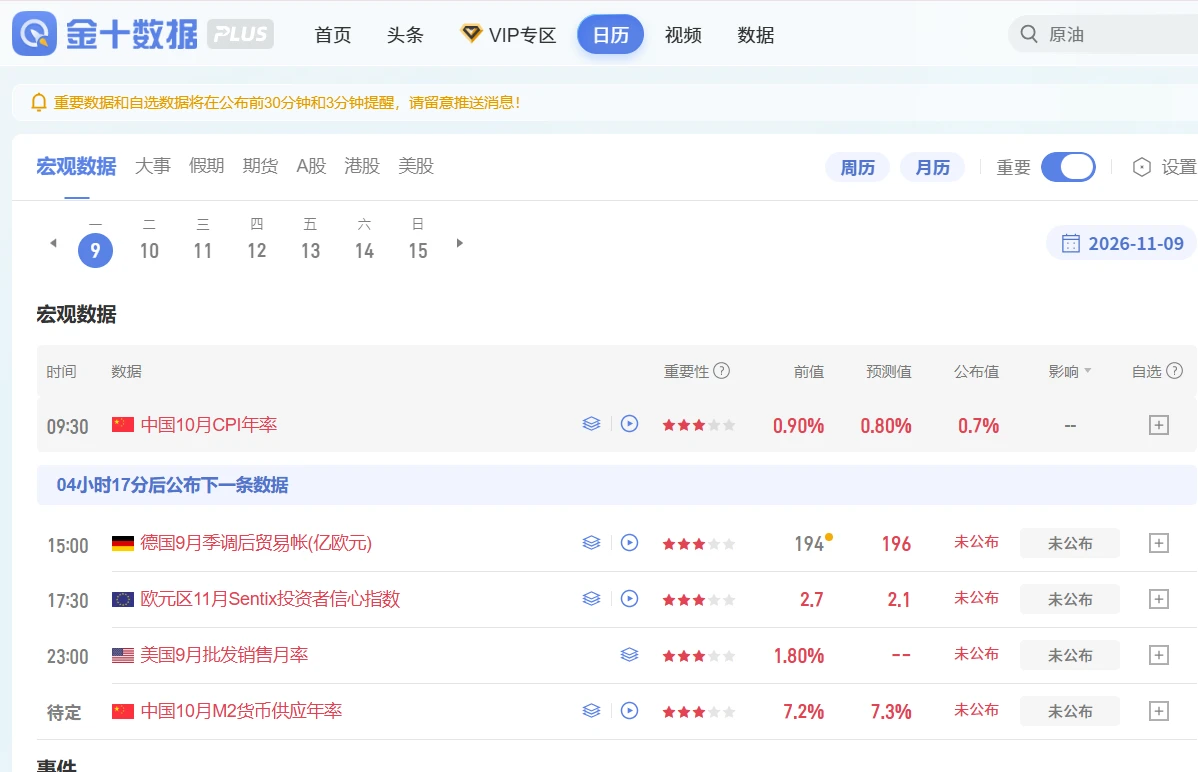
Key financial data & meetings this week (11.9–11.15)

Core theme: U.S. inflation data (CPI/PPI) will directly determine expectations for a Fed rate hike in December, affecting Treasuries, the dollar, gold, and crypto assets.

Monday 11.9

📷China: October CPI and PPI (National Bureau of Statistics); watch the strength of domestic inflation
📷Overseas: Bank of England Governor Bailey speaks; ECB officials speak

Tuesday 11.10【Highest priority this week!】

📷U.S. October CPI (including core CPI), released in the evening Beijing time

Significance: Payroll data has already shown sticky wages. If
post-image
GLDX-0.40%
PAXG+0.37%
XAU+0.38%
BTC-0.67%
🔹AI Stocks Plunge, but Tech Giants Say Demand Hasn’t Disappeared! Is This AI Sell-Off an Overreacti
live-cover
LIVE1,384
Checking in for week 77. Lost 10,000 this week; toward the 1.5 million target (50+100 plan): -287,000 in market value -200,000 withdrawn +200,000 deposited = 1.213 million.
A Face of Wealth and Status and Romantic Misfortune: The Conflict Between Desire and Human Nature

In traditional face reading, a “wealthy and noble” appearance
is said to feature a full forehead (wisdom and vision),
a rounded nose tip (abundant wealth),
prominent cheekbones (power and command),
and a sturdy chin (a solid foundation in later life).
NVIDIA CEO Jensen Huang has long been regarded as a classic example.
In particular, his “wealth nose” (a full nose tip and fleshy nostrils)
symbolizes the ability to accumulate wealth and command resources.
Yet face reading concerns not only wealth
post-image
NVDA investors are losing sleep! Jensen Huang faces an independent investigation—could Nvidia see its valuation reassessed?

What was the biggest part of Nvidia's investment thesis? AI demand keeps growing, GPUs are in short supply, the CUDA ecosystem creates a competitive moat, and Jensen Huang is leading the company to continually expand its market advantage.
But now, a new variable has suddenly entered this investment thesis: management risk.
After Jensen Huang acknowledged personal marital issues, Nvidia's board announced an independent investigation, focusing on whether he had ever been t
NVDA+2.80%
  • 15
$CL Crude oil has also broken out of a consolidation range at this level. Try going long
post-image
CL-1.83%
Zec market update
live-cover
LIVE1,897
The overall trend is currently volatile. I entered long positions twice in the early morning. The first, around 6:00, near 2,110 and 74,200, rallied to around 2,167 and 75,700. Then, during the daily and weekly closes at 8:00, I entered longs again near 2,120 and 74,500. After the market pulled back, it rebounded to around 2,155 and 75,500. Both long trades once again captured a good move.

P.S. Every trade in the livestream and strategy includes a stop-loss. I also repeatedly emphasized during the livestream that you must strictly manage your position size and set your stop-loss when trading.
BTC-0.67%
  • 2
Load More

Join 40 M users in our growing community

⚡️ Join 40 M users in the crypto craze discussion

💬 Engage with your favorite top creators

👍 See what interests you

Trending Topics

USCPIDataIncoming

22.8k Views1.73k Discussing

The U.S. October CPI report will be released on November 10 at 8:30 a.m. ET. September CPI came in at 3.7% year over year, and markets will be watching closely for signs that inflation is cooling, especially in core CPI. A softer-than-expected reading could strengthen rate-cut expectations, while hotter inflation may pressure risk assets through higher Treasury yields and a stronger dollar. How do you think this CPI print will move $BTC, U.S. stocks and gold?

RedBullDoublePodiumInBrazil

309.58k Views30.5k Discussing

BTCFlashCrash

22.73k Views66.06k Discussing
View More