Square
Following
Hot
News
Notifications
Profile
Share your thoughts
placeholder
Article
#btc #SOL #pi
Everything is fake; what’s real is fully enjoying my fruit 🍏 feast right now 😋
BTC-5.05%
SOL-0.77%
PI-10.71%
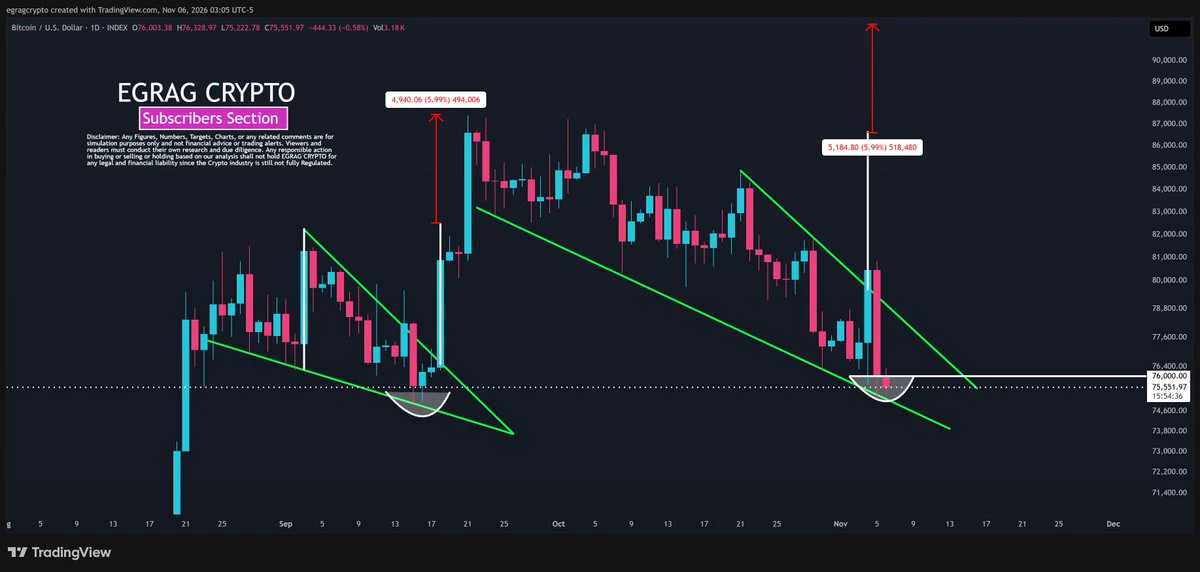
#BTC – $76,000 IS THE TRIGGER! $92,000 NEXT?:
The DAILY chart is showing a potential repeat of September's bullish reversal!
WHAT I'M WATCHING:
🔹 Descending channel approaching support.
🔹 Potential rounded bottom forming.
🔹 $76,000 - THE LINE IN THE SAND!
THE BREAKOUT SCENARIO:
A FULL-BODY DAILY CANDLE CLOSE ABOVE $76,000, followed by sustained strength, could trigger a move toward $92,000!
That's approximately +21% from $76K!
⚠️ A rejection below $76K keeps the bearish channel active. Losing the recent low near $75K would weaken the reversal setup.
MY TAKE: I DON'T NEED TO GUESS THE BOTTOM
post-image
BTC-0.67%
Trenches
BTC
B
bade
b
BTC
C5xp...pump
Market Cap
$.
Change
.
24h Vol
$.
Holders
.
ZIG
Z
bade
b
ZIG
0x8c...1145
Market Cap
$.
Change
.
24h Vol
$.
Holders
.
GM
G
bade
b
GM
0x13...7777
Market Cap
$.
Change
.
24h Vol
$.
Holders
.
STONK
S
bade
b
STONK
6GmA...UNgx
Market Cap
$.
Change
.
24h Vol
$.
Holders
.
DESSA
D
bade
b
DESSA
npz2...pump
Market Cap
$.
Change
.
24h Vol
$.
Holders
.
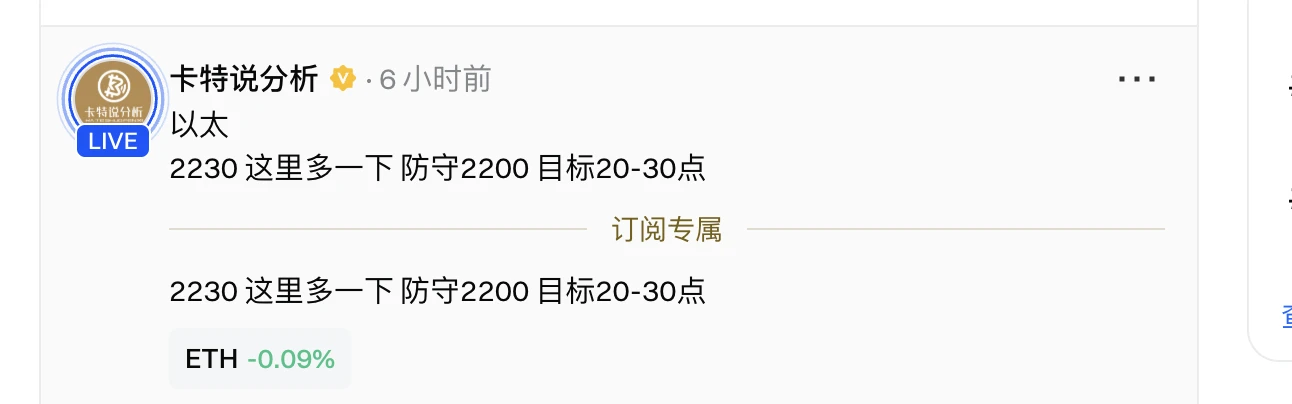
Finally took a bite above 2,230
post-image
  • 12
  • 2
market prices updates
live-cover
LIVE998
$ETC finally found support at 6.77. Is this really a rebound, or another trap before the drop? TP: 7.29SL: 6.73Market moves: $SOL : Current price 90.33 - 24-hour change: -6.47%$ICNT : Current price 0.2884 - 24-hour change: +27.78%
post-image
ETC-1.03%
SOL-0.77%
ICNT-10.32%
  • 1
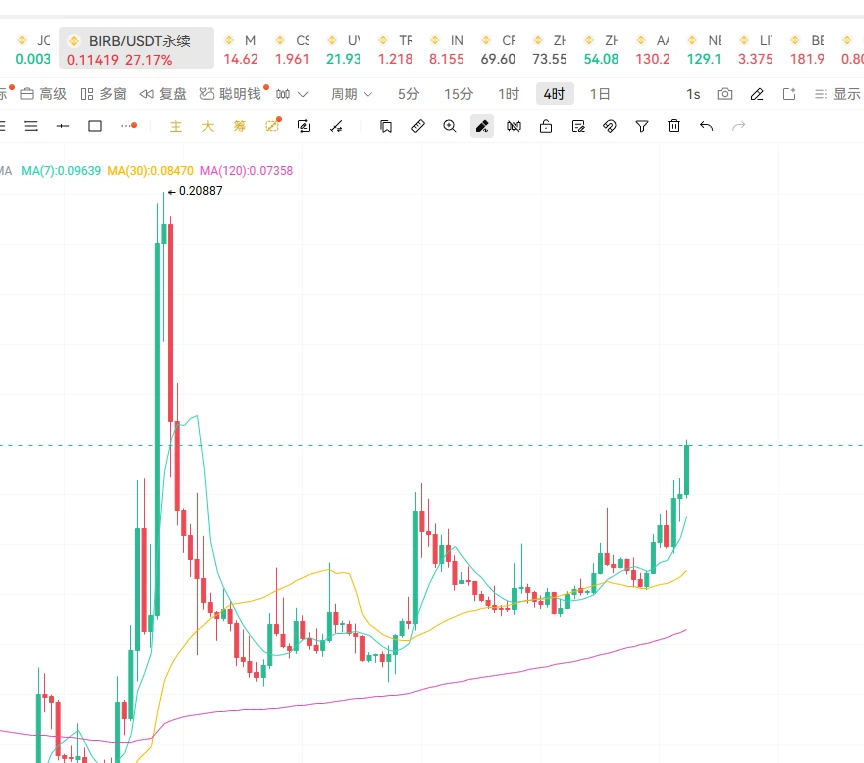
$BIRB K is really beautiful, I've bought in and am waiting for a massive pump!
post-image
BIRB-16.68%
#BTC
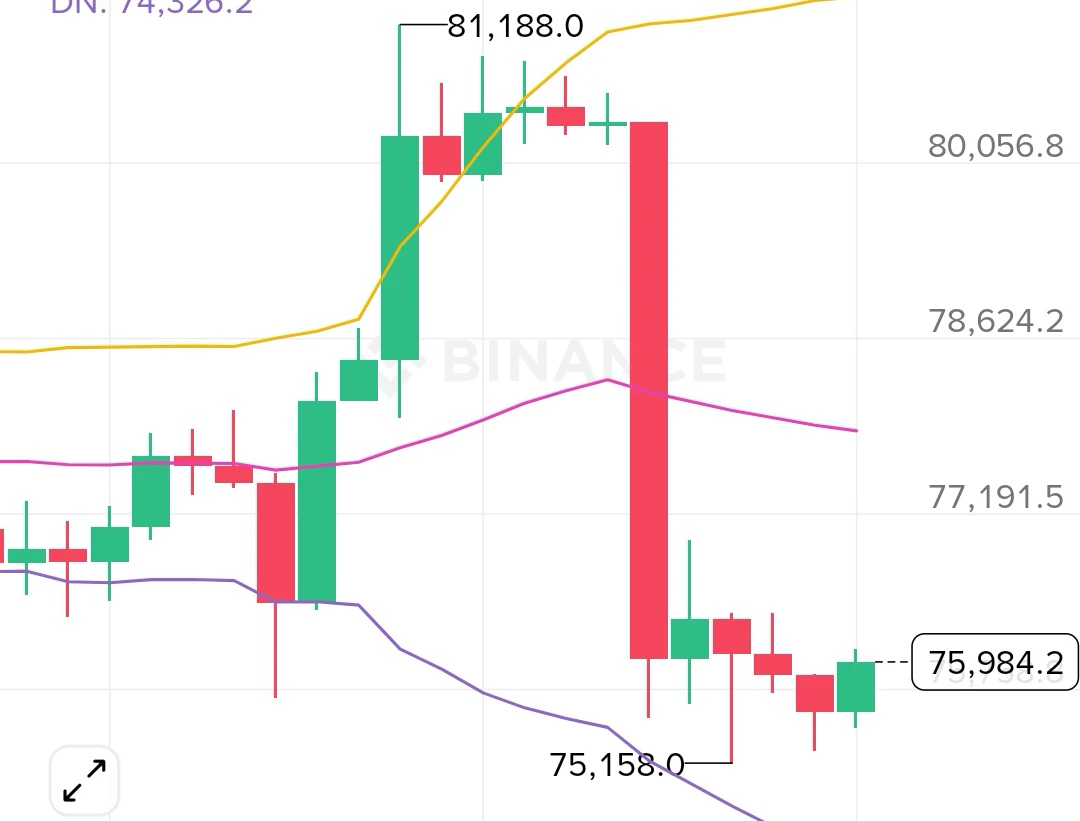
11.6 Bitcoin analysis
On the 4-hour chart, selling pressure has pushed price below the Bollinger middle band, with bears in control. KDJ indicates oversold conditions, so those looking to trade short-term can try to catch a small rebound. The first resistance above is 77800, with support below at 75158. If price fails to reclaim the middle band, the bias remains bearish, with further downside likely.
Trading suggestion:
Short in the 76500-7700 range, targeting further downside; stop-loss at 77800
post-image
BTC-0.67%
$BTC Brothers trapped in longs at 80K, stop now! Keep holding on and your positions will become “fuel” for the next batch of whales!

BTC is currently at 75650. Your 80000 long isn’t a matter of “just waiting for it to come back” anymore—it’s a matter of hesitating and getting carried out.

Over the past 24 hours, $331 million in positions were liquidated across the market, including $299 million in longs—the main casualties were bulls. Even whales can’t hold on: long whales are sitting on $79.42 million in unrealized losses, and short whales are also down $38.25 million. Think you’re the only
BTC-0.65%
  • 6
  • 1
🚢 IRAN-LINKED SHIPS SPOTTED NEAR CRITICAL UNDERSEA INTERNET CABLES!
• 4 Iran-linked ships reportedly spotted near cables in the Gulf of Oman.
• These cables carry internet traffic for Iraq, Kuwait, Bahrain & Qatar.
• Any damage could disrupt banking and digital services.
NO CABLE DAMAGE HAS BEEN CONFIRMED SO FAR.
🔥 What are we discussing today? Trending topics on Gate Square have been updated!

🔹 #Epic Sell-Off in U.S. Stocks
Tech stocks are facing a wave of heavy selling. Will this correction continue?
🔹 #October Nonfarm Payrolls in Focus
The nonfarm payrolls report is due tonight. Will it trigger a market rebound or further losses?
🔹 #Crypto Market Under Pressure
$BTC and $ETH are following global risk assets lower. Is now the time to buy the dip or keep waiting?

Quality content can receive a traffic boost + featured recommendations.
💰 Got a take? Join the discussion:
https://www.gate.com/post
post-image
BTC-0.67%
ETH-1.26%
Another legend has emerged
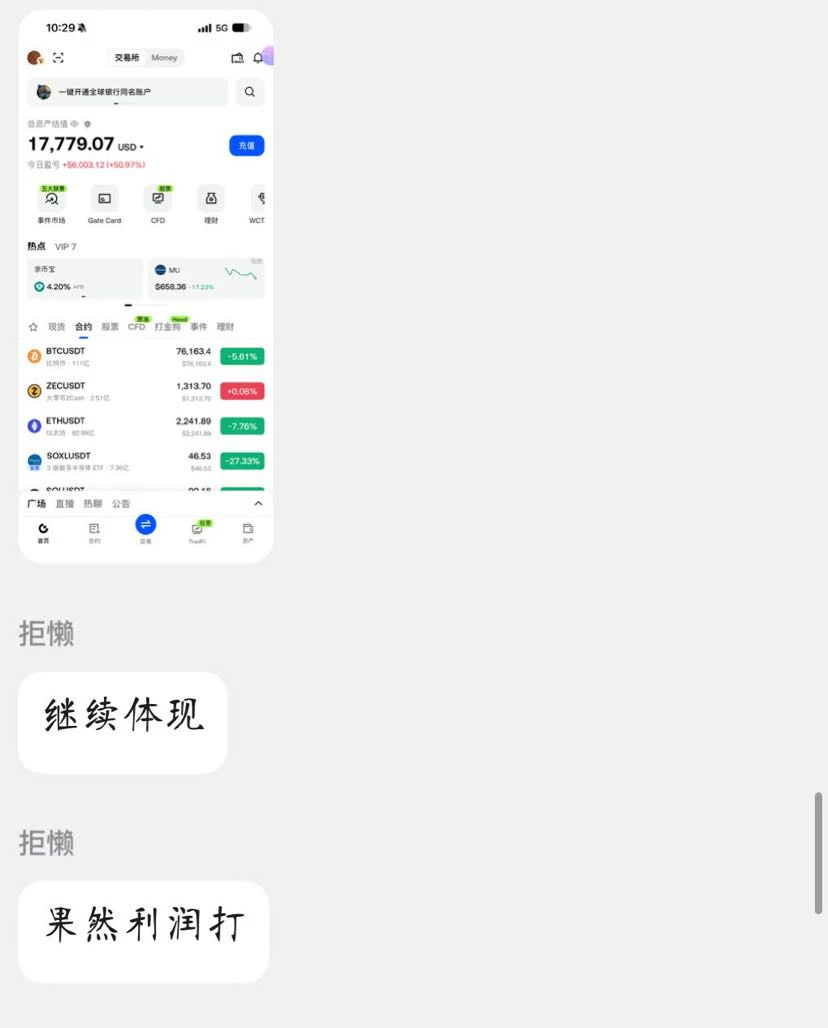
Made back 200,000 RMB in two days with 760u
With fewer than 100 days left in 2026, brothers, how much more do you need to break even…
post-image
  • 7
  • 1
The more I read about the government shutdown, the more confused I get. Trump flat-out said that “the people getting laid off are all Democrats,” then added that a shutdown could “get rid of things we don’t want.” This isn’t budget negotiations—it’s using federal employees as bargaining chips. If the government really shuts down, data releases will be delayed and economic readings will go dark, sending market sentiment straight into fear. Retail investors are the ones most likely to get caught in the crossfire when there’s an information vacuum. What do you think?
post-image
  • 7
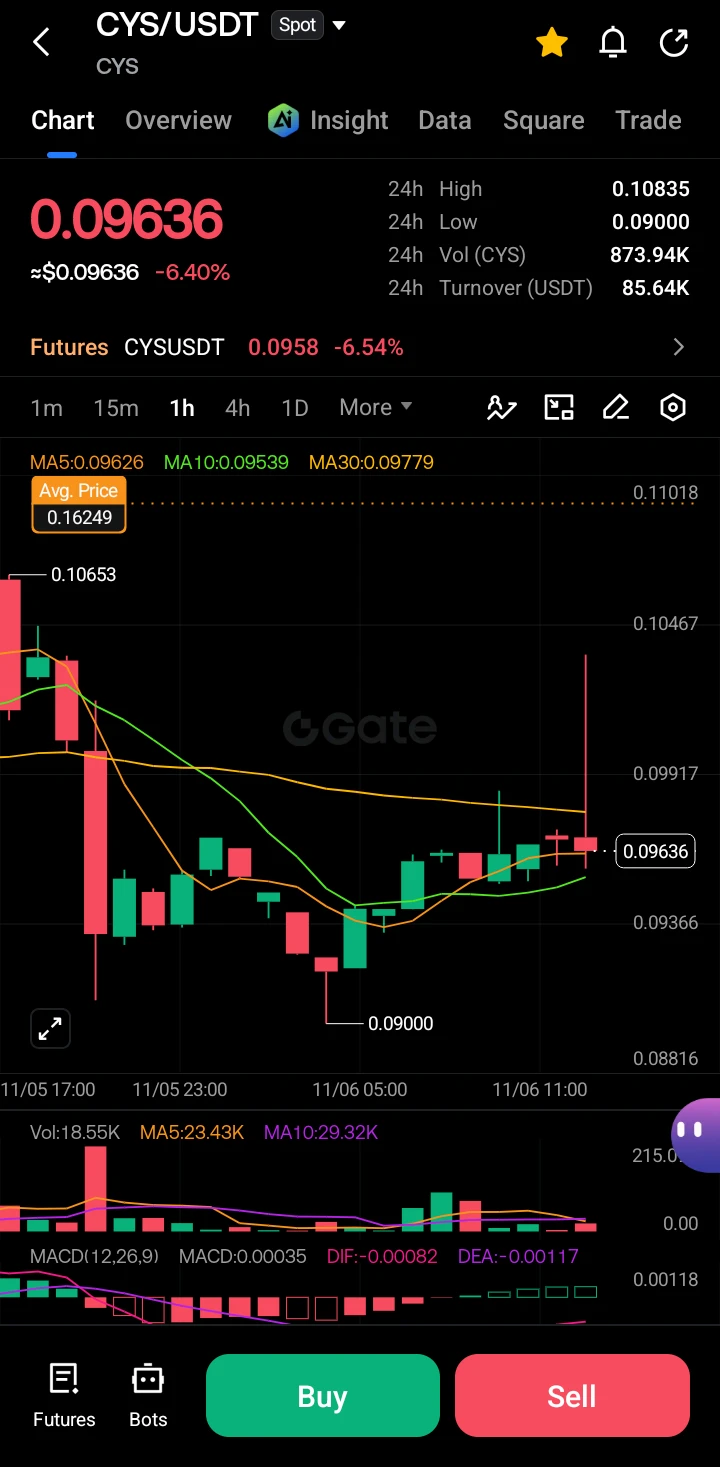
CYS/USDT – Intraday Technical Update & Setup
$CYS ‌
The CYS/USDT pair is currently exhibiting clear bearish momentum on the intraday timeframe. After a sharp rejection from the 0.10653 level, the price has established a local downtrend, printing consecutive lower highs and lower lows. The asset is currently trading around 0.09636, down 6.40% over the 24-hour period, with a session low of 0.09000. The broader market structure suggests persistent downward pressure, and buyers have yet to demonstrate the volume required to reverse the trend.

Technical Analysis.

Looking at the 1-hour chart, the
post-image
CYS-0.35%
  • 7
  • 1
Work is a tool. Not your identity.
#WorkLife #GenZ
post-image
Michael Saylor Warns That AI-Powered Hackers Are Targeting Crypto Assets! How Can Platforms Prove Us
live-cover
LIVE1,936
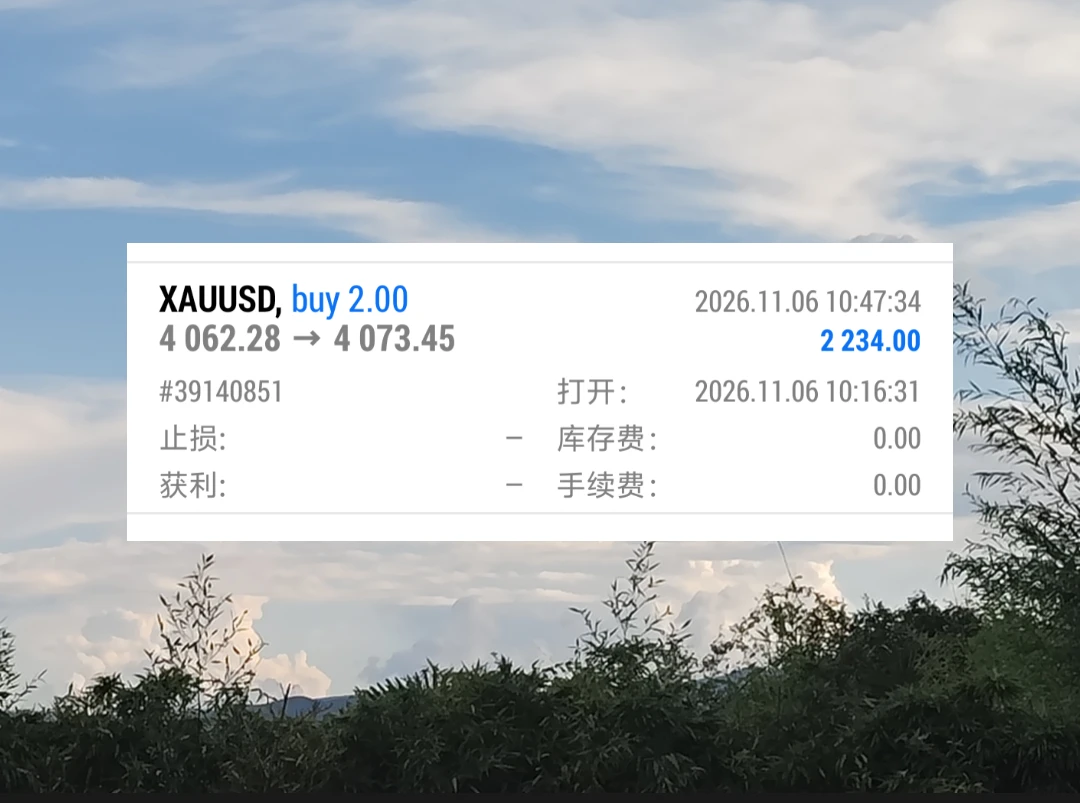
The afternoon rally never looked back. Went long with the trend at 4062, gaining 11 points and banking $2234!
$BTC $XAU #Gate首创资金安全证明 #美股史诗级抛售 #加密市场承压 #Gate社交年度主播与创作者评选
post-image
BTC-0.65%
XAU+0.38%
Started a trade with copy trading enabled, 600u to start. Let’s see how far it goes 😁😁😁
post-image
The long position from the livestream is taking off; I took profit and got out.
Account: +800u, currently 5800u
  • 4
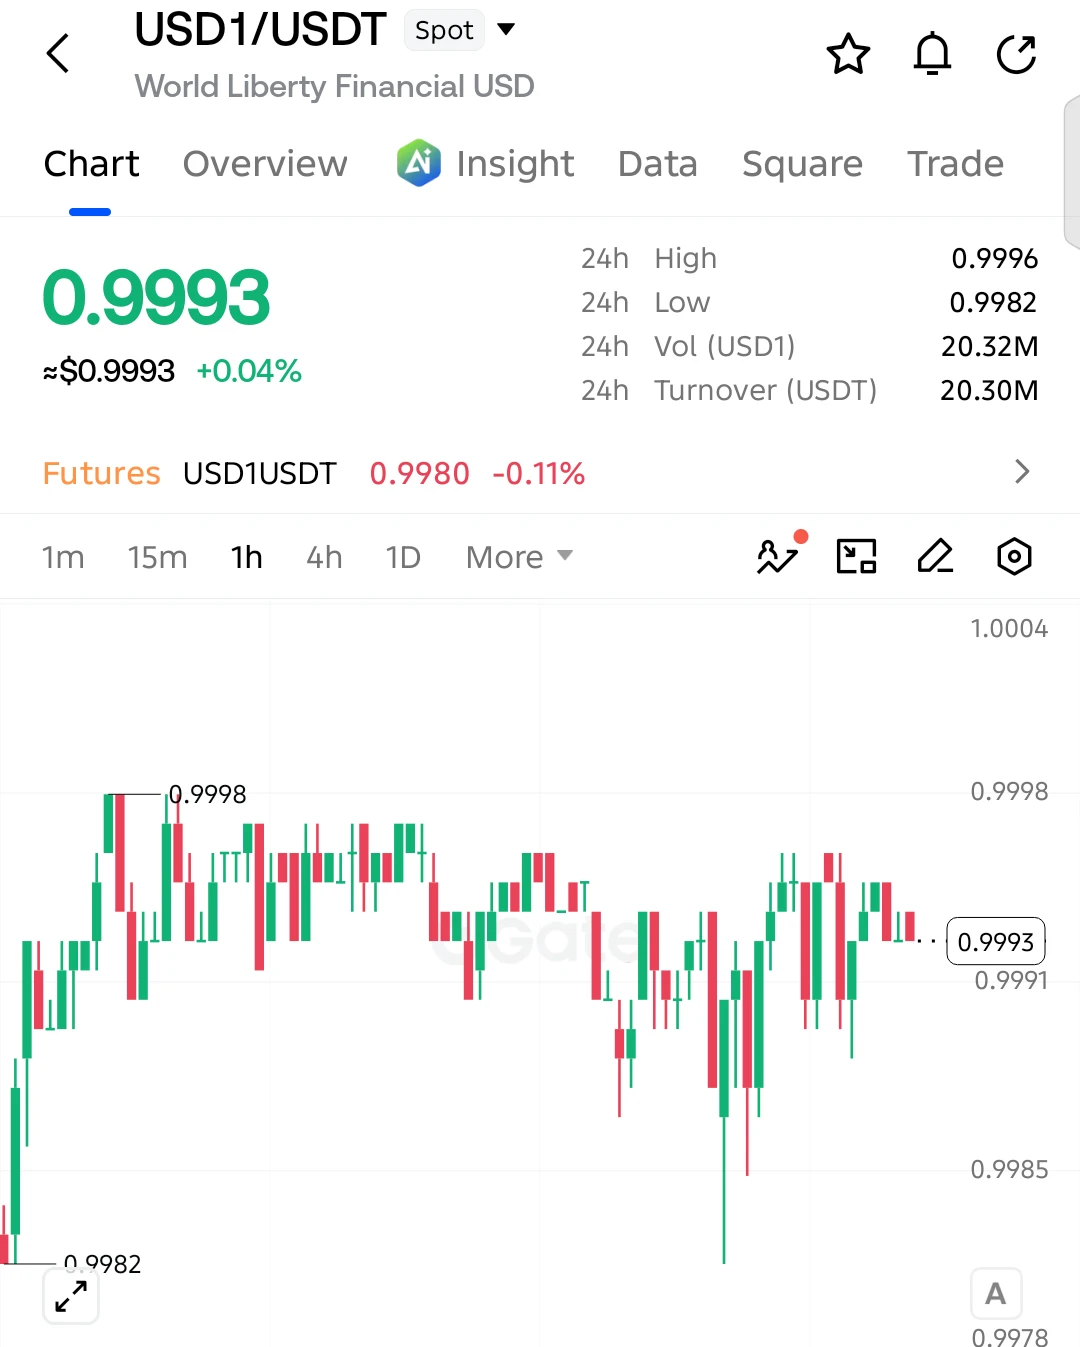
💵 $USD1 SPOT UPDATE — HOLDING CLOSE TO $1!

$USD1 is trading at 0.9993, maintaining stability near its dollar peg despite recent market volatility.

Current Price: 0.9993
Support: 0.9982
Resistance: 0.9996
Peg Level: 1.0000

Buyers have defended the lower range, keeping $USD1 close to its intended $1 value. Price remains relatively stable, with no significant deviation from the peg visible on the chart.

The key level to watch is 0.9982. A sustained move below it could signal increasing pressure on the peg.
post-image
USD1+0.00%
  • 4
Load More

Join 40 M users in our growing community

⚡️ Join 40 M users in the crypto craze discussion

💬 Engage with your favorite top creators

👍 See what interests you

Trending Topics

USStocksFaceHistoricSelloff

4.79k Views3.65k Discussing

U.S. stocks suffered a sharp selloff on Thursday, with the Nasdaq closing down more than 5% and the Philadelphia Semiconductor Index falling over 12%. AI and chip stocks including $NVDA and $AMD were hit especially hard. Markets are reassessing AI valuations, data-center spending and future returns. Is this just short-term deleveraging, or the start of a deeper correction in the AI trade? Which sectors are you watching next?

GateLaunchesPoSECProofOfSecurity

14.95k Views594 Discussing

USNonfarmPayrolls

13.18k Views4.05k Discussing

View More