Square
Following
Hot
News
Notifications
Profile
Share your thoughts
placeholder
Article
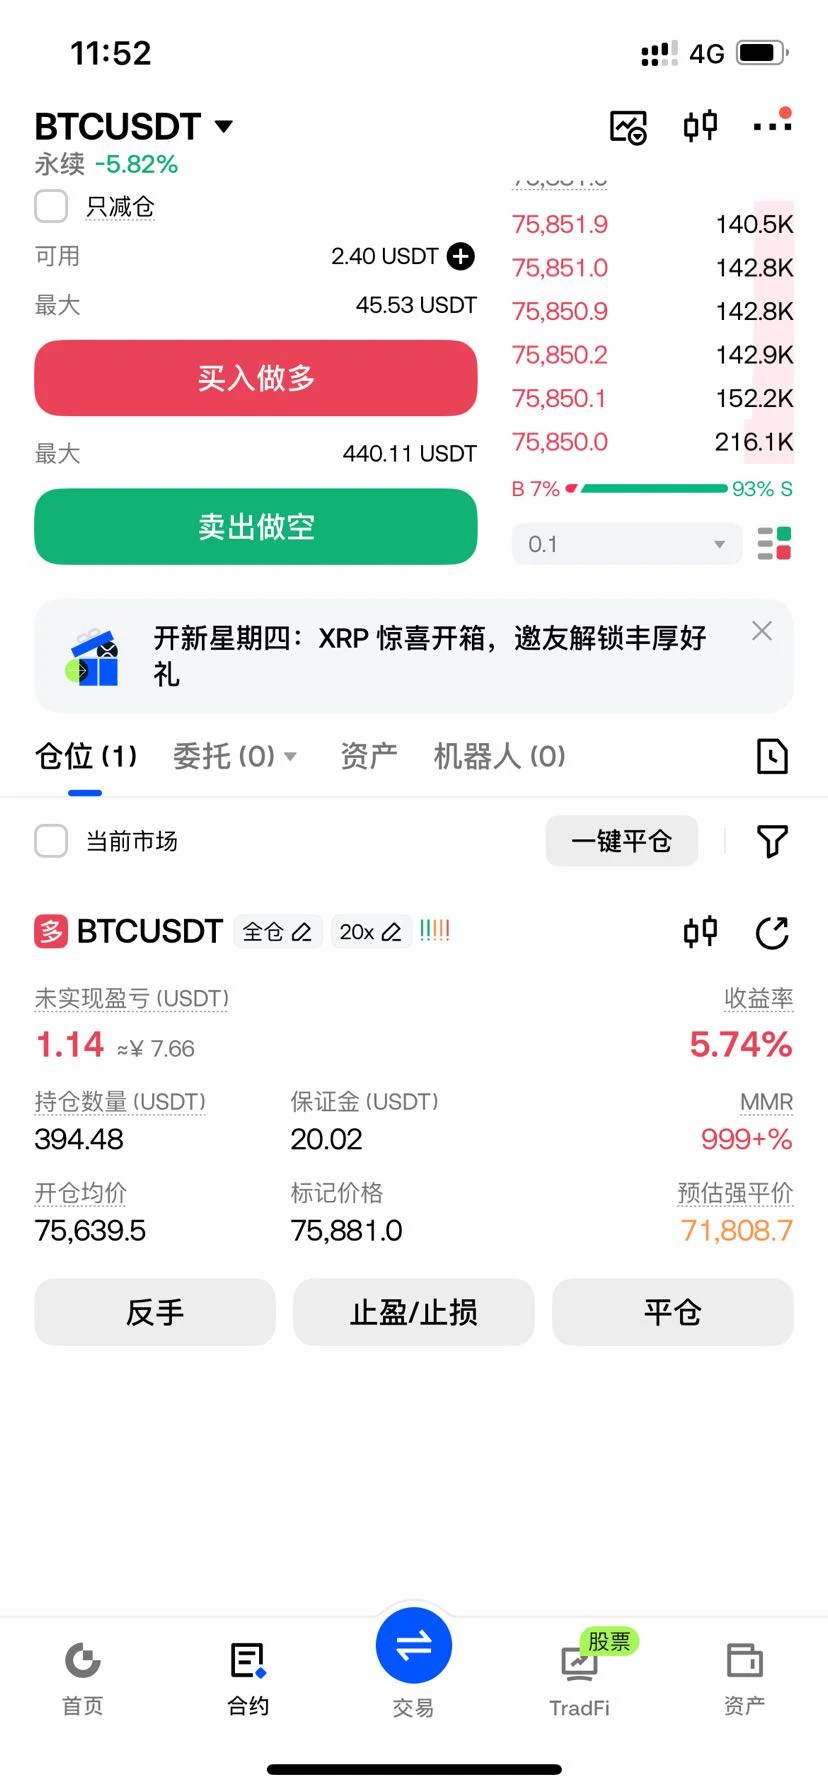
The 10U futures challenge to 100kU is under control
post-image
Cross Margin vs. Isolated Margin: What’s the Difference? A Clear Guide to Margin, Risk Isolation, and Liquidation

In crypto futures trading, one question comes up again and again:

Which is safer: cross margin or isolated margin?

Some believe cross margin is more flexible because the account’s available margin can provide a buffer for positions. Others believe isolated margin is safer because the margin risk of each position is relatively separate.

But both views are only partially right.

The core difference between cross margin and isolated margin is not which mode can eliminate risk, but
Trenches
fxUSD
f
bade
b
fxUSD
0x08...d8f6
Market Cap
$.
Change
.
24h Vol
$.
Holders
.
ZIG
Z
bade
b
ZIG
0x8c...1145
Market Cap
$.
Change
.
24h Vol
$.
Holders
.
BTC
B
bade
b
BTC
C5xp...pump
Market Cap
$.
Change
.
24h Vol
$.
Holders
.
CORLA
C
bade
b
CORLA
0xba...7777
Market Cap
$.
Change
.
24h Vol
$.
Holders
.
STONK
S
bade
b
STONK
6GmA...UNgx
Market Cap
$.
Change
.
24h Vol
$.
Holders
.
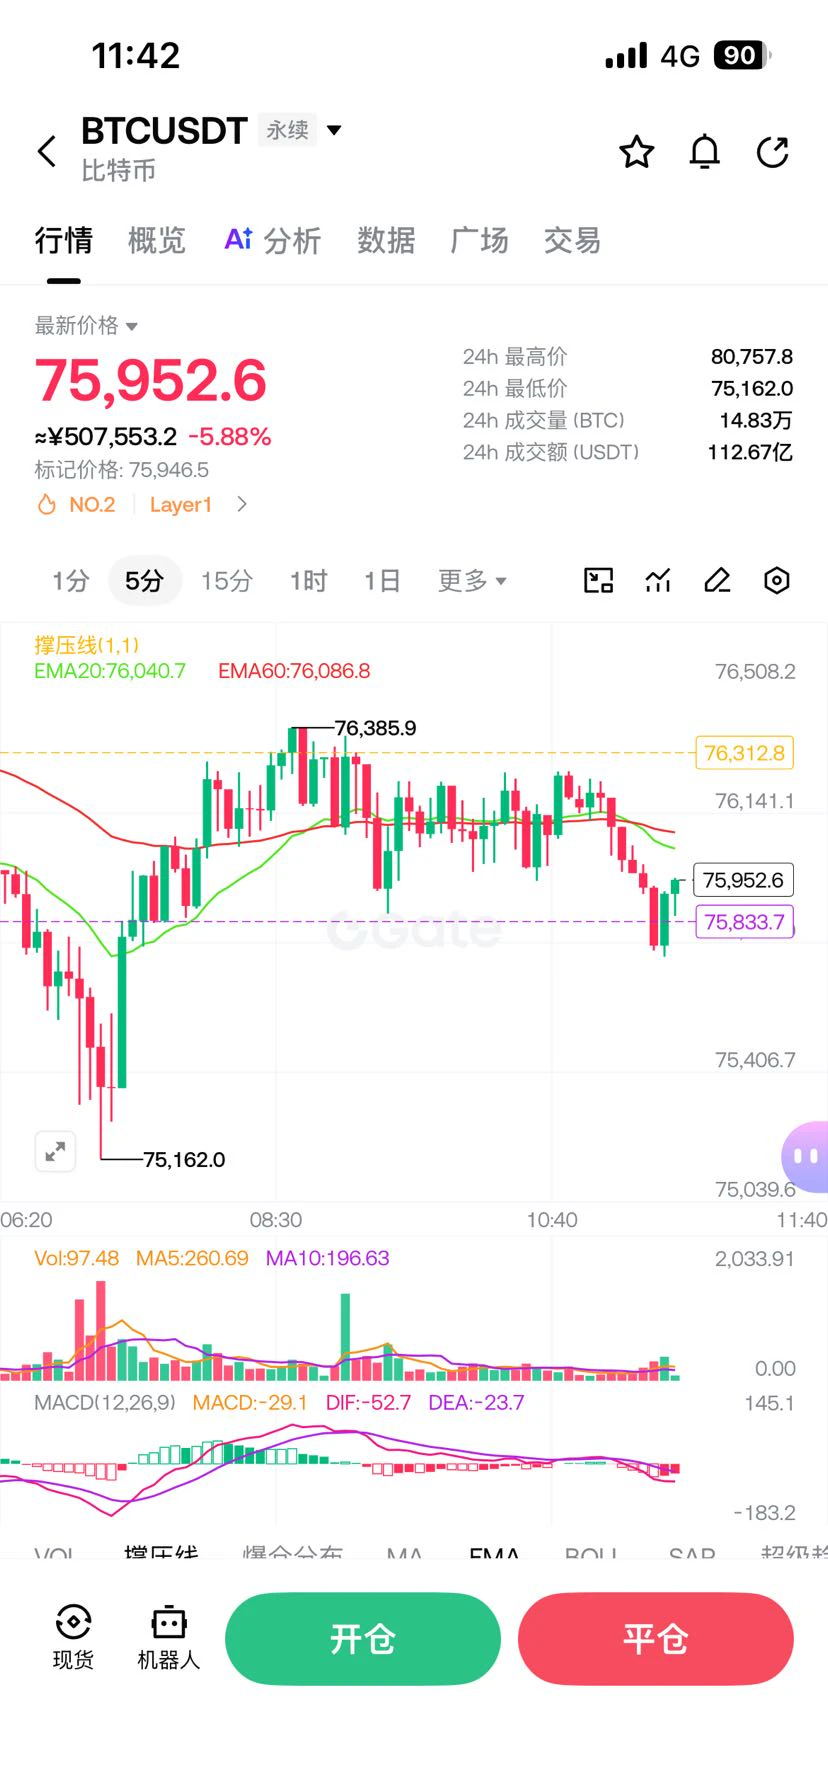
$BTC The market was already facing correction pressure, and on-chain news that Trump Media had transferred a large amount of BTC to exchanges became the trigger for bearish sentiment. Longs panic-sold, and liquidations of leveraged positions added to the pressure, driving a rapid drop.#ETH跌5.5%
BTC-0.65%
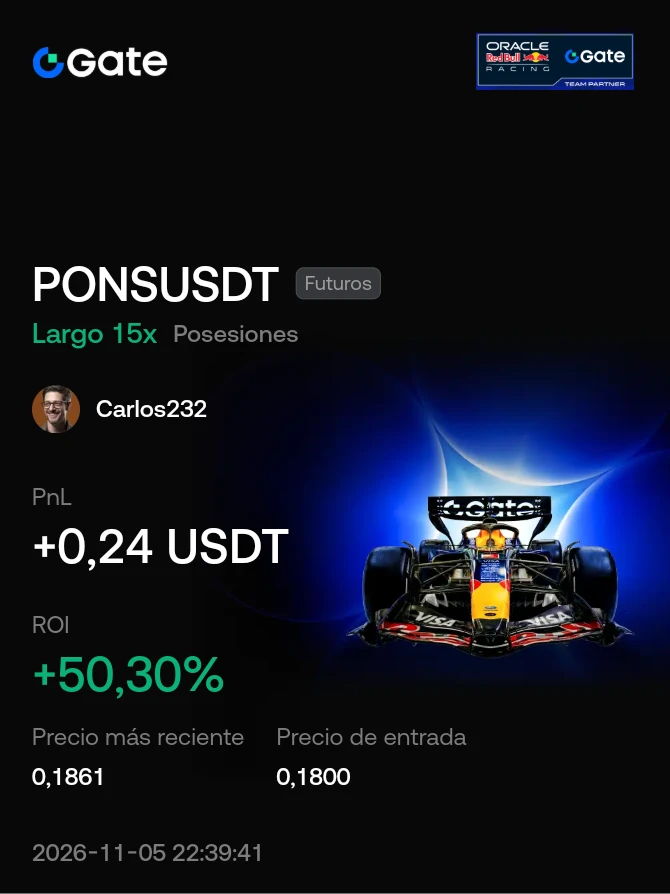
#Share My Holding Returns# Pons is still suffering. Will the recovery continue? Things are very unstable these days. What will happen in the USA with the war???
post-image
PONS+4.32%
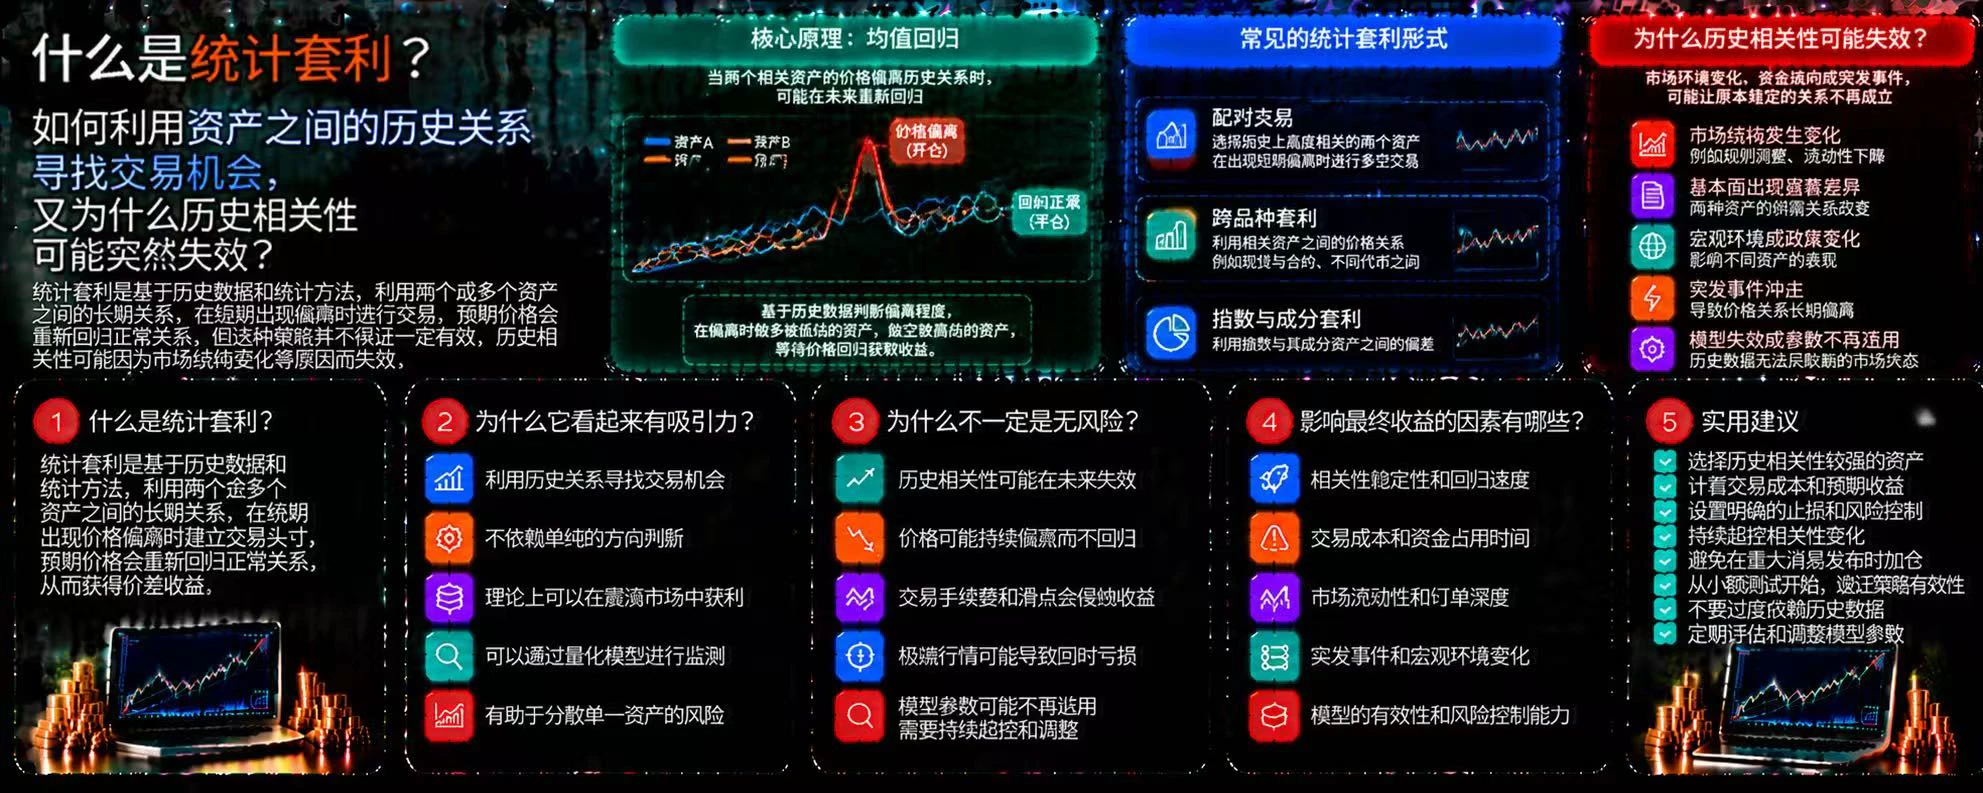
What is statistical arbitrage? How can historical relationships between assets be used to identify trading opportunities, and why might historical correlations suddenly break down?

In the cryptocurrency market, some assets have long exhibited similar price movements. When their historical relationship temporarily deviates, traders may try to exploit the discrepancy. This is the basic idea behind statistical arbitrage, but historical patterns do not guarantee that they will repeat.

First, what is statistical arbitrage?

Statistical arbitrage is a type of trading strategy that uses historical
post-image
$MUU Over 24 hours, it got cut in half, then halved again. That huge -23.22% candle left everyone who chased the rally buried at the 18.68 peak. The current price is 14.12, after plunging as low as 12.22, with the 312M in trading volume made up entirely of battered tokens changing hands.
First, let’s look at the hot narrative and its correlation. BTC is moving sideways around a key level today, while rate-cut expectations on the Fed side keep swinging back and forth. Big money is sitting on the sidelines, and liquidity is draining from the altcoin market. For a highly volatile asset like $MUU,
MUU-35.00%
BTC-0.67%
  • 11
  • 2
[New Streamer] 🔹Democrats Sweep Both Chambers of Congress as the Dow Surges Over 3! But AI Stocks F
live-cover
LIVE1,080
What Is a Market Maker? How Do They Improve Market Liquidity by Providing Bid and Ask Quotes, and What Risks Do They Face?

In the cryptocurrency market, whether a trade can be executed quickly depends not only on the willingness of buyers and sellers, but also on whether sufficient liquidity is available. Market makers are important participants in providing market liquidity, but they are not intermediaries who always make a profit.

First, what is a market maker?

Market makers typically continuously provide buy and sell quotes, making it easier for other traders to find counterparties. By a
post-image
Take a gamble with a 75000 stop-loss. The odds of this trade succeeding aren't high, but it's worth a try.
post-image
Market update
live-cover
LIVE1,727
  • 1
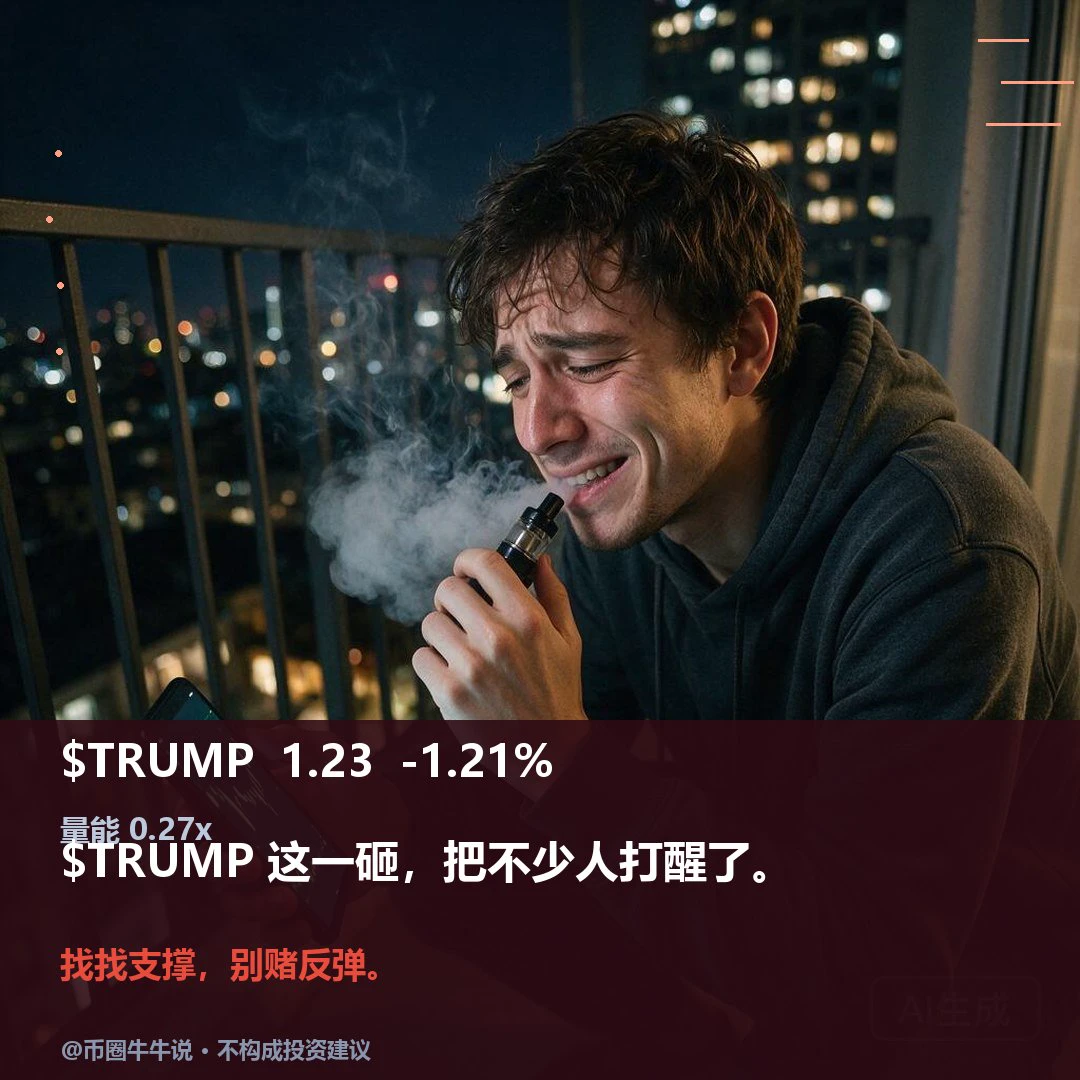
$TRUMP Currently at 1.225, down 1.21% over 24H (1.113–1.293). The 1H outlook is relatively strong: RSI 48.60, with the current price above EMA20 at 1.2208; the 4H outlook is weak: RSI 18.35, with the current price below EMA20 at 1.3656. The 1H volume ratio is 0.27. If the price holds above the 1.293 resistance level, watch for continuation; if it breaks below the 1.113 support level, the short-term outlook turns weak. In the next review, check whether the price can hold above 1.293 and whether it can recover after losing 1.113. The two timeframes remain divergent, so short-term changes should
post-image
TRUMP-0.95%
  • 1
BTC’s Ultimate Bull Trap Comes True! Head-and-Shoulders Pattern Unchanged, Keep Shorting! Is the Storage Sector Starting to Bottom?

Yesterday, Chief said BTC was still following the head-and-shoulders pattern, and shorting on the right side was the only thing to do. Longing BTC was never even considered. The market also confirmed our analysis: an ultimate bull trap!

With that in mind, the daily head-and-shoulders pattern in BTC remains in play, and today we can take an early entry based on the large bearish 4-hour candle. The key resistance on the 4-hour chart is 78,900. Only consider shorti
BTC-0.67%
ETH-1.26%
SNDK-22.24%
  • 9
  • 2
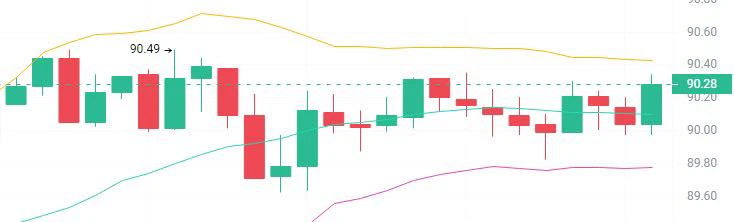
Today's Morning SOL Outlook

Short
Entry range: 90.70 - 91.00 (rebound to the upper band and previous high resistance zone; enter only after momentum stalls and a bearish candle closes)
Stop-loss: above 91.50 (holding above this level would invalidate the short-term bearish outlook)
Targets: 89.80 (middle band) → 88.30 (previous low)

Long
Entry range: 89.70 - 89.90 (pullback to middle band support; consider entering only after a clear sign of a bottom)
Stop-loss: below 89.20 (a break below the lower band invalidates the long)
Targets: 90.70 (upper band) → 91.20

After a sharp drop, SOL has st
post-image
SOL-0.74%
What Is Arbitrage Trading? Why Doesn’t a Price Difference for the Same Crypto Asset Across Different Markets Necessarily Mean There Is Risk-Free Profit?

In crypto markets, the same asset may be quoted at different prices on different exchanges, and price gaps may also exist between spot and contract markets. Arbitrage trading seeks to profit from these differences, but in practice, fees, slippage, transfer delays, and market volatility can all erase seemingly certain profits.

First, what is arbitrage trading?

Arbitrage trading is a strategy that seeks to profit from price differences betwee
post-image
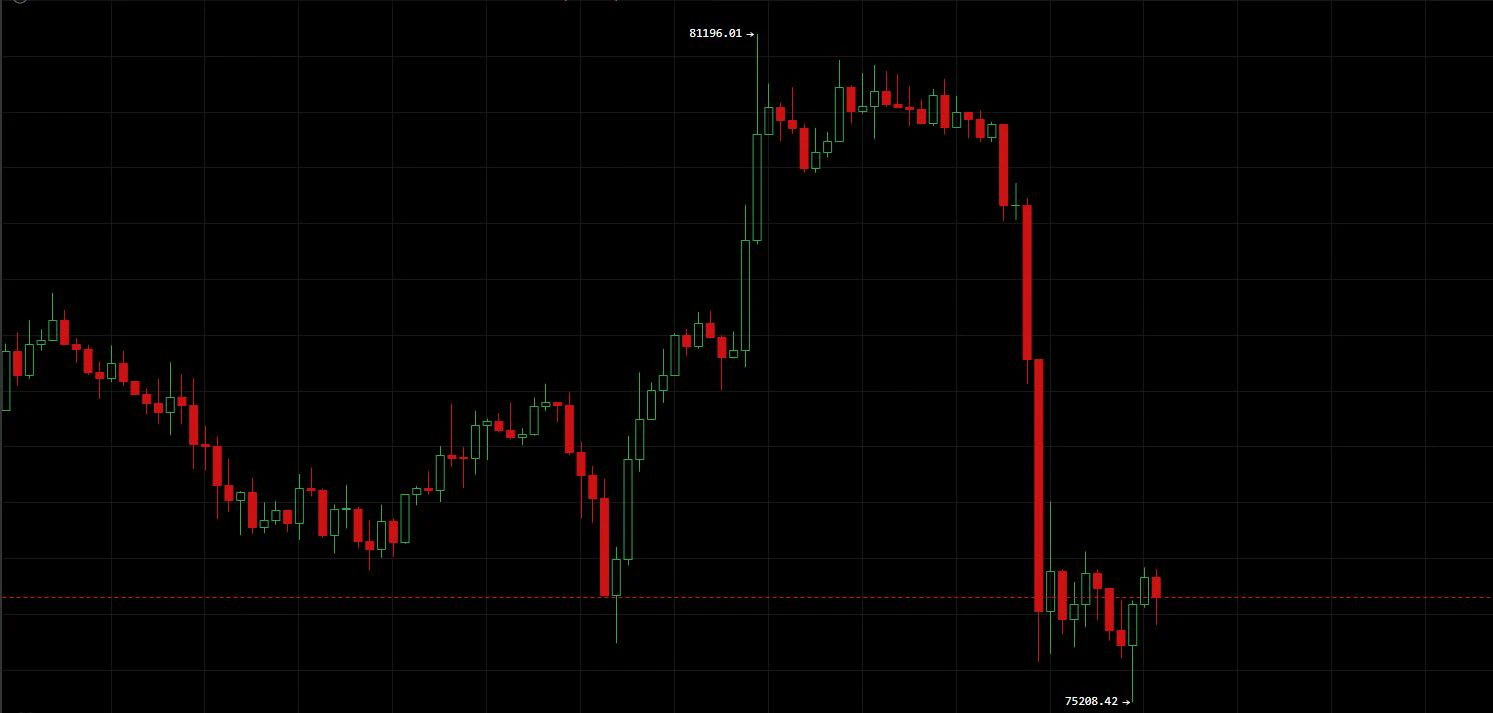
November 6 $BTC The U.S. election outcome triggered a “buy the rumor, sell the fact” move, as concentrated profit-taking from the earlier rebound sparked a futures liquidation cascade.
【Today's Strategy】
Short entry range: Position on a rebound to 76800-77300
Long entry range: Position after a stable retest of 75500-75700
Stop-loss settings: Short stop-loss above 77600; long stop-loss below 75100
Take-profit settings:
Short targets: 76200-75800
Long targets: 76800-77000
【Core Logic】
The hourly chart saw a sharp, one-way drop on heavy volume, with bears dominating the short-term market. 76800-
post-image
BTC-0.65%
  • 3
Does a self-custody wallet mean you fully own your digital assets? 🔐

In the Web3 world, we often hear the claim:

As long as you hold your own private keys, your assets truly belong to you.

But to understand digital asset autonomy more deeply, we need to think further:

What does holding your private keys actually mean? What can they let you control, and what is not entirely up to you?

This is not a play on words, but an important step toward understanding digital asset security.

I. Private keys address the issue of control, but not every issue.

In a non-custodial wallet, the private key
post-image
📡 Signal Card · Just Captured
KOL: Two Degrees Below Zero Direction: $BTC Long Entry: 82400 Target: 83850 / 85250 / 85750 Stop-loss: 81000
Come to think of it, I reposted this person's $ETH trade earlier today, and they're back again. Pretty prolific 😂
Sis is only reposting this as-is; there's no guarantee about the signal. Whether to follow and how much to put in is up to you all—getting carried away on a single trade can get you burned.
Shared as a personal record, not investment advice. #AI Giants Financing Watch: Microsoft and Meta Issue a Combined $40 Billion in Bonds
BTC-0.67%
ETH-1.26%
MSFT-3.65%
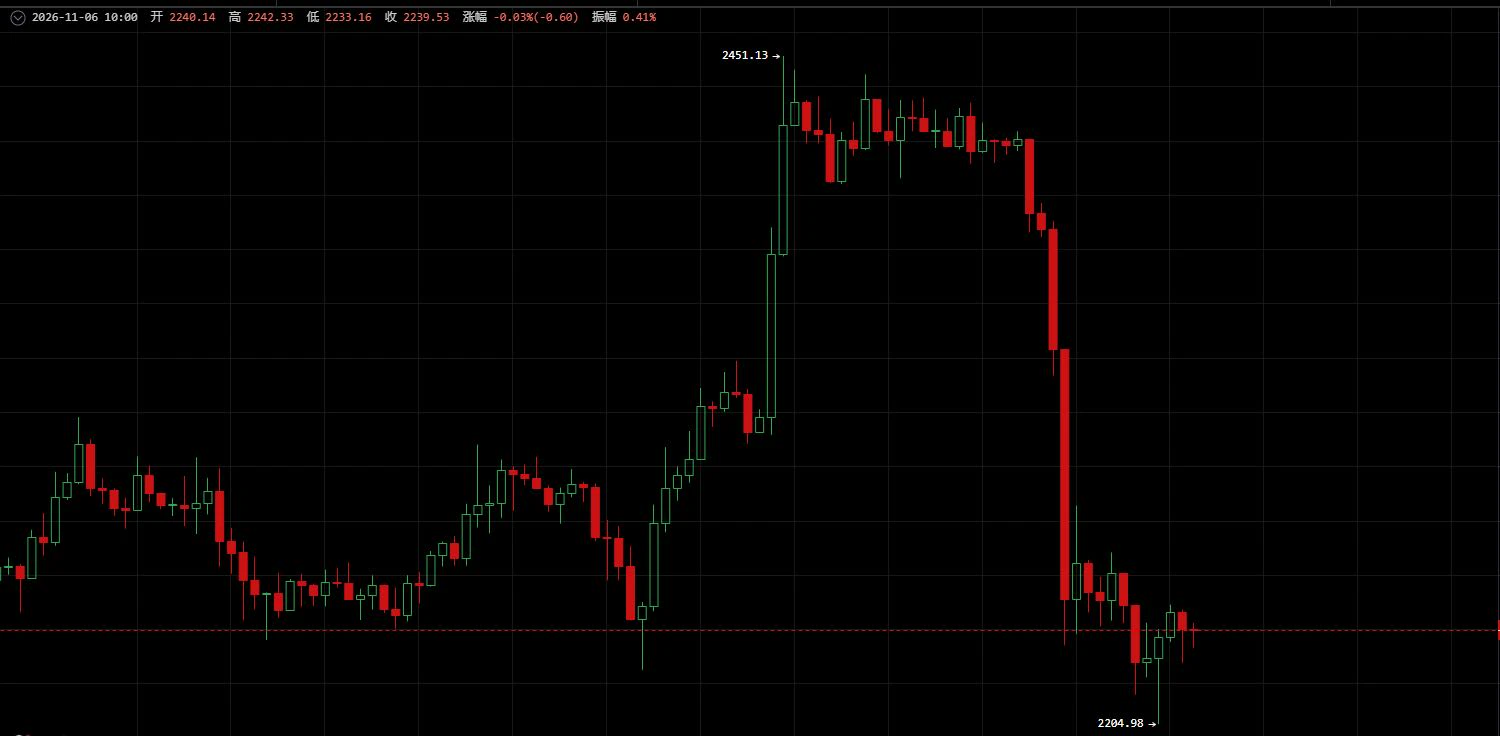
November 6 $ETH After the U.S. election results were finalized, the market shifted to pricing in expectations of fiscal expansion, triggering concentrated selling pressure. After plunging, prices recovered from their lows; short into the rebound.
【Today's Trading Plan】
Short entry range: Position on a rebound to 2260–2280
Take-profit: 2220–2205
【Core Logic】
A surge in hourly trading volume accompanied a sharp breakdown, with bears in control in the short term. The 2260–2280 range is a dense resistance zone formed after the breakdown, with heavy selling pressure on rebounds. A technical recover
post-image
ETH-1.26%
#Gate2026YearEndGala
Gate's Year-End Gala Is Open: Here's What Creators and Fans Can Actually Win

If you stream, create, or simply support the people who do, Gate's 2026 Year-End Community Gala is the moment to act. The registration window closes on 10 November at 15:59 UTC, which is about six days from now. Two categories, Streamer of the Year and Creator of the Year, run in both a Chinese-language division and a Global division, and each division ranks its top 20 separately.

Where the program stands today
Registration runs from 3 November to 10 November. Qualified applicants move into the
GT-2.41%
DOGE-0.22%
  • 4
  • 1
When BTC Shows Bearish Divergence, Does It Mean a Drop Is Coming?

In BTC technical analysis, bearish divergence is often seen as an early warning that an uptrend may be weakening. But many traders rush to short as soon as they spot bearish divergence, only to see the price keep rising instead of falling and ultimately get caught on the wrong side of the move.

So how should you interpret bearish divergence?

First, understand the basic principle. When the BTC price keeps making new highs, but the highs on the RSI or MACD indicators gradually decline, bearish divergence may be forming. This me
post-image
BTC-0.67%
Load More

Join 40 M users in our growing community

⚡️ Join 40 M users in the crypto craze discussion

💬 Engage with your favorite top creators

👍 See what interests you

Trending Topics

USStocksFaceHistoricSelloff

586 Views3.47k Discussing

U.S. stocks suffered a sharp selloff on Thursday, with the Nasdaq closing down more than 5% and the Philadelphia Semiconductor Index falling over 12%. AI and chip stocks including $NVDA and $AMD were hit especially hard. Markets are reassessing AI valuations, data-center spending and future returns. Is this just short-term deleveraging, or the start of a deeper correction in the AI trade? Which sectors are you watching next?

GateLaunchesPoSECProofOfSecurity

11.51k Views568 Discussing

USNonfarmPayrolls

8.95k Views3.99k Discussing

View More