Square
Following
Hot
News
Profile
Share your thoughts
placeholder
Article
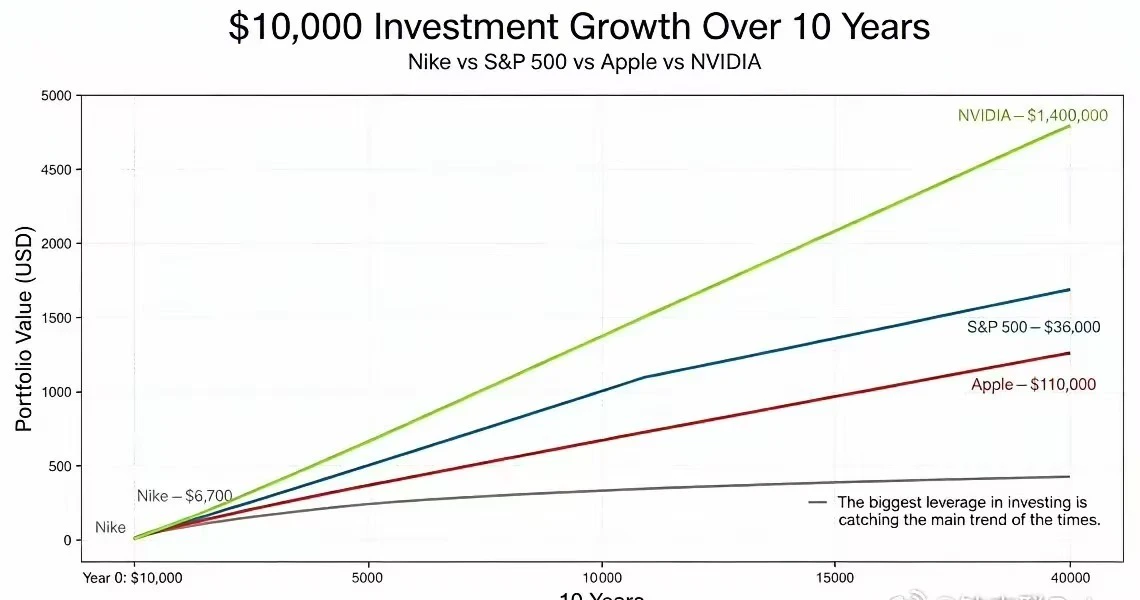
If you had invested $10k in Nike 10 years ago, you would have $6,700 today.
If you had invested $10k in the S&P 500 10 years ago, you would have $36k today.
If you had invested $10k in Apple 10 years ago, you would have approximately $110k today.
If you had invested $10k in Nvidia 10 years ago, you would have approximately $1.4 million today.
post-image
NKE+1.15%
SPYX+0.01%
AAPL-1.65%
NVDA-1.27%
$BTC
BTC Outlook Update:
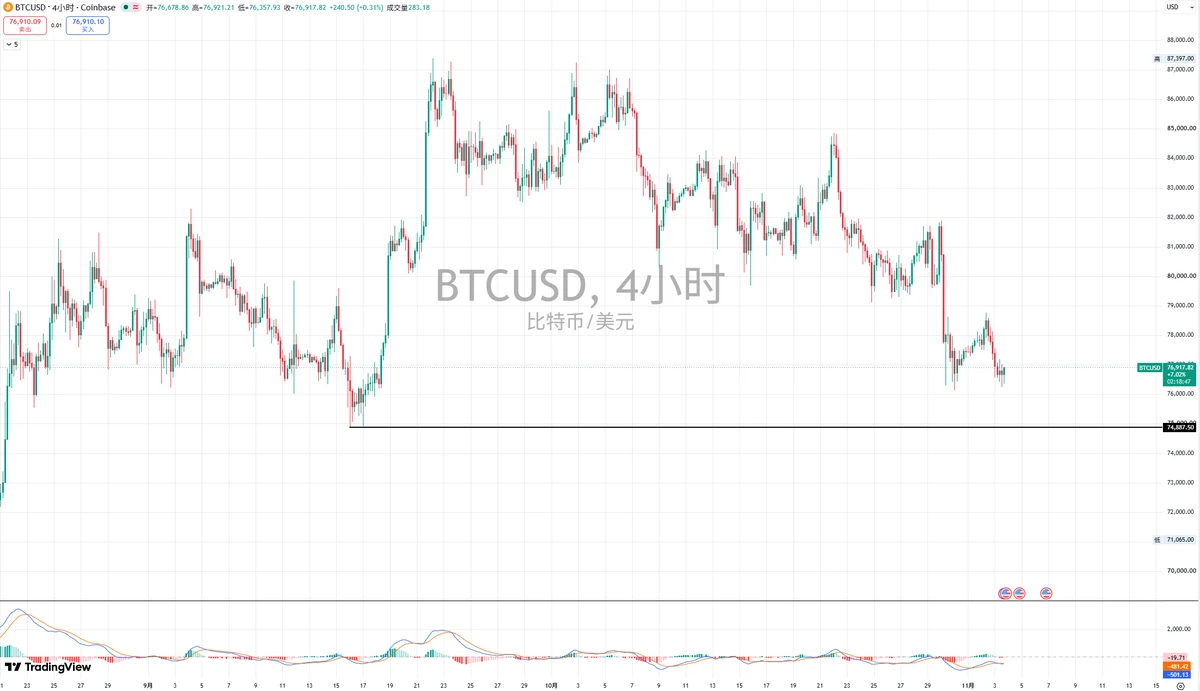
After yesterday’s rebound on the lower timeframes, the price continued to fall. It started moving down to test support without even testing the resistance near 80k, which shows that the market is truly weak!
In my view, this is still not a very good bottom, and it’s not an especially good zone to buy the dip. I recommend continuing to watch the liquidity zone around 72k and see whether the price action fits a bottoming structure!
post-image
BTC-0.67%
Trenches
ZIG
Z
bade
b
ZIG
0x8c...1145
Market Cap
$.
Change
.
24h Vol
$.
Holders
.
STONK
S
bade
b
STONK
6GmA...UNgx
Market Cap
$.
Change
.
24h Vol
$.
Holders
.
CAPY
C
bade
b
CAPY
5DnW...vg2g
Market Cap
$.
Change
.
24h Vol
$.
Holders
.
AGT
A
bade
b
AGT
0x5d...e274
Market Cap
$.
Change
.
24h Vol
$.
Holders
.
MAMESUKE
M
bade
b
MAMESUKE
SCGB...STNK
Market Cap
$.
Change
.
24h Vol
$.
Holders
.
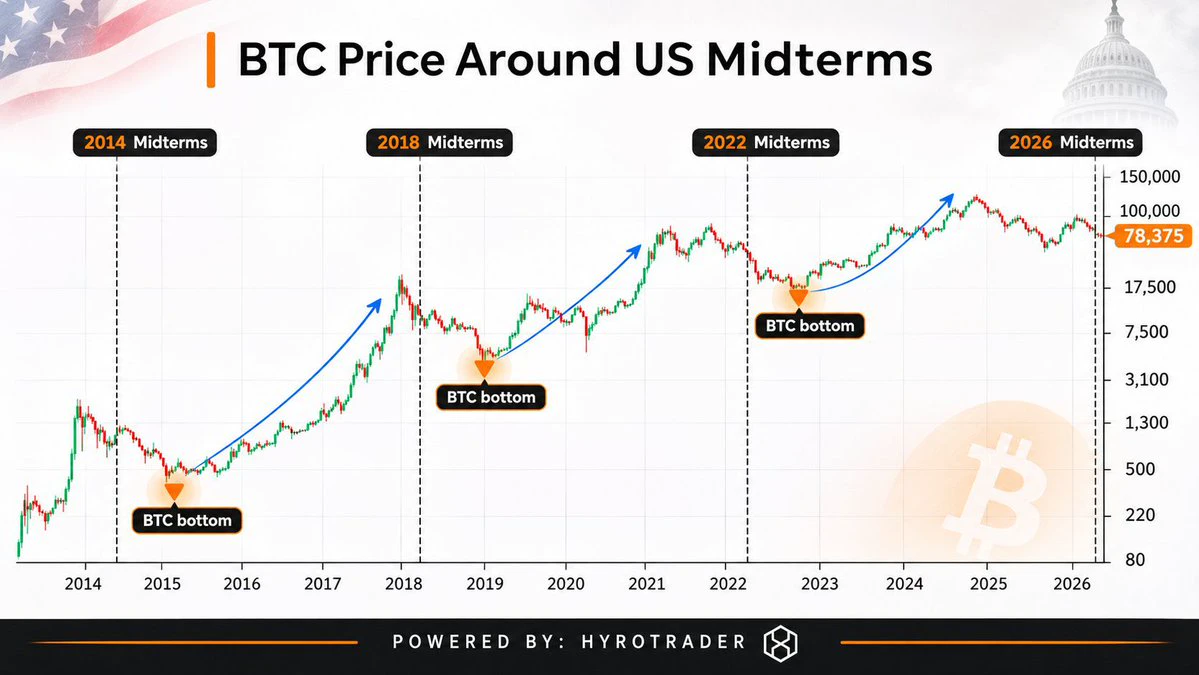
The US midterm elections are happening today
And there’s an interesting historical pattern worth looking at from Bitcoin’s previous cycles
In 2014, Bitcoin found its cycle bottom 71 days after the midterms and the skyrocketed above previous high
Same in 2018, it took 39 days, while in 2022, it took just 13 days
Interestingly, BTC has already recorded a cycle low around $57.8K this year, months before today’s elections
So I’m not necessarily expecting history to repeat itself in the same downward motion before the upward boom
What interests me more is what comes next
The election results could
post-image
BTC-0.67%
🌍 The internet connected information, and the mobile internet connected people.
So what needs to be connected in the next phase?
The answer may be: value.
The future development of the digital economy requires not only the rapid flow of information, but also more efficient exchanges of value.
Blockchain is exploring new ways to connect, giving the digital world more possibilities.
ONEA Network focuses on the future direction of value connectivity.
Connect users.
Connect services.
Connect the future.
One Vision.
One Network.
One Future.
post-image
VSN-1.43%
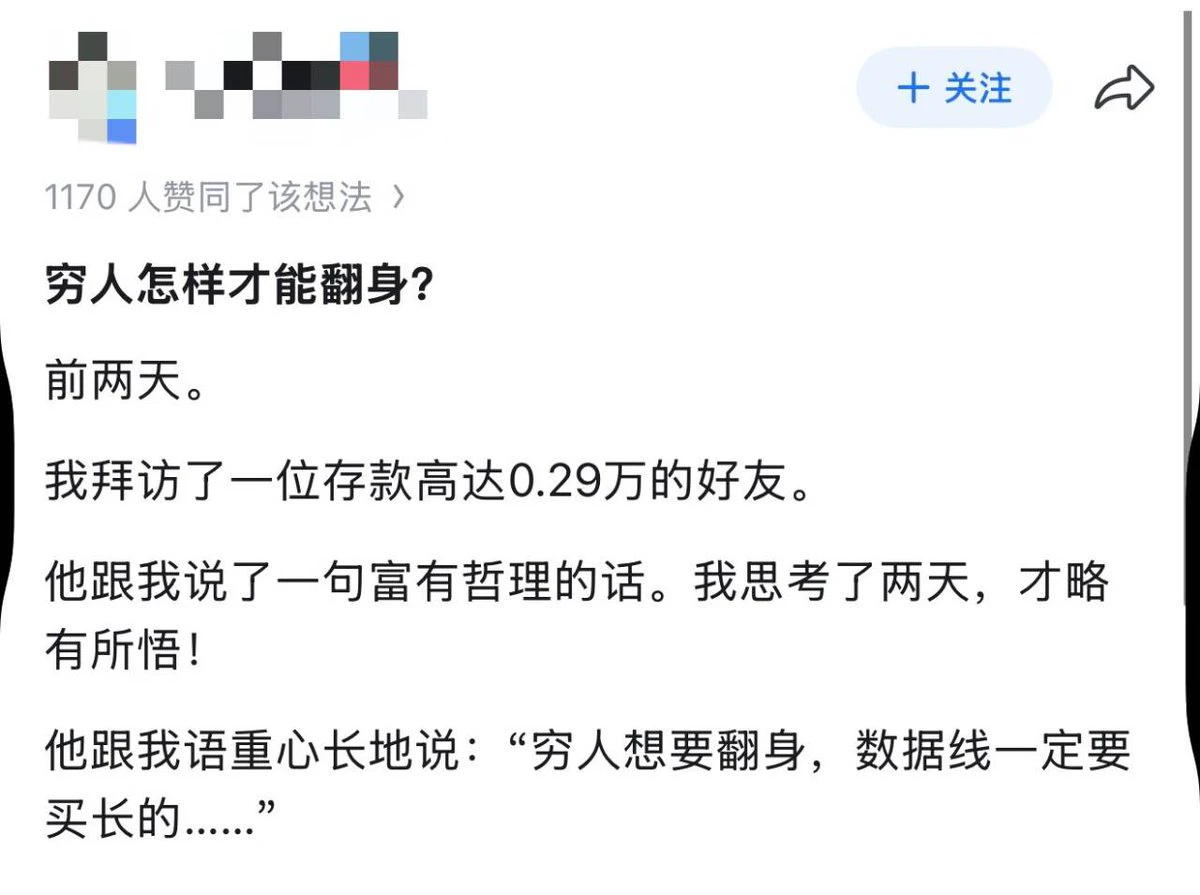
If you’re poor and want to turn your life around, make sure to buy a long charging cable...😅
post-image
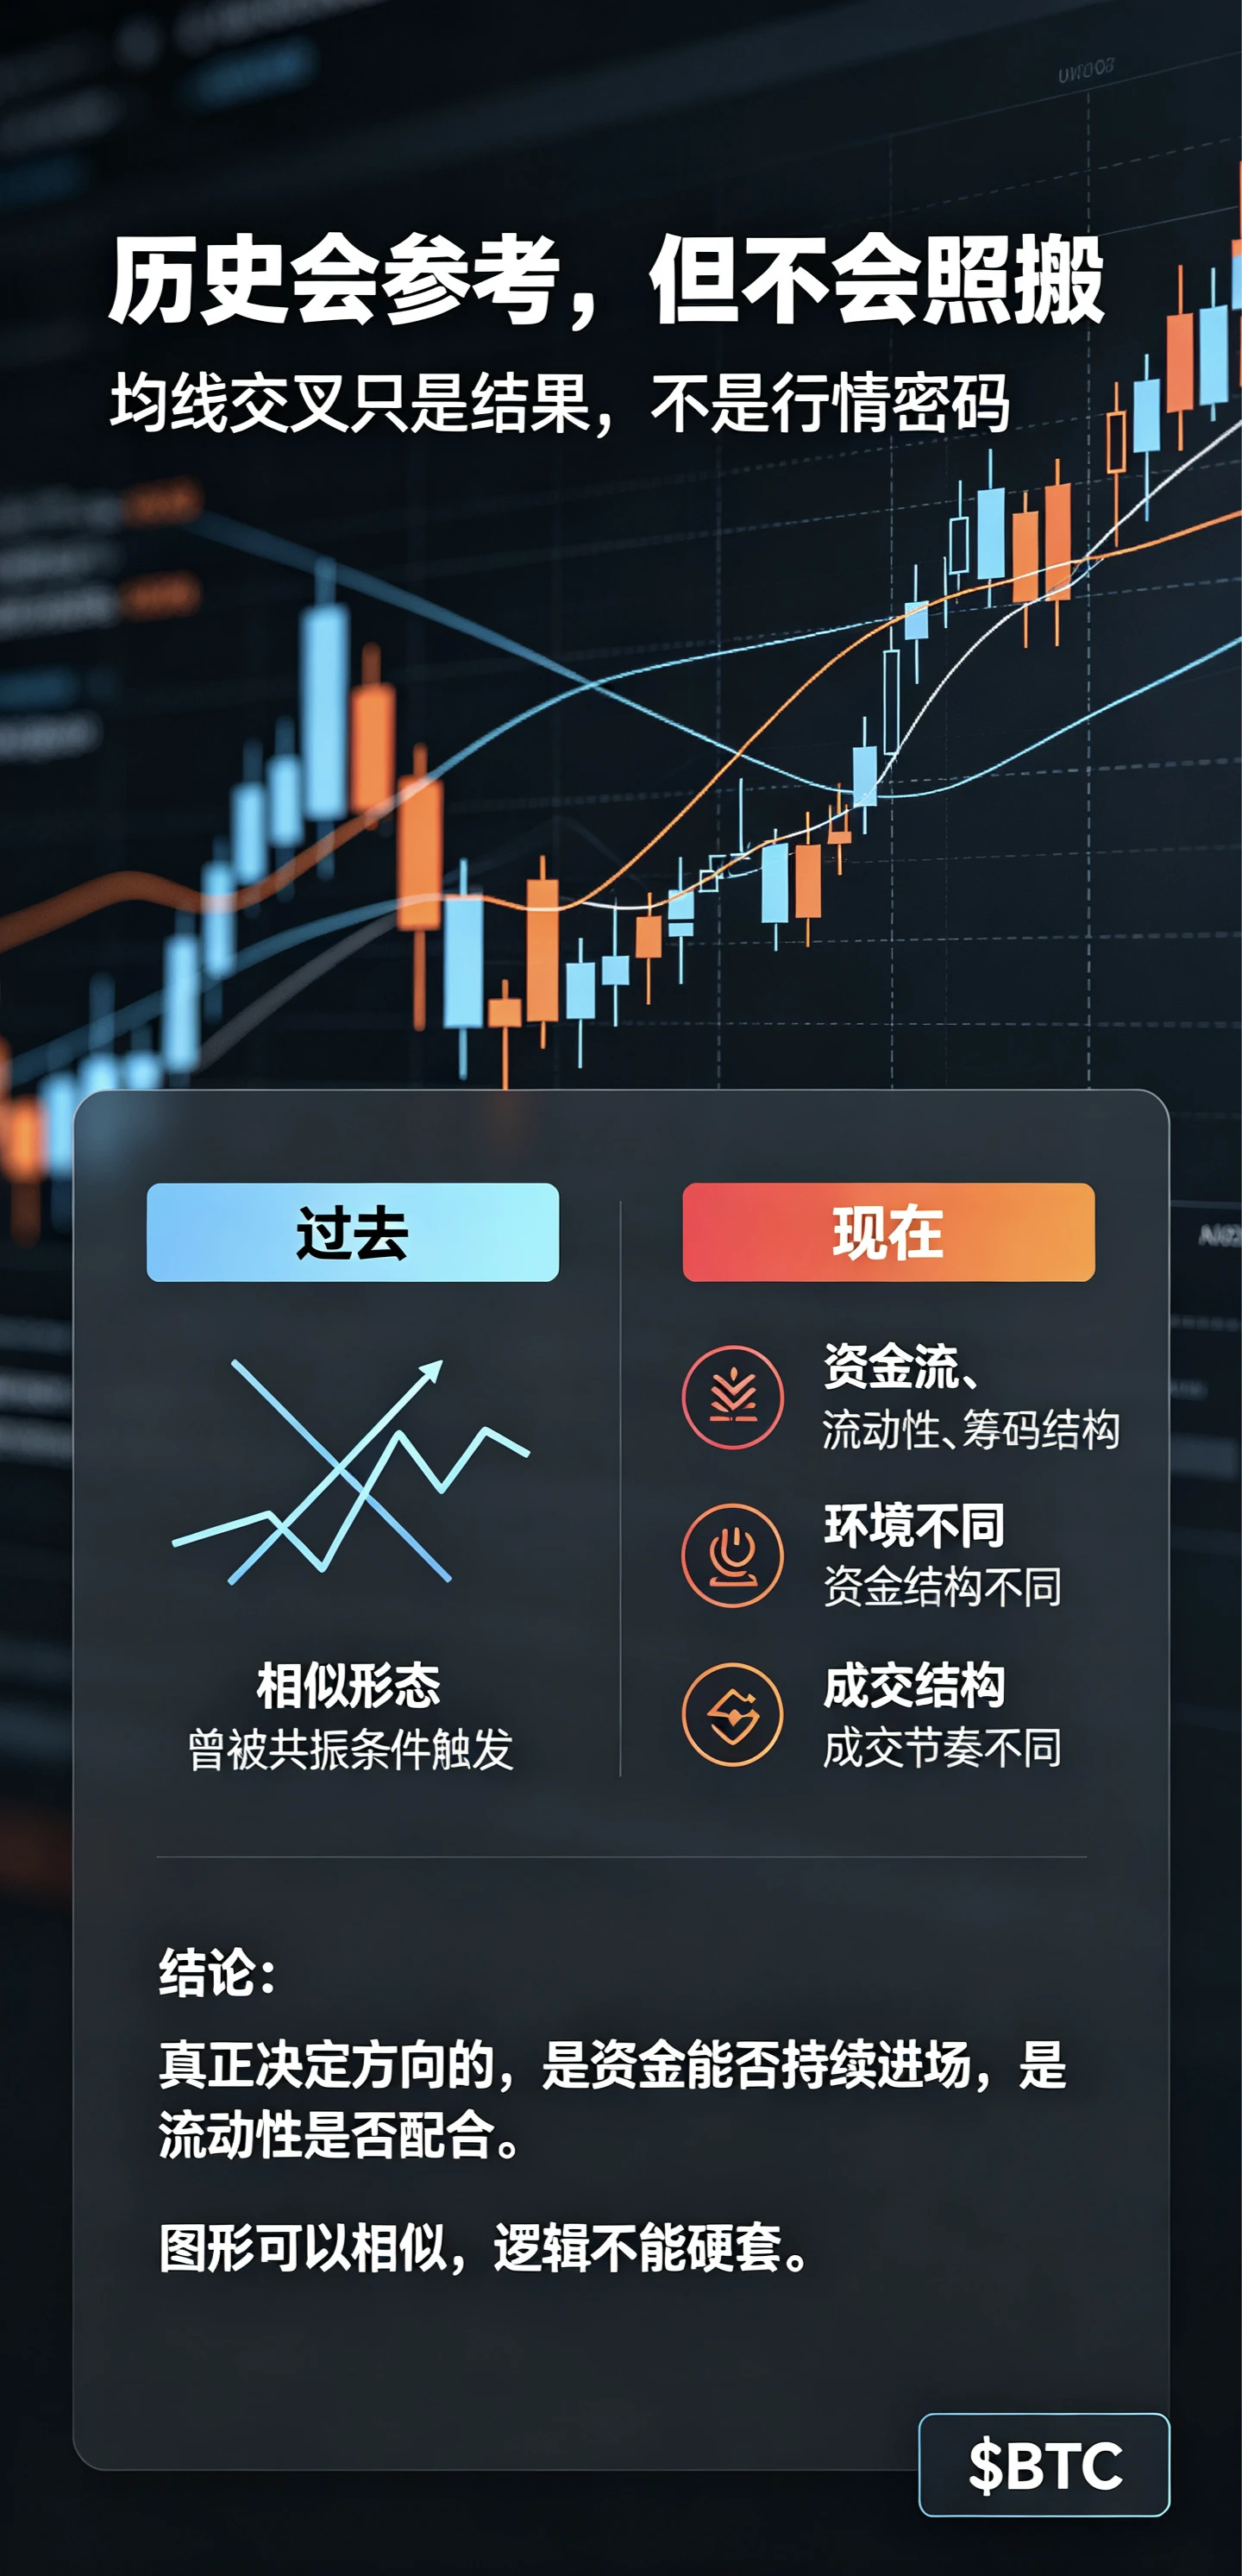
Title: History Repeats Itself, but Not Exactly
When reviewing longer-term daily charts, people often use moving average signals to compare with past market trends. Many see moving averages cross and immediately compare it with the start of the previous bull market, hoping to replicate the earlier rally.
$BTC
The moving average golden cross in 2023 was driven by the convergence of specific crisis events, a shift in liquidity, and other factors. Today’s macro environment, capital dynamics, and market positioning are very different from those of that time. Even when moving averages cross in the
post-image
BTC-0.65%
ETH-1.23%
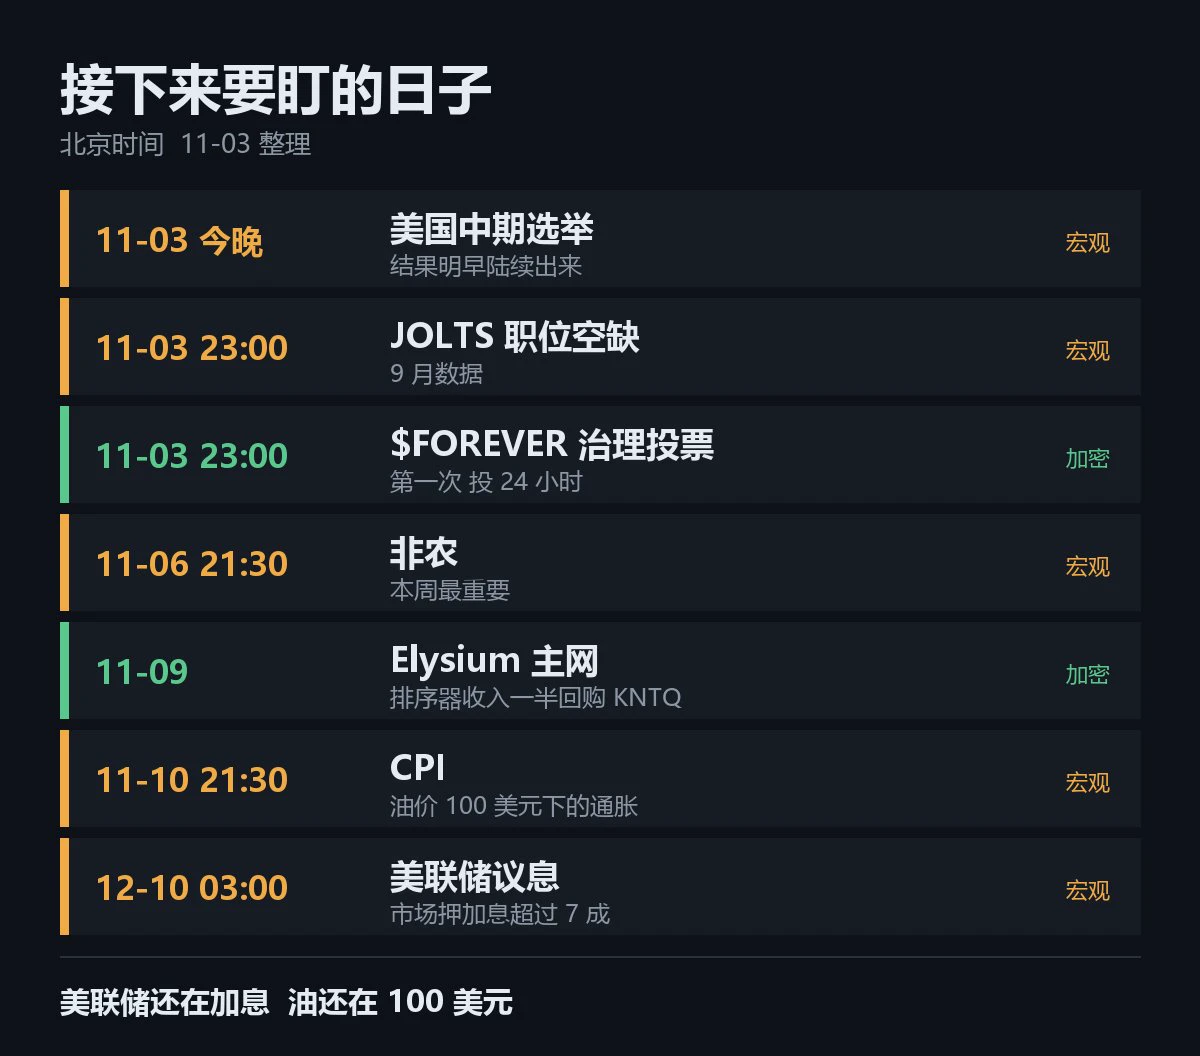
A few key events to watch this month
Tonight: U.S. midterm election results, out tomorrow morning
11-06 Friday 21:30 Nonfarm payrolls
11-09 Elysium mainnet
11-10 21:30 CPI
12-10 at 3 a.m. Fed rate decision
The Fed is still hiking, and oil is still at $100
Don't expect macro to help during this period
Volatility is high around data releases; don't use too much leverage
post-image
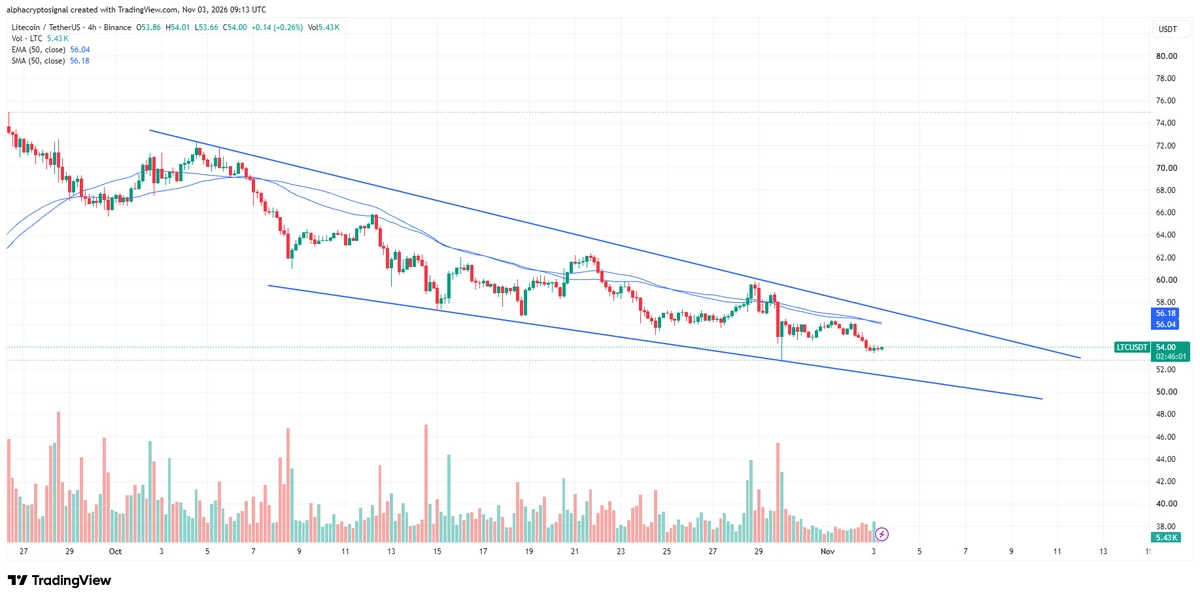
$LTC is trading inside a descending wedge, with price approaching the lower boundary. Watching for a potential bounce from here, but a breakout above the upper trendline would be the key bullish confirmation.
A confirmed breakout could signal a trend reversal and open the door for further upside. Keeping $LTC on the radar for a potential long setup.
post-image
LTC-0.07%
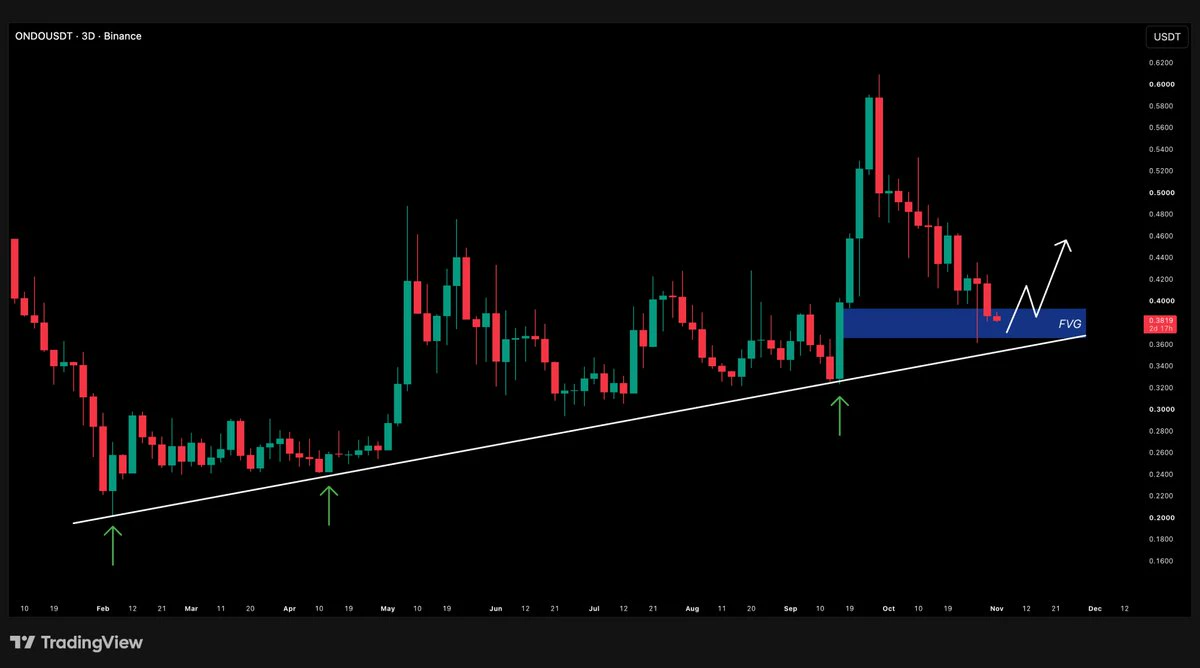
$ONDO has fallen around 38% from this year’s peak.
Now it’s back at an interesting area
Sitting on a bullish trendline and an FVG at the same time.
Could be a good spot for a bounce.
post-image
ONDO-0.29%
#GateWCTCS9GlobalTradingCompetition
#WCTCS9
Daily Crypto & Markets Digest — Nov 2
📌 Editor’s pick
Key theses and potential market impact.
🧭 Today’s focus
▸ Global markets
Thesis: Major US stock indices declined; Intel fell roughly 29%; concerns over AI spending and cash flow intensified; BTC traded near $78,000 after a major exchange security incident.
Impact: Risk appetite remains fragile; tech equities and crypto stay sensitive to liquidity and security headlines; short-term volatility is likely elevated.
▸ Asian markets
Thesis: Tech stocks remained under pressure; Nikkei 225 fell about
post-image
INTC-8.94%
BTC-0.67%
JPN225-0.17%
XAU+0.38%
ETH-1.26%
Back to Web2. Day 1, of course, is sneaking into the anime club to read manga
post-image
Good morning
It's a new chapter, let's go and get the bags
Can I get a GM back
post-image
#Ethereum Weekly outlook.
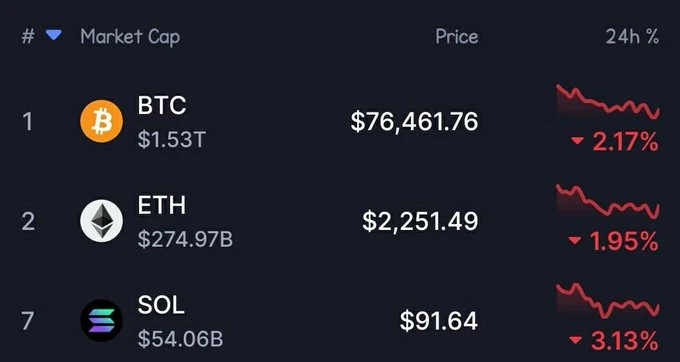
Folks $ETH 4 weeks ago it closed at 2,537; today it’s around 2,255, below the 50-week average of 2,304. The weekly RSI is 48, neither oversold nor overbought.
The first key area below is 2,129, which has held 12 times on the daily chart. If it’s lost, the February low of 1,800 and the June low of 1,506 come into play.
Above, 2,304 must be reclaimed first, followed by the 200-week average at 2,559 and the September high of 2,807. It’s too early to call it a recovery before the weekly close moves back above 2,304.
This is not investment advice.
ETH-1.26%
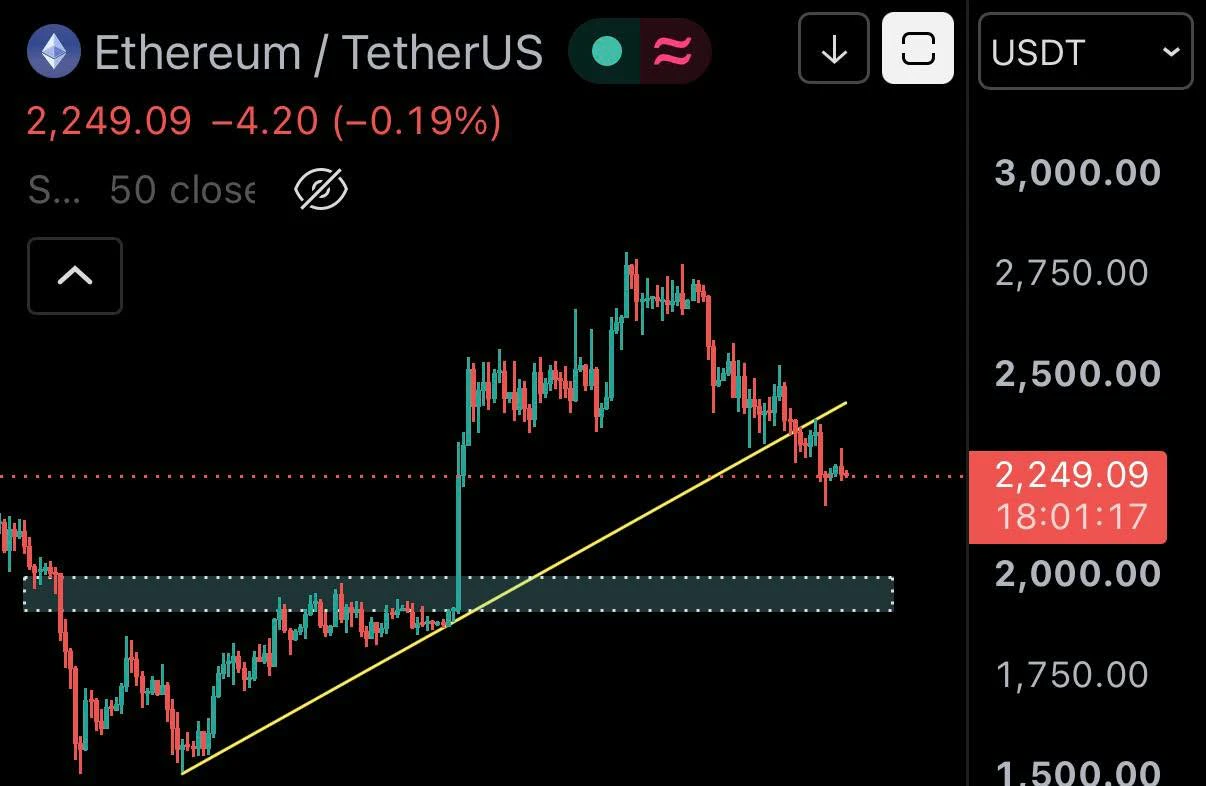
$ETH has broken below a key trendline support, and more downside could be ahead.
I'm watching the $2,200–$2,000 zone for a potential bounce.
#USMidtermsVoteToday
#GateRanksTop2AcrossMultipleCategories
post-image
ETH-1.26%
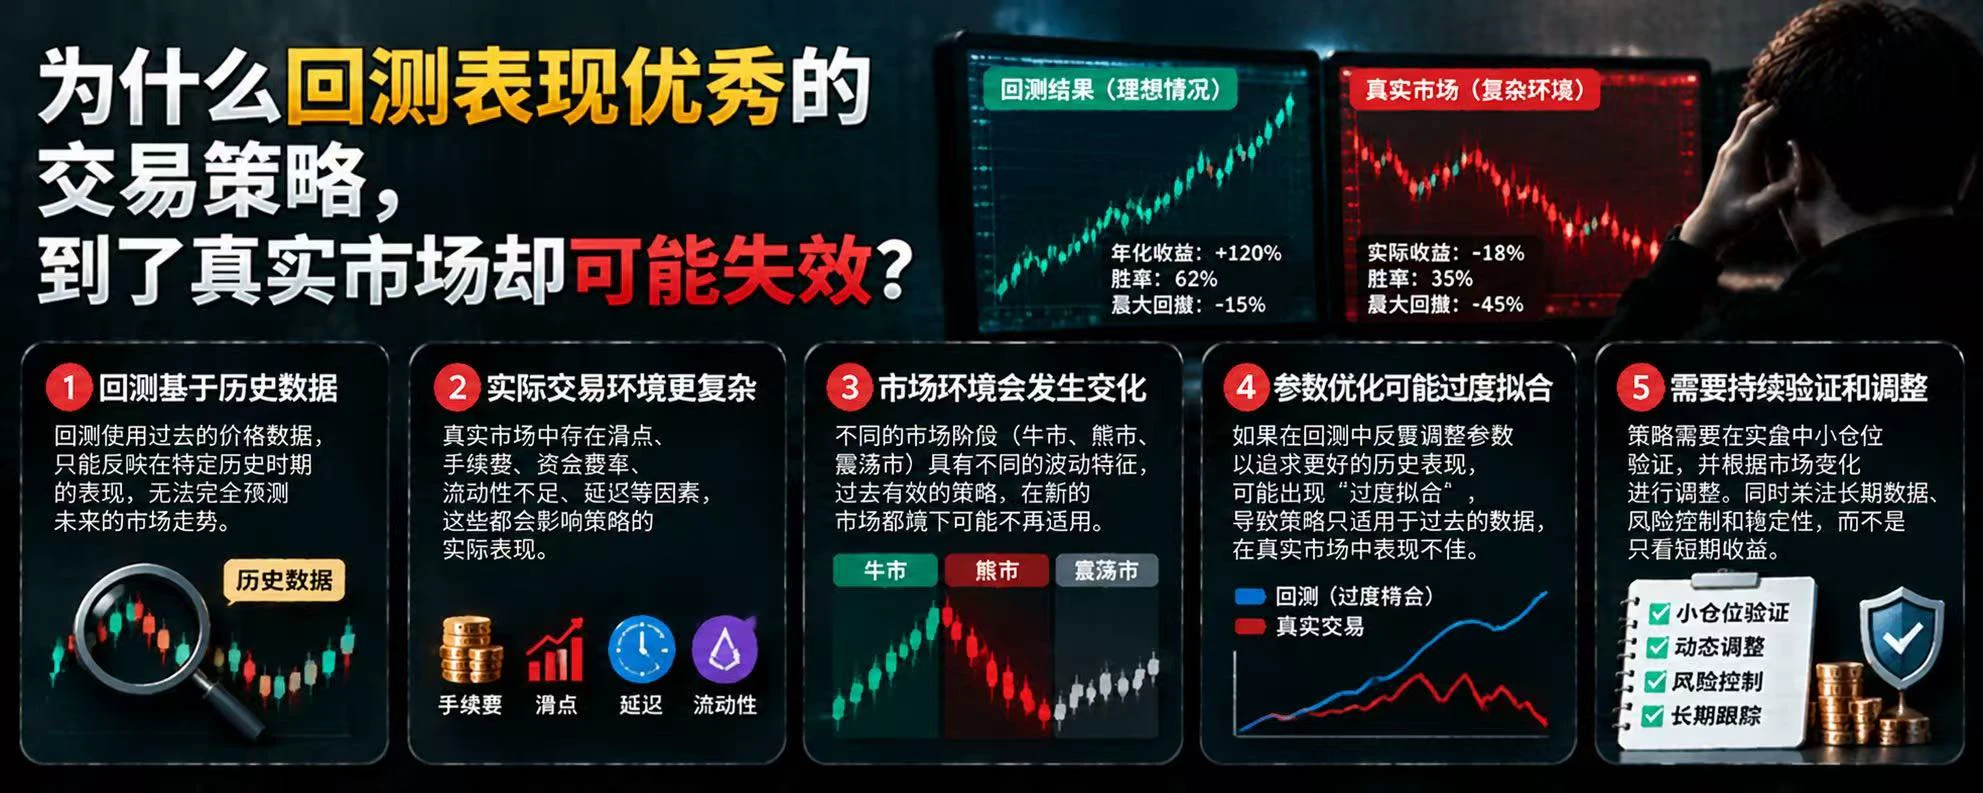
Why might a trading strategy that performs well in backtests fail in the real market?
A trading strategy may deliver strong returns and a high win rate in historical backtests, and even keep its maximum drawdown under control, yet produce a very different result when actually deployed in the market. The problem may not lie with the strategy itself, but with the gap between backtesting and live trading.
First, historical data does not represent the future. Backtesting can only assess a strategy’s performance under specific historical market conditions. Market structure, volatility, and particip
post-image
$INTC Could it possibly fall back to pre-Chinese New Year levels?
post-image
INTC-8.94%
U.S. stocks suffer an “A-shaped” crash! Intel falls another 9, while two optical communications lead
live-cover
LIVE2,329
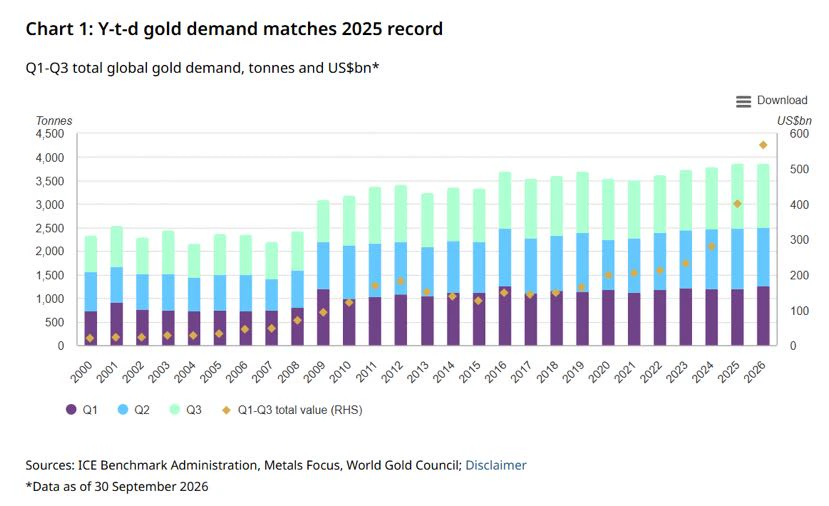
Gold $XAU has some noteworthy data out today 🤨
The World Gold Council just released its third-quarter report, cutting its forecast for growth in gold investment demand this year from 400 tons to 200 tons
But on the other hand, global central banks made net purchases of 321 tons of gold in the third quarter, up 42% year over year, while gold ETFs also recorded net inflows of 211 tons 😯
A major divergence here:
Ordinary investors' enthusiasm for buying gold bars and coins has cooled noticeably, while central banks and ETFs continue to allocate to gold
Central bank gold purchases in particular
post-image
XAU+0.38%
  • 3
Crypto was supposed to make us rich.
post-image
Load More

Join 40 M users in our growing community

⚡️ Join 40 M users in the crypto craze discussion

💬 Engage with your favorite top creators

👍 See what interests you

Trending Topics

USMidtermsVoteToday

18.89k Views737 Discussing

The U.S. midterm elections are being held today, with all 435 House seats and 35 Senate seats on the ballot. The results will shape control of Congress and could influence future fiscal, economic and crypto regulatory policy. What are you watching most closely — control of Congress, fiscal policy or crypto regulation? Which market will price in the outcome first: U.S. stocks, gold or crypto?

GateRanksTop2AcrossMultipleCategories

4.48k Views2.99k Discussing

USEarningsSeason

451.6k Views3.31k Discussing

View More