Square
Following
Hot
News
Profile
Share your thoughts
placeholder
Article
HOT TRADER IS LIVE MORNING MARKET UPDATE
live-cover
LIVE2,394
Market update
live-cover
LIVE2,054
Trenches
ZIG
Z
bade
b
ZIG
0x8c...1145
Market Cap
$.
Change
.
24h Vol
$.
Holders
.
uni
u
bade
b
uni
jM9r...pump
Market Cap
$.
Change
.
24h Vol
$.
Holders
.
Anakin
A
bade
b
Anakin
Exxz...pump
Market Cap
$.
Change
.
24h Vol
$.
Holders
.
IDOL
I
bade
b
IDOL
0x3b...ab07
Market Cap
$.
Change
.
24h Vol
$.
Holders
BTC
B
bade
b
BTC
C5xp...pump
Market Cap
$.
Change
.
24h Vol
$.
Holders
.
This indoor playground has a nice atmosphere!
I often bring my child here to play.
Most importantly, it's safe, and they disinfect regularly.
I'm planning to get an annual pass.
post-image
Heard they wanna play hopscotch
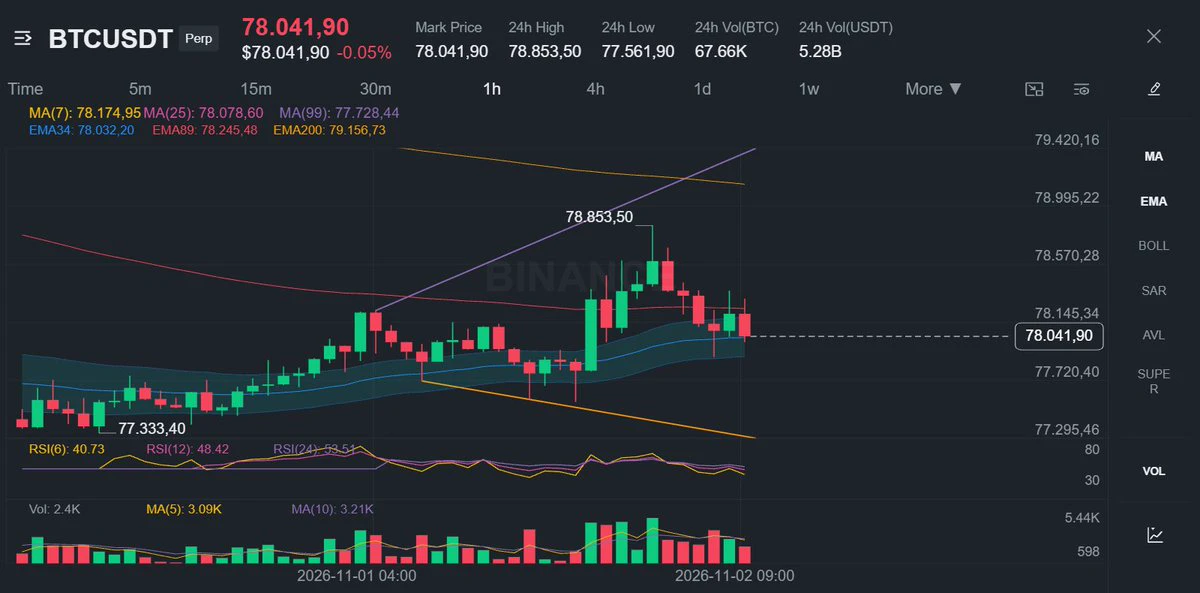
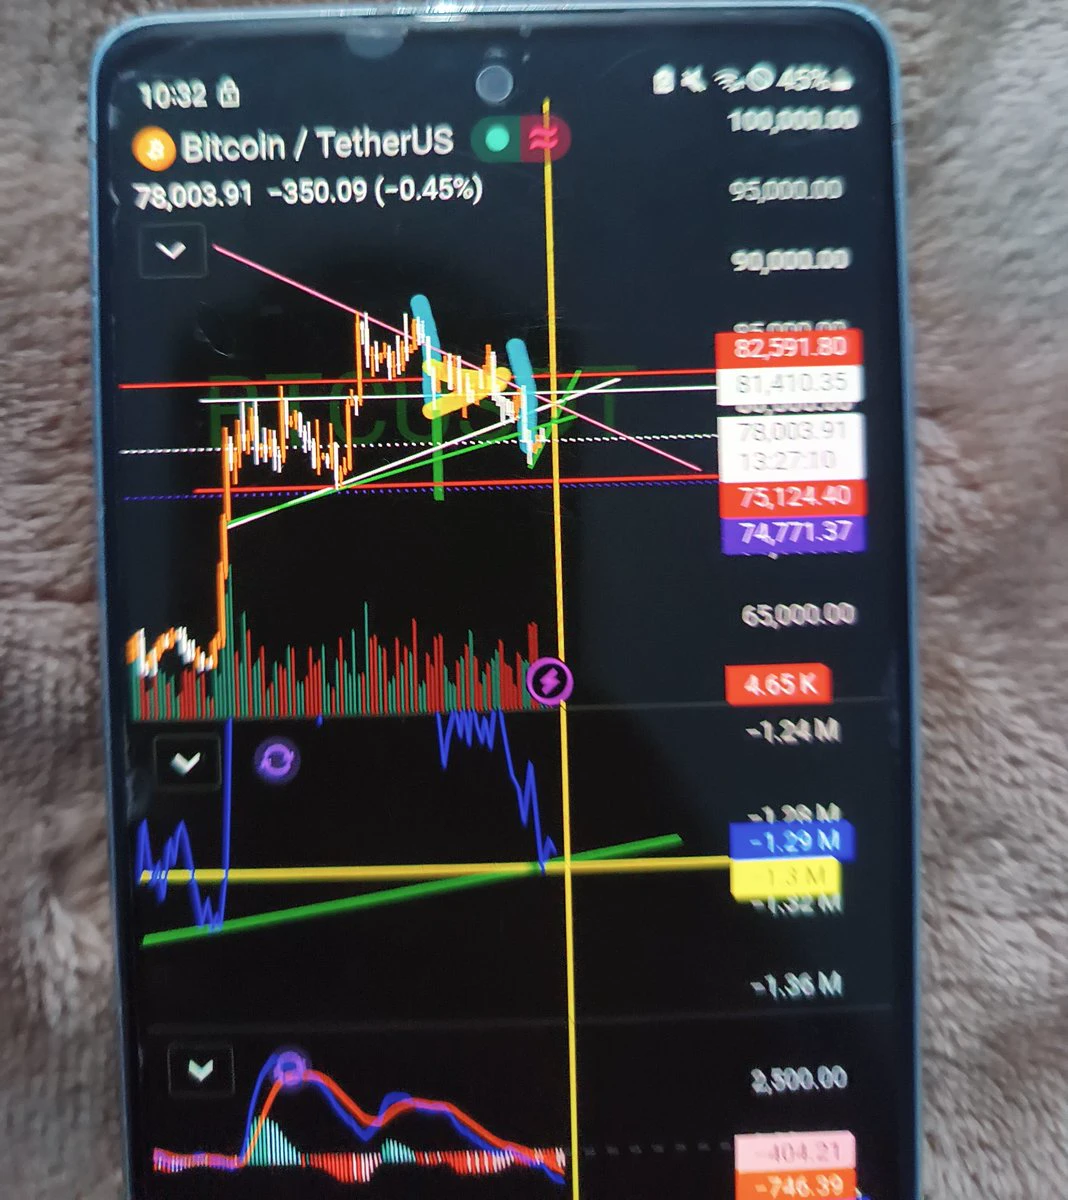
$BTC
post-image
BTC-0.67%
What is this cosplaying as again? Halloween 🎃👻
post-image
#GateWCTCS9GlobalTradingCompetition #WCTCS9
Ethereum Market Analysis: Navigating the Recent Downturn
Ethereum investors have faced a challenging market environment recently. Recent data shows that ETH declined by 16.1% in October. This marks the second worst performance for this month since 2016 and abruptly ends a three month growth streak.
Here is a breakdown of the current technical landscape and what investors should prepare for.
Daily Chart Breakdown
On the daily timeframe, the overall structure is currently bearish. The price has dropped from a recent local high near 2,800 and is now tr
ETH-1.26%
  • 8
What Is the Sharpe Ratio? Why Isn’t a Higher-Returning Strategy Necessarily the Better Choice?
In the cryptocurrency market, some trading strategies deliver high annual returns but come with sharp drawdowns, while others generate relatively steady returns and have more stable equity curves. Comparing only how much money a strategy ultimately made may not fully capture its quality. That’s where the Sharpe Ratio can be useful.
First, what is the Sharpe Ratio?
The Sharpe Ratio measures the relationship between the excess returns an asset or strategy earns over the risk-free rate and the degree of
post-image
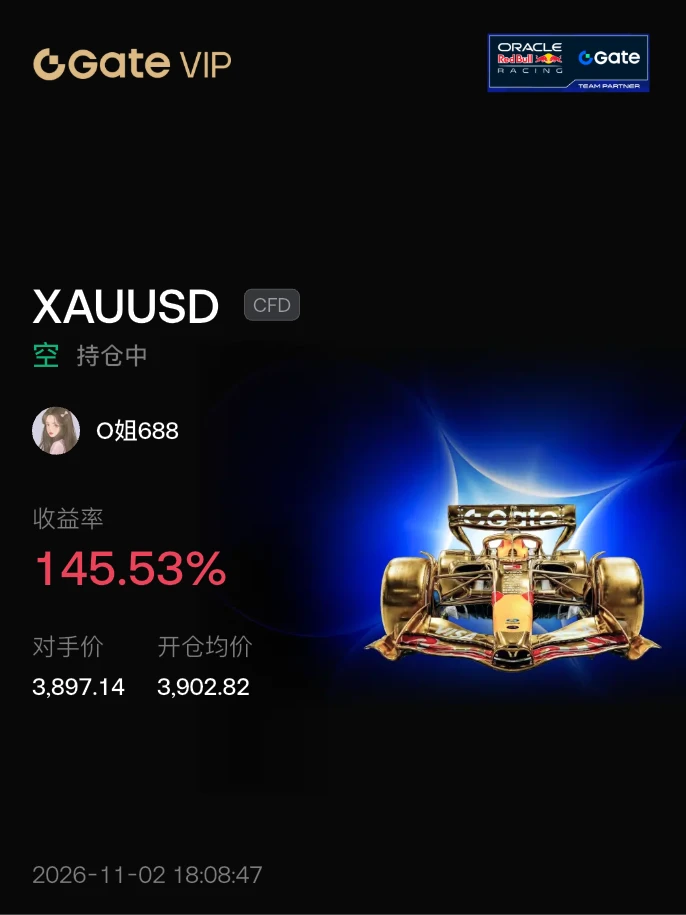
#晒出我的持仓收益 Gold CFD scalping, swing trading, trend trading, live at 18:30, ETH, trending, stock contracts, mainstream
post-image
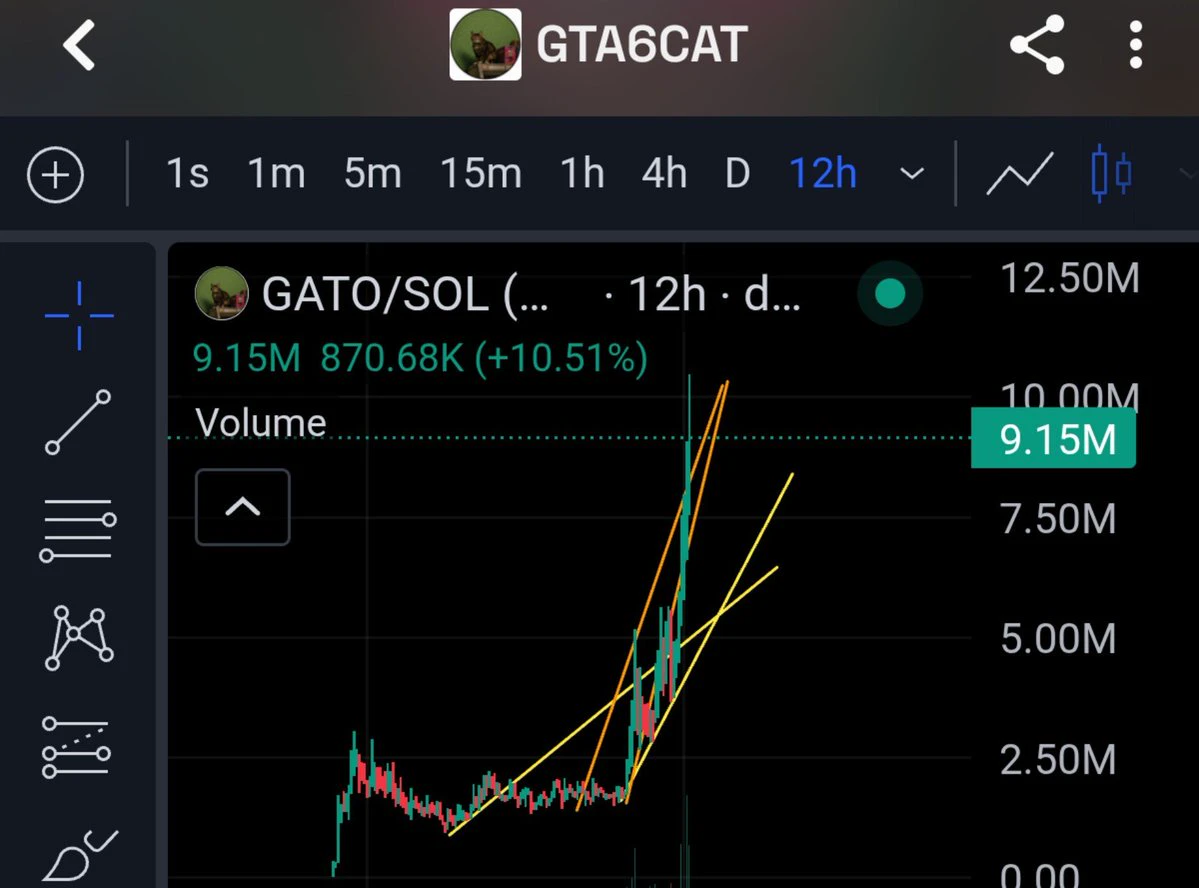
They've actually started to paint real charts now
$GATO
post-image
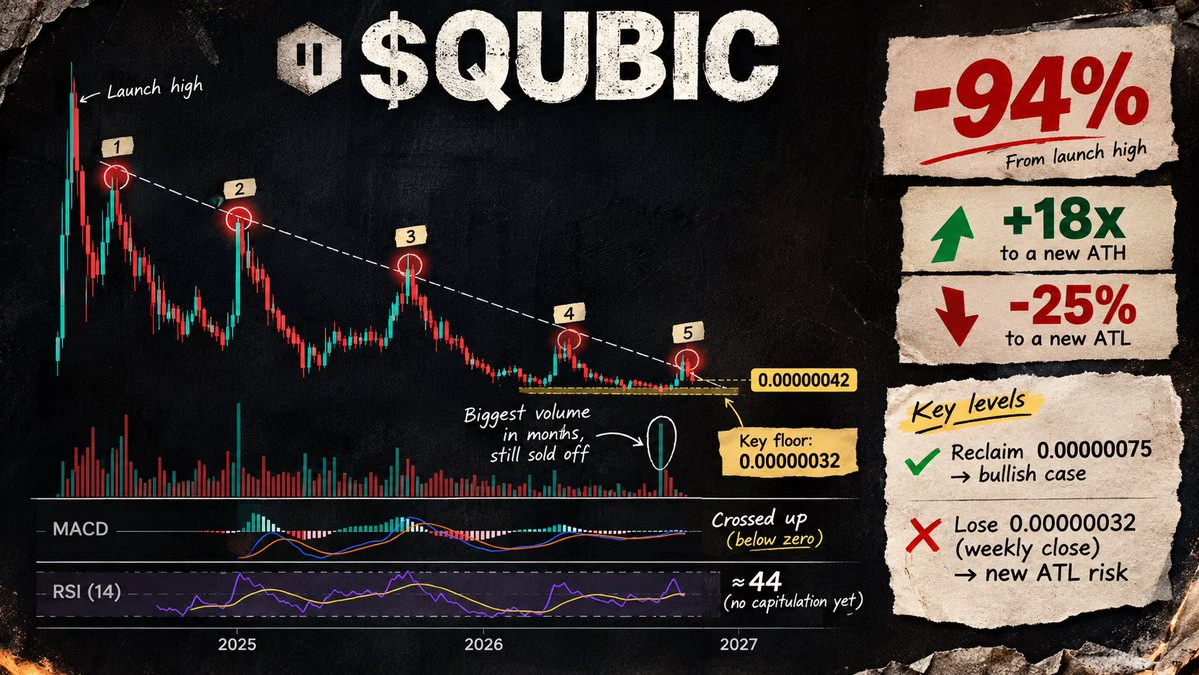
$QUBIC is one rough week away from a new all time low and one miracle away from a new all time high.
From the launch spike high, price is down roughly
94%
A new all time high needs about
18x
A new all time low needs a drop of roughly
25%
Every rally on this chart has topped lower than the one before it. Five peaks, five lower highs.
The latest bounce printed the biggest volume bar in months and still got sold straight back into the range. That is supply waiting at every pump.
To be fair, MACD just crossed up below zero. But RSI sits near 44, so the capitulation flush that usually marks a real
post-image
QUBIC-3.39%
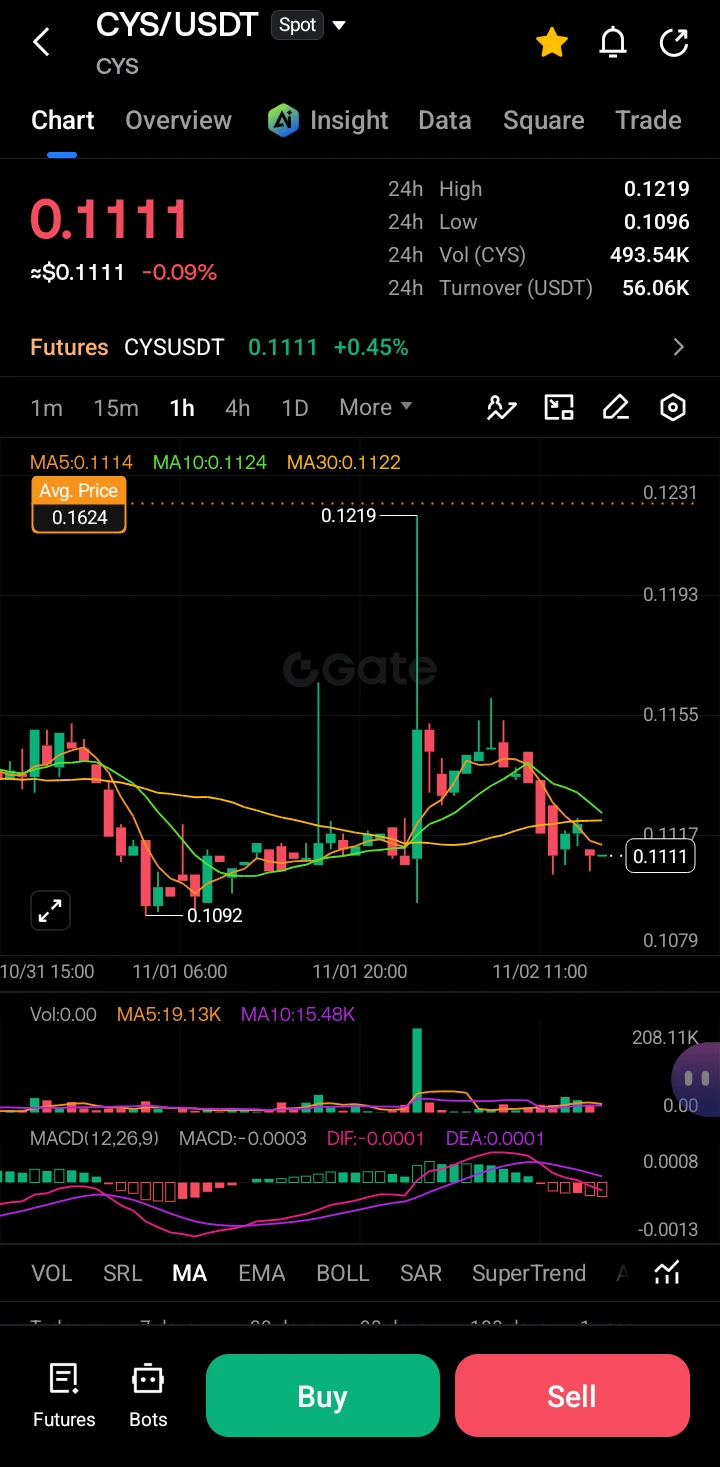
$CYS ‌
CYS is currently trading at 0.1111, consolidating in a tight range after a period of volatility. The market is showing indecision, with price action compressing near the moving averages, indicating a buildup of energy for a potential breakout. Volume is relatively low, suggesting traders are waiting for a clear directional trigger.
· Resistance: 0.1155 (recent local high), 0.1219 (major spike high).
· Support: 0.1092 (recent swing low), 0.1079 (lower structural support).
The 1H chart shows a prior massive pump to 0.1219 followed by a sharp retracement. Currently, the price is forming a
post-image
CYS-0.35%
  • 6
  • 2
Next Technology Authorizes Sale or Pledge of 5,833 BTC After Risk Review
Next Technology Holding has authorized management to sell or pledge its reported 5,833 BTC, but that flexibility does not confirm a transaction has taken place.
The move follows a board review of custody and market risks. The company disclosed the authorization on October 30, when it reported holding approximately 5,833 BTC. The announcement, distributed through GlobeNewswire, explicitly allows transactions in one or more tranches through exchange sales, negotiated block trades, or pledging Bitcoin to obtain financing.
⚠️
post-image
BTC-0.67%
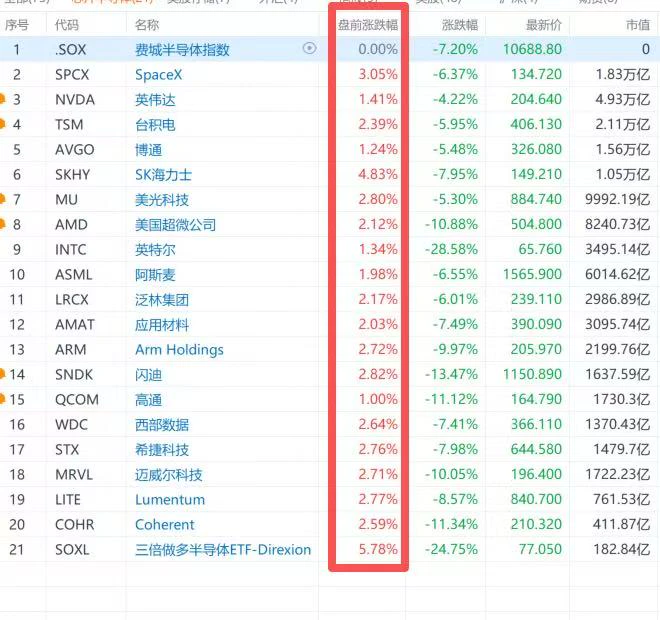
U.S. stock premarket: Storage chip stocks surge at the open; is tech entering a recovery window?
There was no major news over the weekend. The main development was Qatar pushing for U.S.-Iran talks, while international oil prices fell.
Everyone is waiting for the U.S. market to open and show its reaction. So far, the overall trend is one of recovery, but compared with last week's declines, these gains have yet to signal a reversal.
South Korean stocks are broadly higher today, lifting storage chip stocks at the open. SK Hynix is up nearly 5% premarket. The U.S. premarket picture is already cle
post-image
SNDK-0.18%
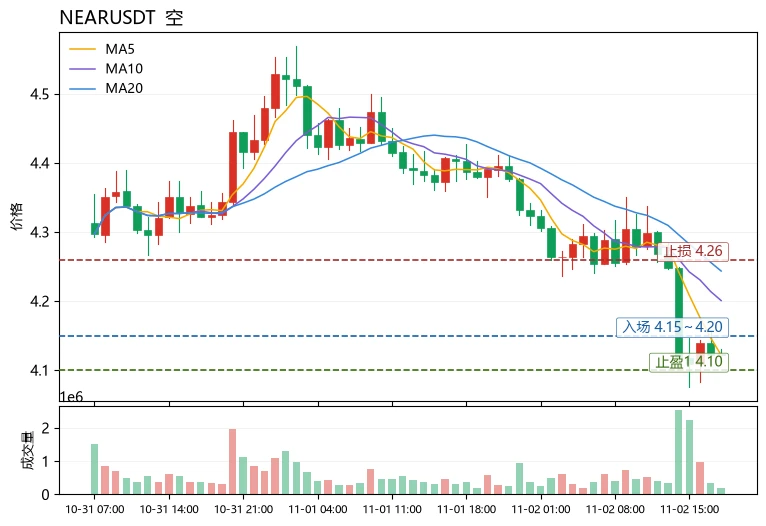
$NEAR Is now the time to buy the dip? The answer is cautious: the fund flow structure remains bearish, but the short term has entered an oversold trading zone.
$NEAR Current price: 4.122, down 6.38% in 24h. MA5 at 4.1218 has fallen below MA20 at 4.24335, with the moving averages in a bearish alignment. RSI is just 31.0, nearing oversold territory, while the MACD histogram at -0.01424 shows bearish momentum is still being released. The key contradiction lies in the funding rate: at +0.0100%, it is positive, indicating that contract longs are still paying to hold positions even as the price con
post-image
NEAR+1.17%
CELO+1.37%
LSK-5.32%
He was just another Silva
#LulasArmyOnFantástico
post-image
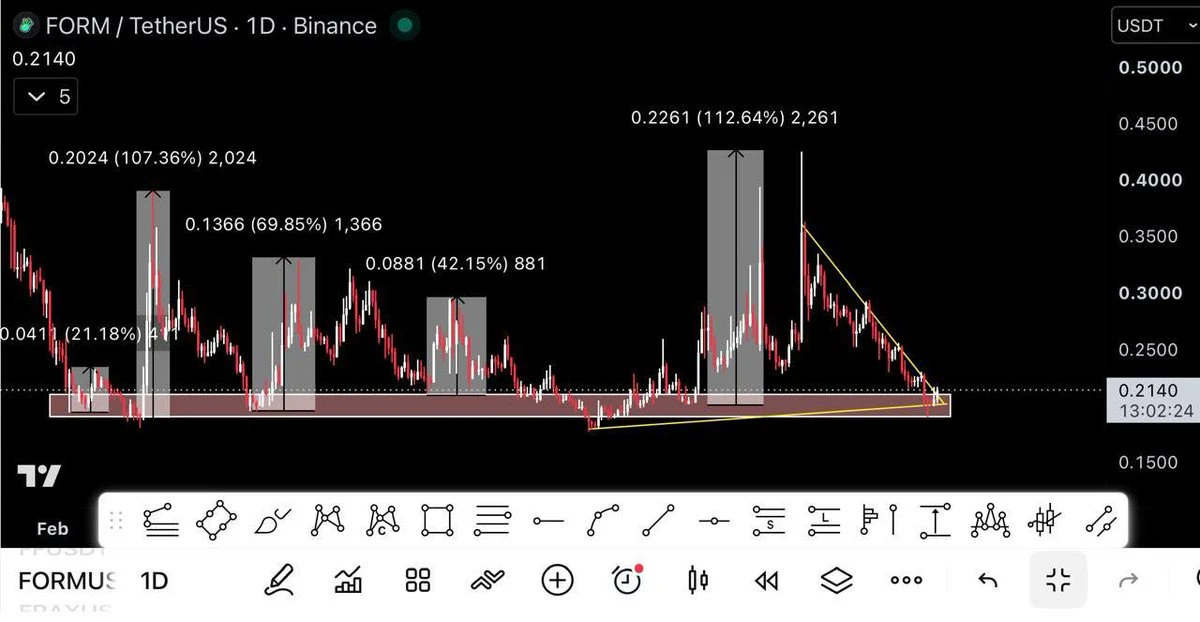
$form will Pump to 0.23-0.25 from Here
Best Chart in whole market
Easy 20-30% 🧲
post-image
PUMP-1.06%
🔥 $INIT Major shorting opportunity: INIT has shown strong bearish momentum after repeated rejections at the previous resistance zone. The price is currently trading around 0.14757, down more than 19% over the past 24 hours. Sellers have regained control, driving the price sharply lower after it failed to hold the previous high of around 0.22000. Trade idea: Short $INIT Entry: 0.14750 – 0.15300 Take-profit 1: 0.10899 Take-profit 2: 0.09563 Stop-loss: 0.19588 Take-profit 3: 0.06851
post-image
INIT-2.53%
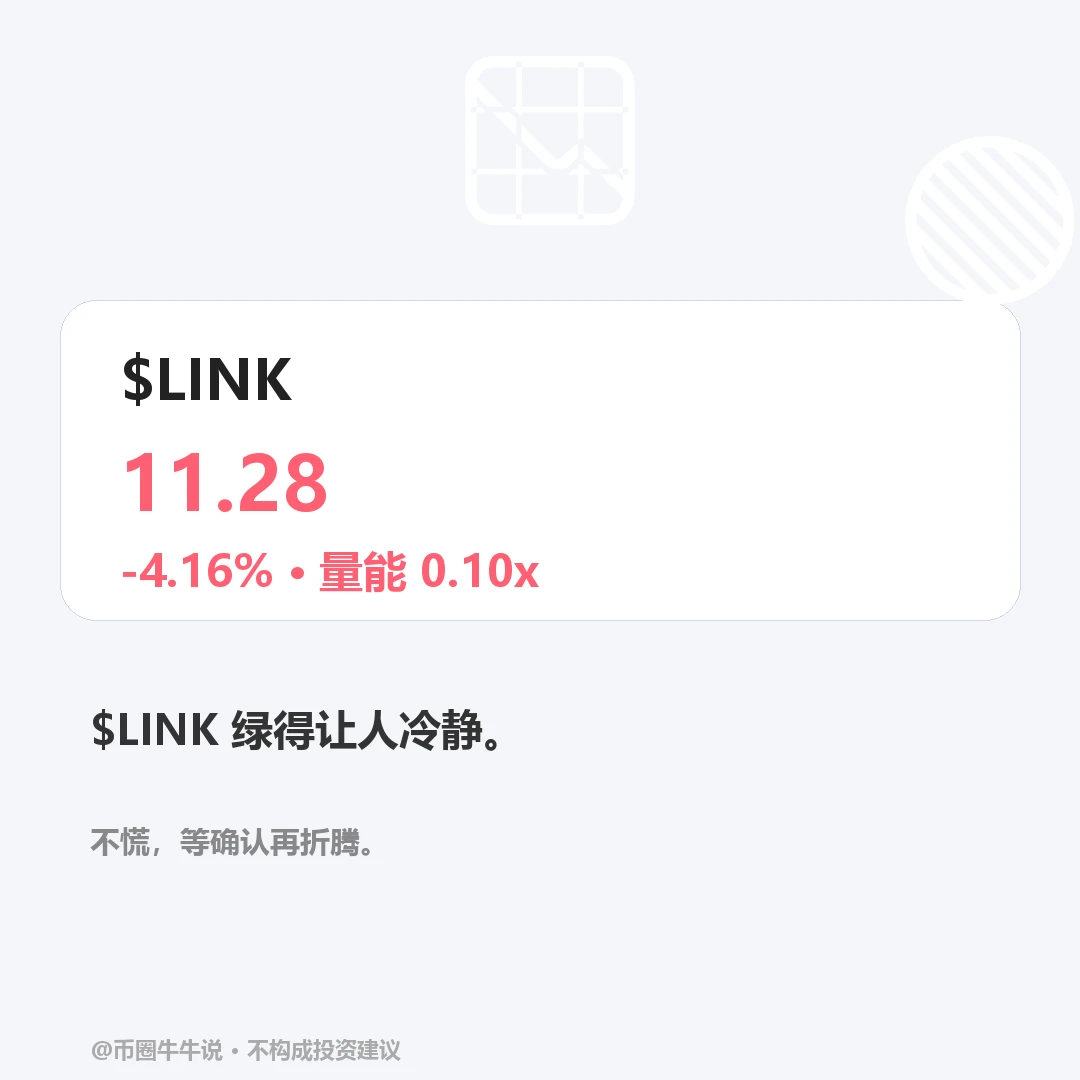
Weak, but the credibility of $LINK ’s decline is undermined by volume. The current price is 11.279, with hourly trading volume below one-tenth of normal. The direction is clear, but participation is not.
If there’s real force pushing prices down, why has volume shrunk to one-tenth of normal? The price is hovering near the hourly support at 11.226, and there’s still some distance to true short-term confirmation.
Only a break below support accompanied by rising volume would upgrade the weakness to valid confirmation; if the price consolidates above support on low volume, the bears have no eviden
post-image
@kanyewest Do you love this cat ?
post-image
Load More

Join 40 M users in our growing community

⚡️ Join 40 M users in the crypto craze discussion

💬 Engage with your favorite top creators

👍 See what interests you

Trending Topics

USMidtermsEnterFinalStretch

5.11k Views399 Discussing

The U.S. midterm elections are entering the final stretch, with control of both chambers of Congress still at stake. Inflation, energy prices, tariffs and economic policy remain key voter concerns, while the result could shape fiscal, trade and regulatory policy over the next two years. If the balance of power in Congress changes, which policies could be affected first? How might U.S. stocks, gold and crypto trade the election outcome? Are you watching fiscal policy, tariffs or crypto regulation most closely?

USEarningsSeason

422.54k Views3.12k Discussing

AppleQ3EarningsInFocus

3.95k Views493 Discussing

View More