

Square
Following
Hot
News
Profile
Share your thoughts
placeholder
Article
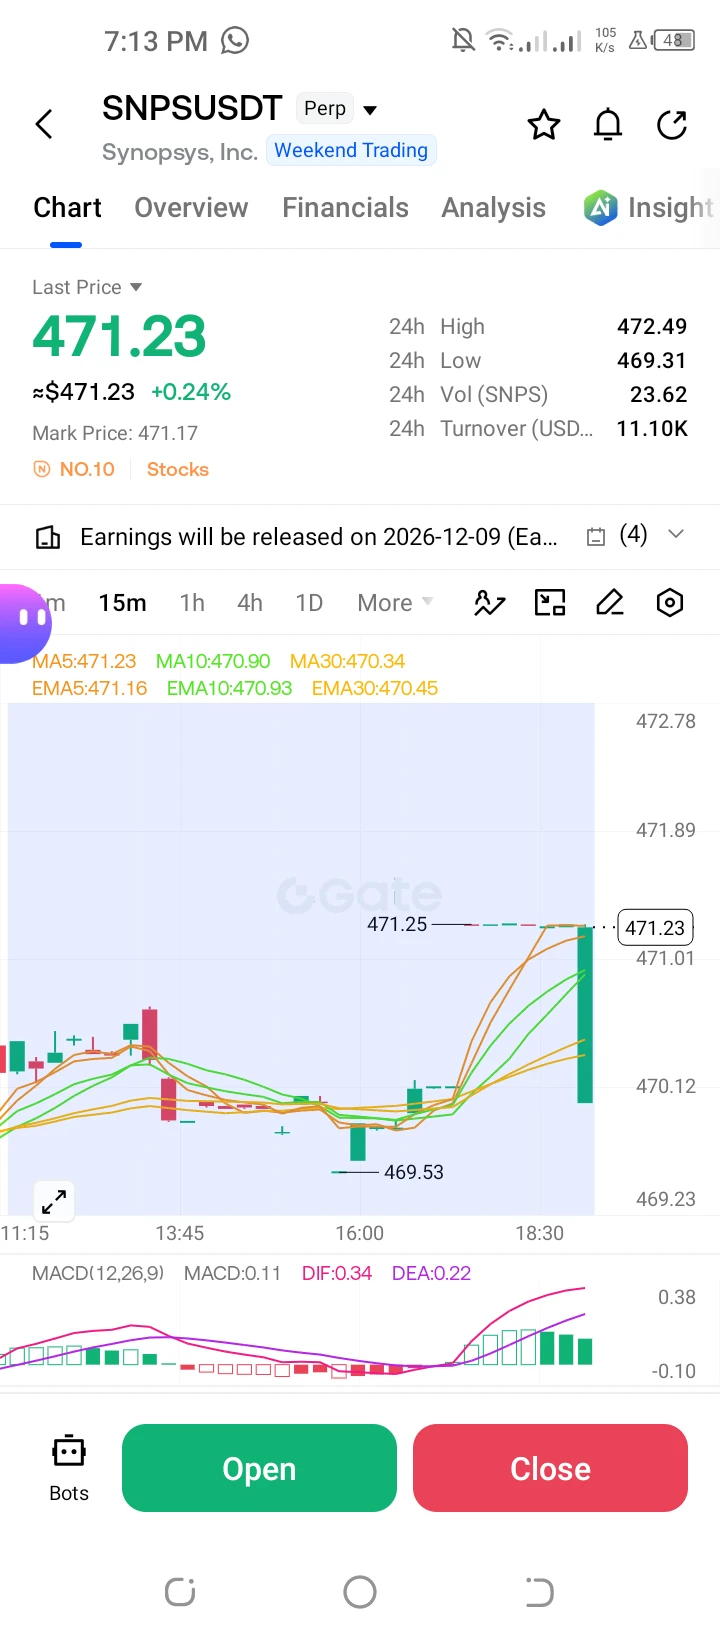
**$SNPS /USDT Perp – "Bullish Breakout – Long"**
Trading Plan Long $SNPS
Entry: 471.23
SL: 470.34
TP1: 471.89
TP2: 472.49
SNPS is up +0.24% and breaking out from the 469.53 low. MACD is bullish; targeting the 472.49 high.
post-image
SNPS-0.01%
People are panic-selling $UAI $UAI way too hard. The 15-minute chart is practically screaming for a breather and a decent rebound. Take profit: 0.1980Stop loss: 0.1629Hot coins:
$SOL : Current price 94.73 - 24-hour change: -1.25%
$ESPORTS : Current price 0.018129 - 24-hour change: +103.54%
post-image
UAI-7.58%
SOL-0.77%
ESPORTS-5.30%
Trenches
ZIG
Z
bade
b
ZIG
0x8c...1145
Market Cap
$.
Change
.
24h Vol
$.
Holders
.
KIM
K
bade
b
KIM
8pjf...pump
Market Cap
$.
Change
.
24h Vol
$.
Holders
.
Anakin
A
bade
b
Anakin
Exxz...pump
Market Cap
$.
Change
.
24h Vol
$.
Holders
.
BTC
B
bade
b
BTC
C5xp...pump
Market Cap
$.
Change
.
24h Vol
$.
Holders
.
IDOL
I
bade
b
IDOL
0x3b...ab07
Market Cap
$.
Change
.
24h Vol
$.
Holders
.
There are two types of people on listing day. Paper hands: Sells at $2, buys iPhone, posts on Instagram, broke in 2 months. Diamond hands: Holds, builds business, buys house in 2 years. Which story do you want to tell your kids? Honestly.
#PiNetwork
#ShareWeekly
#GateSquare
#WCTCS9
post-image
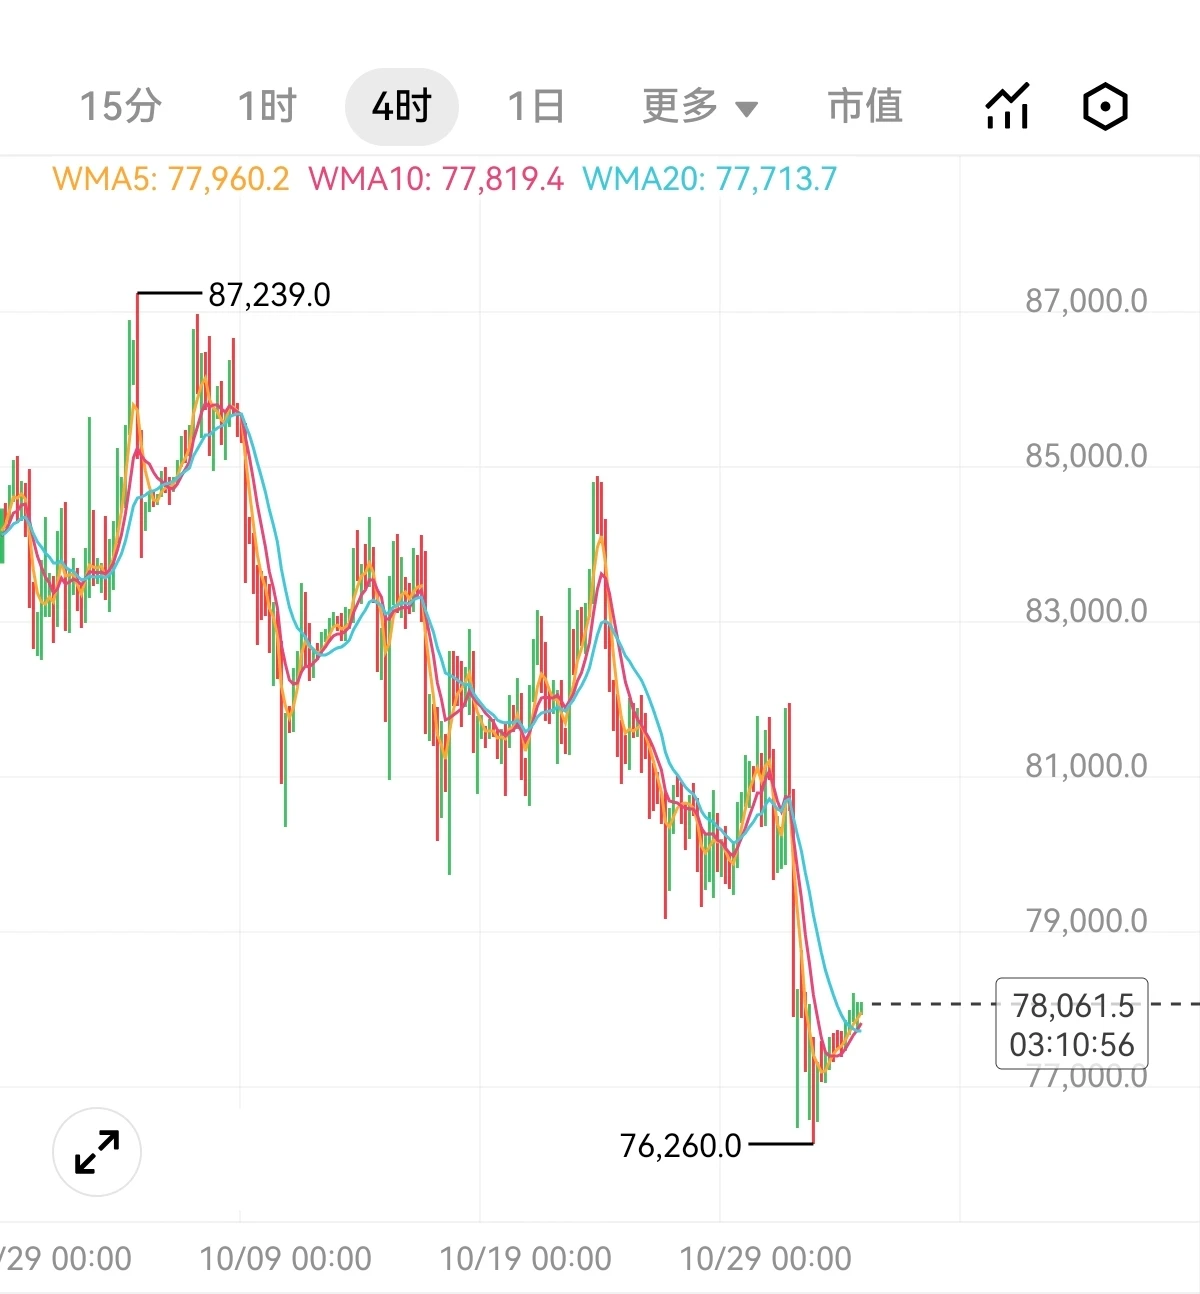
Will BTC break above 80,000 at Monday’s open or head toward 76,000? Let’s discuss.
The news flow is predominantly bearish, with US-Iran tensions running high and another round of attacks potentially triggered at any time. I believe everyone is ready for a move on Monday.
Looking at the price action, most of the bearish news is out of the way, yet the market has not made a major one-way move. Support at 75,000 remains intact. Personally, I’m more inclined to expect a rally toward around 79,000 early Monday, followed by a pullback under resistance at 80,000. A direct pullback is also possible. S
post-image
BTC-0.67%
ETH-1.26%
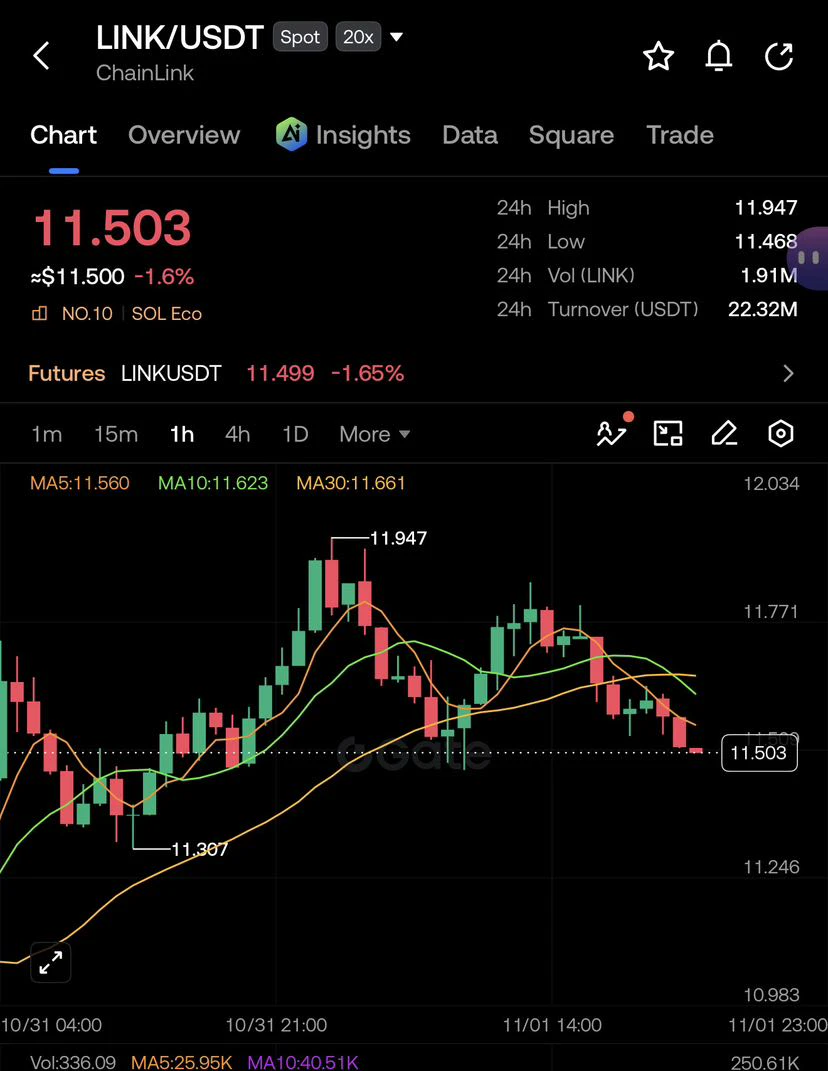
$LINK is currently trading at $11.503.
Chainlink is showing renewed market activity as traders monitor its next move. Can LINK maintain its momentum and push toward higher levels? Keep watching!
post-image
LINK-0.18%
  • 5
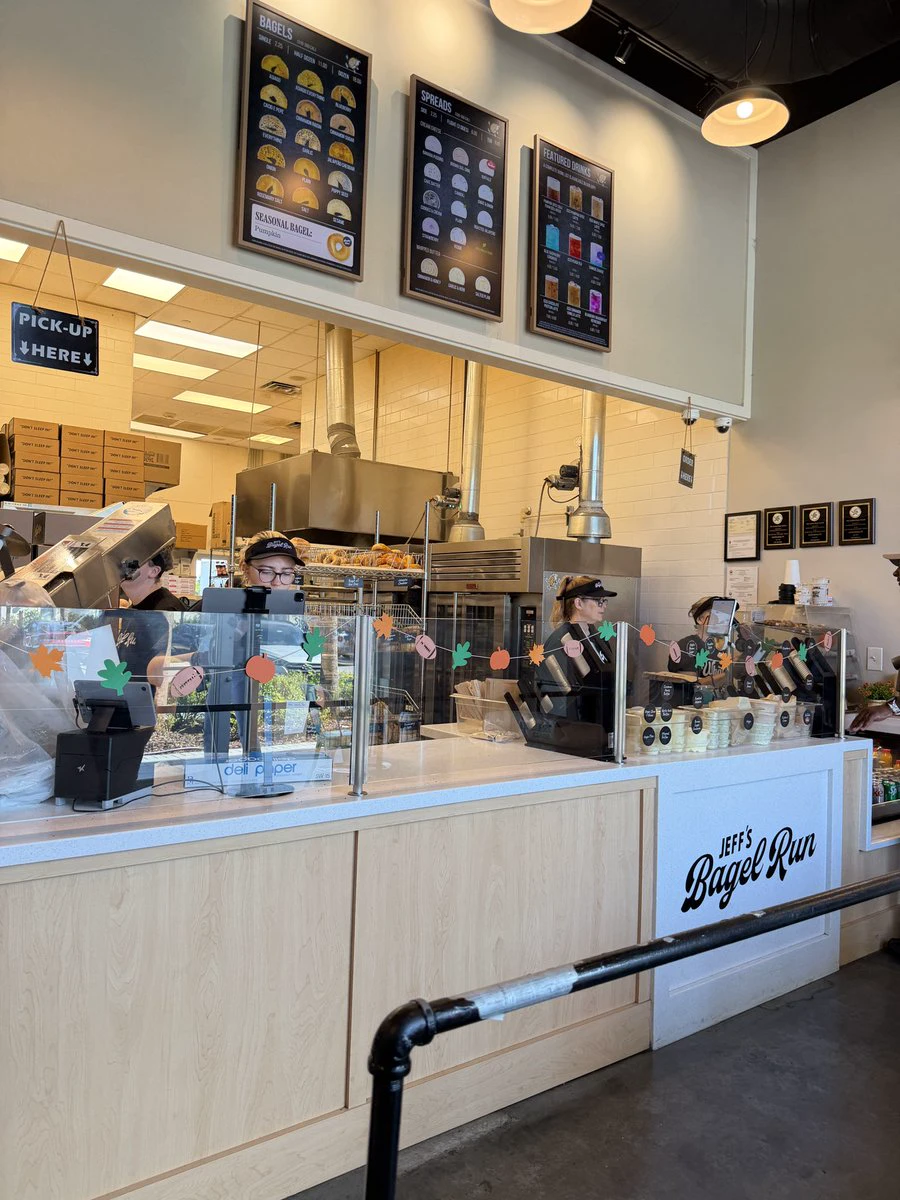
Happy Sunday Friends 🥯 ☕️
post-image
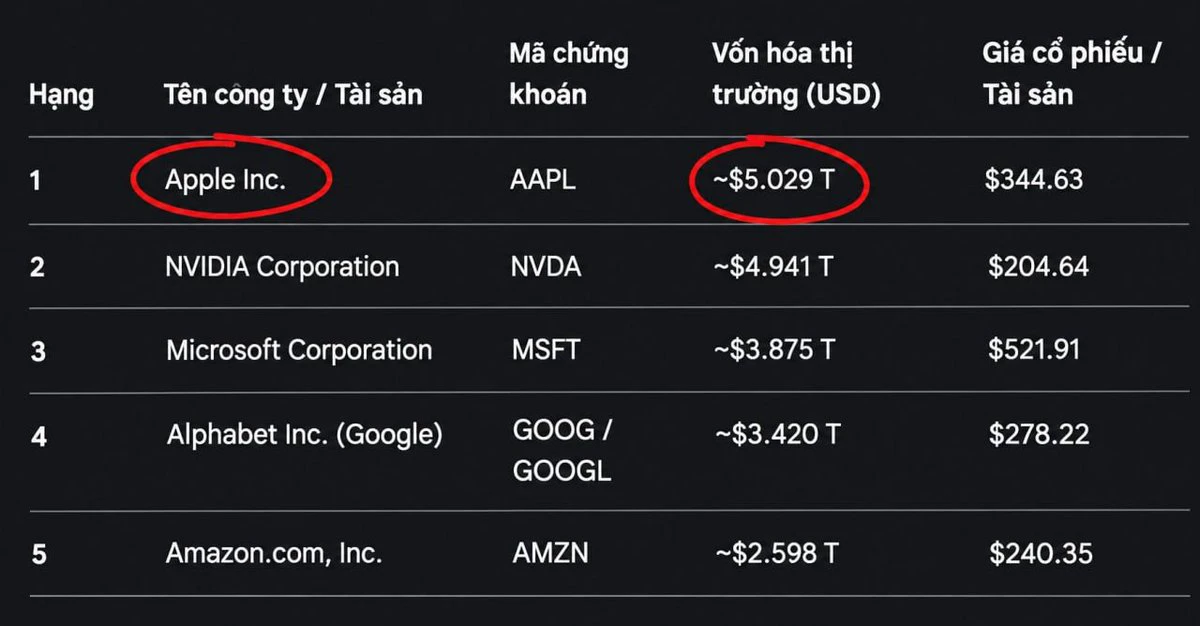
Apple overtakes Nvidia to return to the top spot as the world’s most valuable company
Sometimes not chasing AI is an advantage
post-image
AAPL-1.18%
NVDA-4.16%
XRP market update
live-cover
LIVE2,167
Intel shares plummeted 28.58, wiping out approximately $12 billion in value from U.S. government hol
live-cover
LIVE2,021
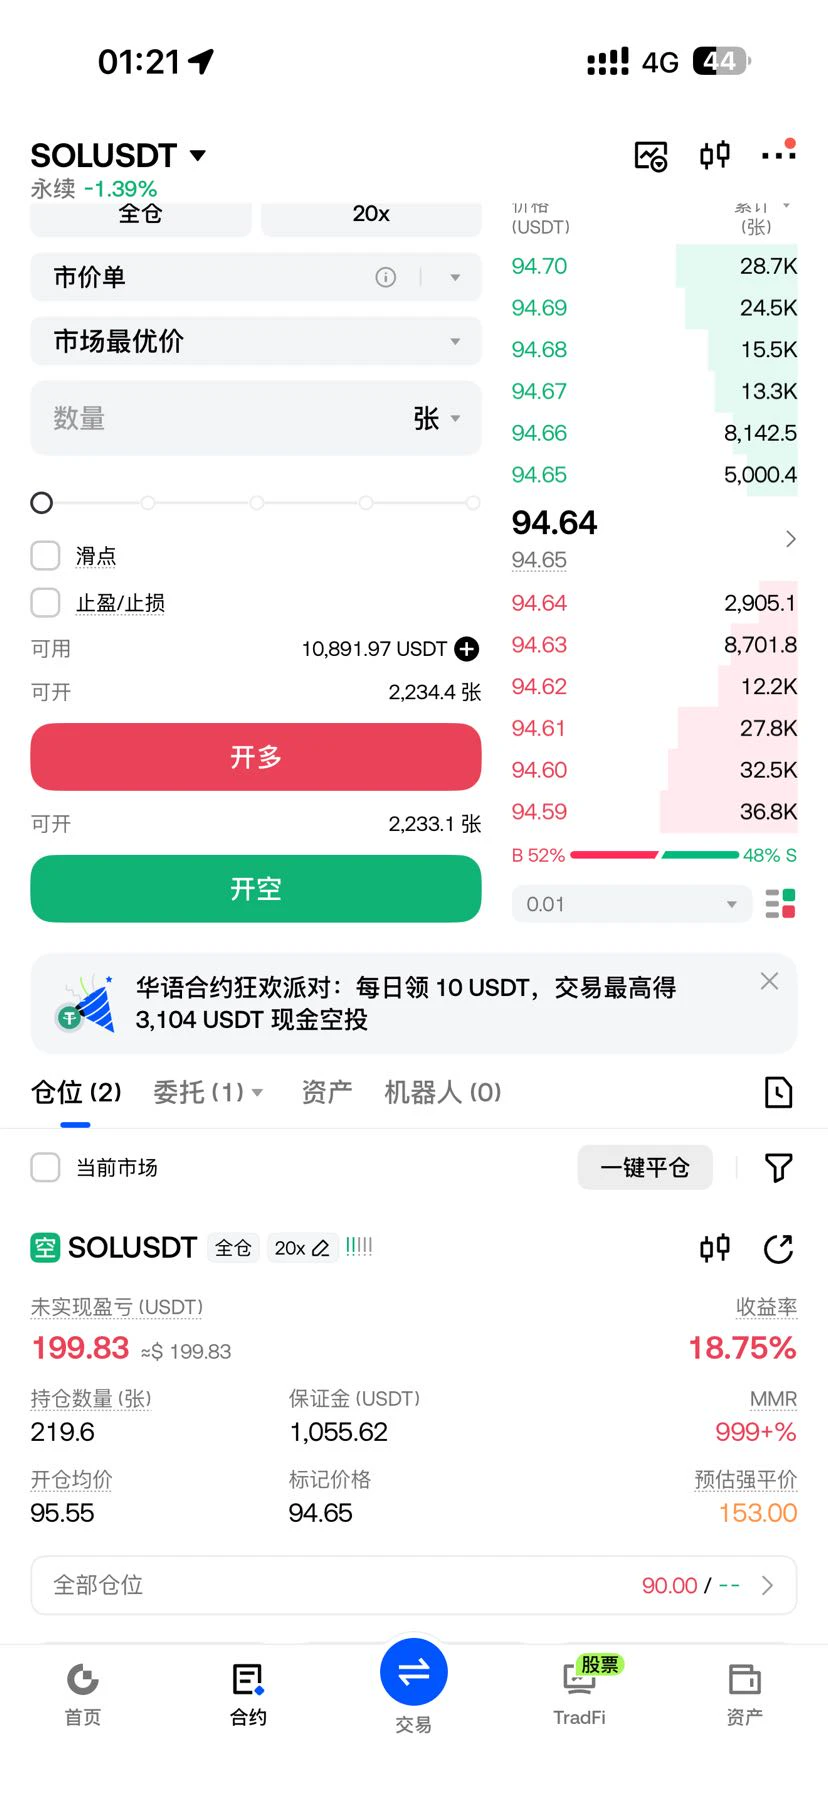
Just as I predicted, shorting SOL offers slightly better risk-reward. If you guys aren't sure which way the market is heading, you can continue to short tomorrow after a short-term rebound, if one occurs. The market has already been compressed, and with bearish funding rates rising, shorting is more suitable.
post-image
SOL-0.74%
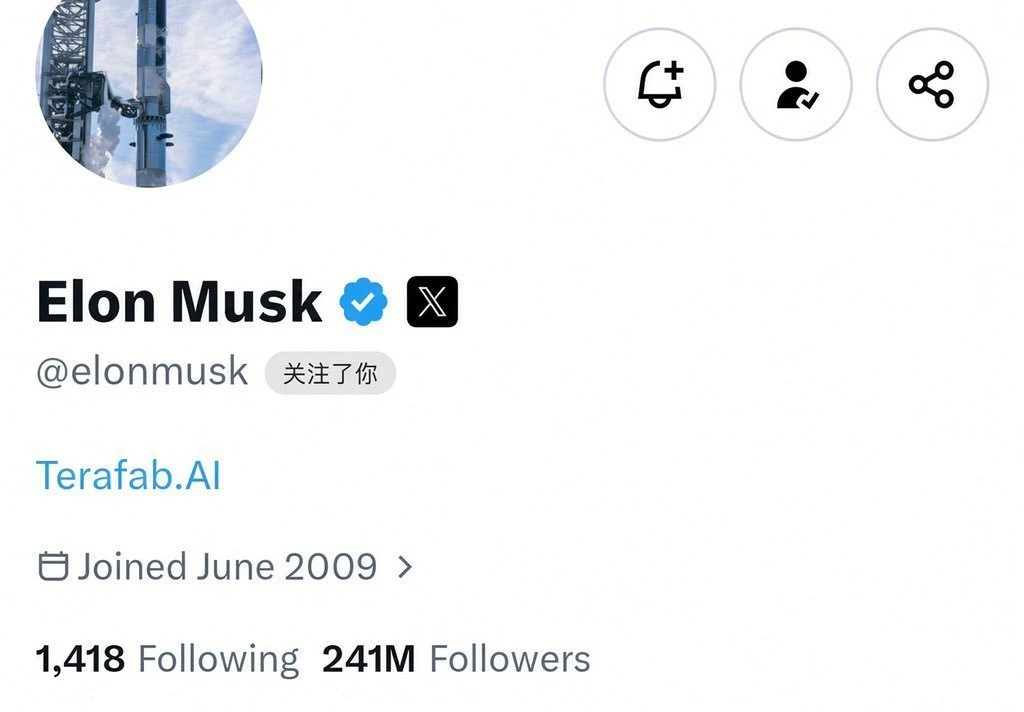
Holy shit!!!!!
Woke up in the middle of the night
My phone was burning hot
Turns out Elon Musk followed me
Is he trying to ride my clout?😉
post-image
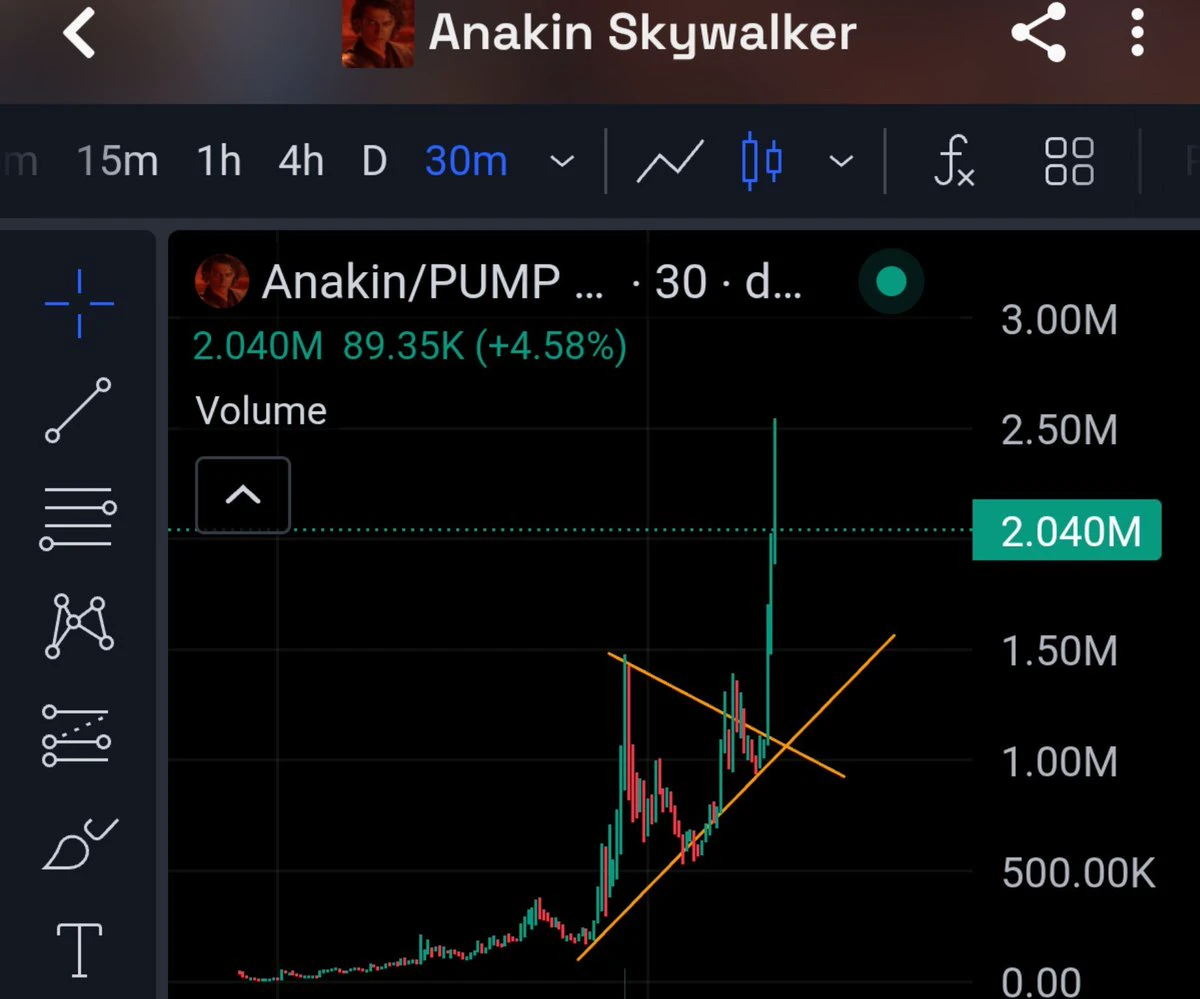
Pressure 🌊🎢
$Anakin
post-image
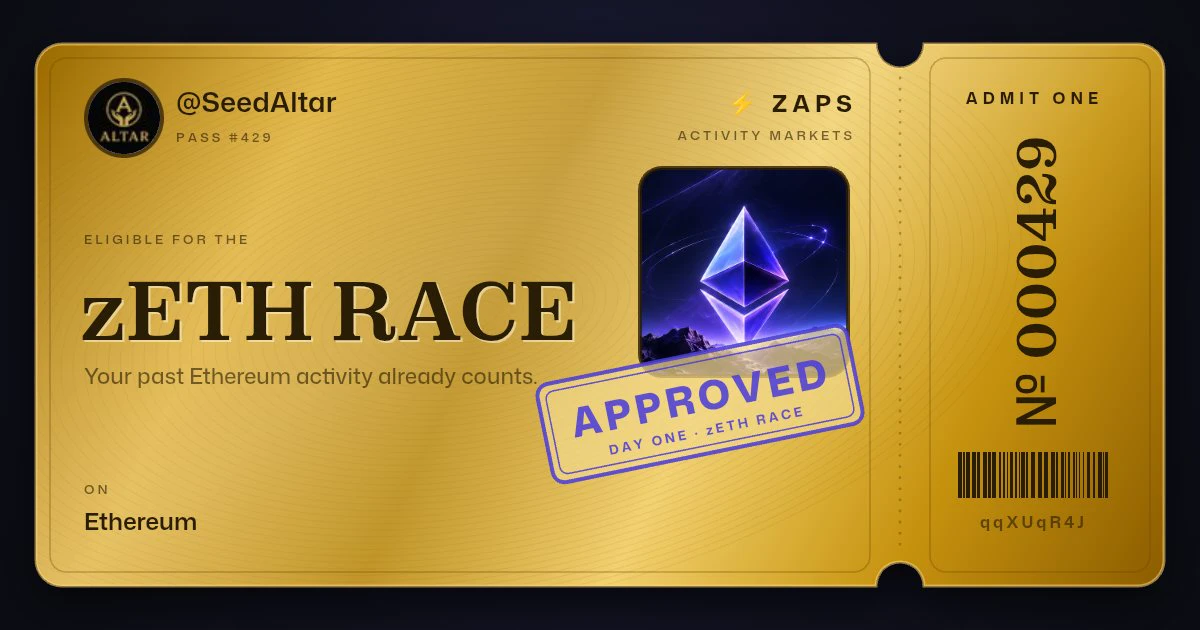
I'm in the zETH race. Pass #429. A new meme coin with no dev bag.
post-image
MEME-0.94%
Tesla Holds Near $400: Can TSLA Break Above $410 and Continue Its Rally? 🚗
Tesla is approaching another important moment as its recent recovery faces a fresh test around the $400 level. On the 2-hour TradingView chart, TSLA is trading around $399.82, down approximately 0.87% at the time of the screenshot. Despite the latest pullback, the broader recovery from its July lows remains noticeable, leaving investors watching whether buyers can maintain momentum or whether sellers are preparing another correction.
Looking at the bigger picture, Tesla experienced a significant decline toward the $297
FARTSLA
FARTSLAFartsla
Pump.Fun
MC:$3.03KHolders:1
8.35%
TSLA-0.85%
  • 3
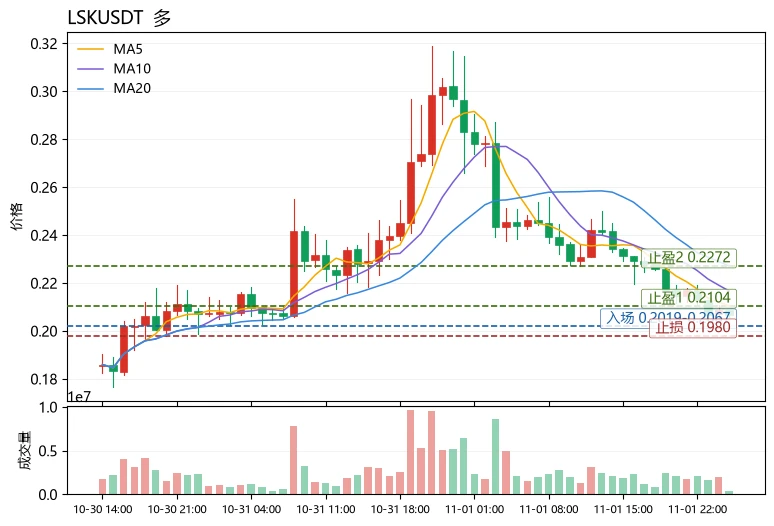
$LSK Current price is 0.2067, down 28.65% in 24 hours. The range across 30 candles reached 55.15%, with volatility in an extreme expansion phase; MA5=0.21044 is below MA20=0.22715, confirming a clear bearish alignment. RSI=32.8 is nearing oversold territory but has not bottomed, while the MACD histogram at -0.002941 is still expanding. The Fear & Greed Index is 34, in fear territory. The deeply negative funding rate of -0.1780% indicates crowded shorts, creating odds of a short-squeeze rebound in the short term, but the trend remains bearish. The strategy is therefore to take longs only on an
post-image
LSK-5.32%
HYPE+0.24%
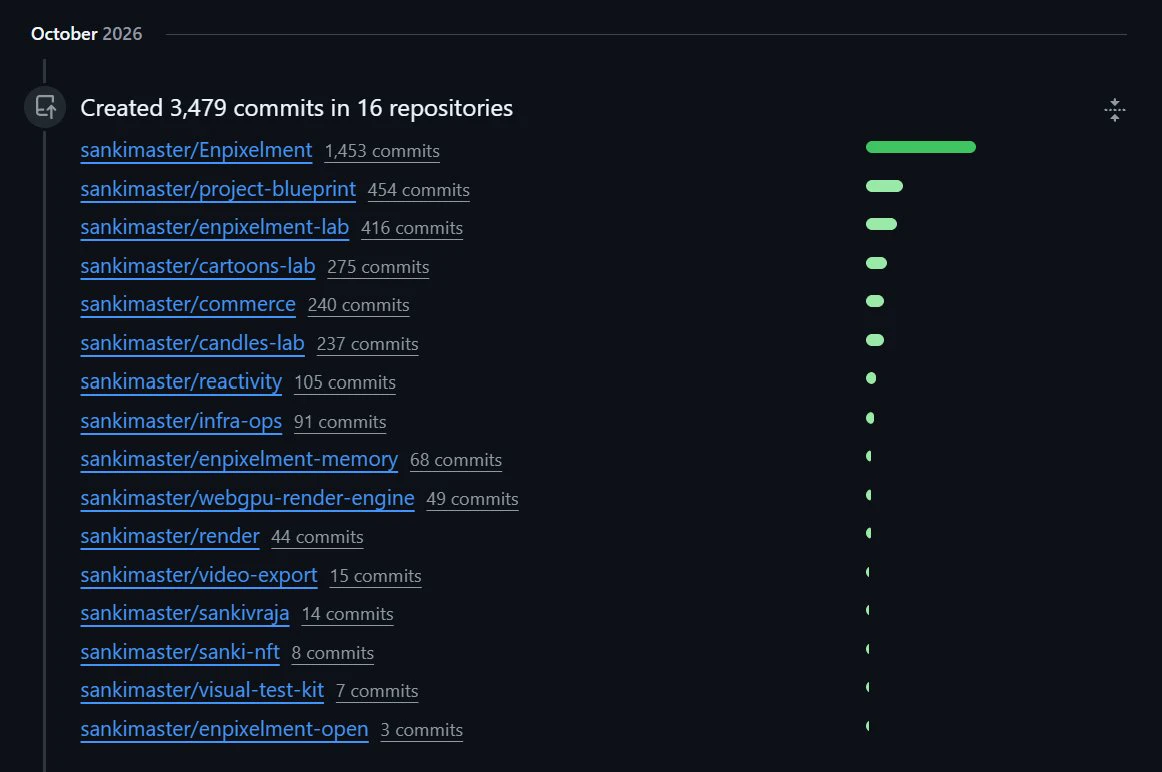
✨ I wrapped up October with 3,479 commits across 16 GitHub repositories.
#VibeCode
post-image
XAGUSD Next Week’s Trading Outlook$XAGAUD $XTIUSD
The trend is broadly similar to gold, but the bulls are weaker. On the daily chart, if it turns into a trading range, the range would be 49-54.6.
Support:
Weekly: 49-50.8, near 45.8
Daily: 48.6-49.45, near 45.6
Resistance:
Weekly: near 56, 61.1-62.2
Daily: 52.7-54.6, near 58.56, 61.7-62.2
4H: 52.7-53, 55.8-56.5
USOIL Next Week’s Trading Outlook
This week was range-bound, forming a doji. Watch for a decline next week, followed by a pullback to the EMA20 and a continuation higher.
Support:
Weekly: near 90.85, 81-82.4
Daily: near 95.6, near 92.5,
XAGAUD-5.86%
XTIUSD+0.03%
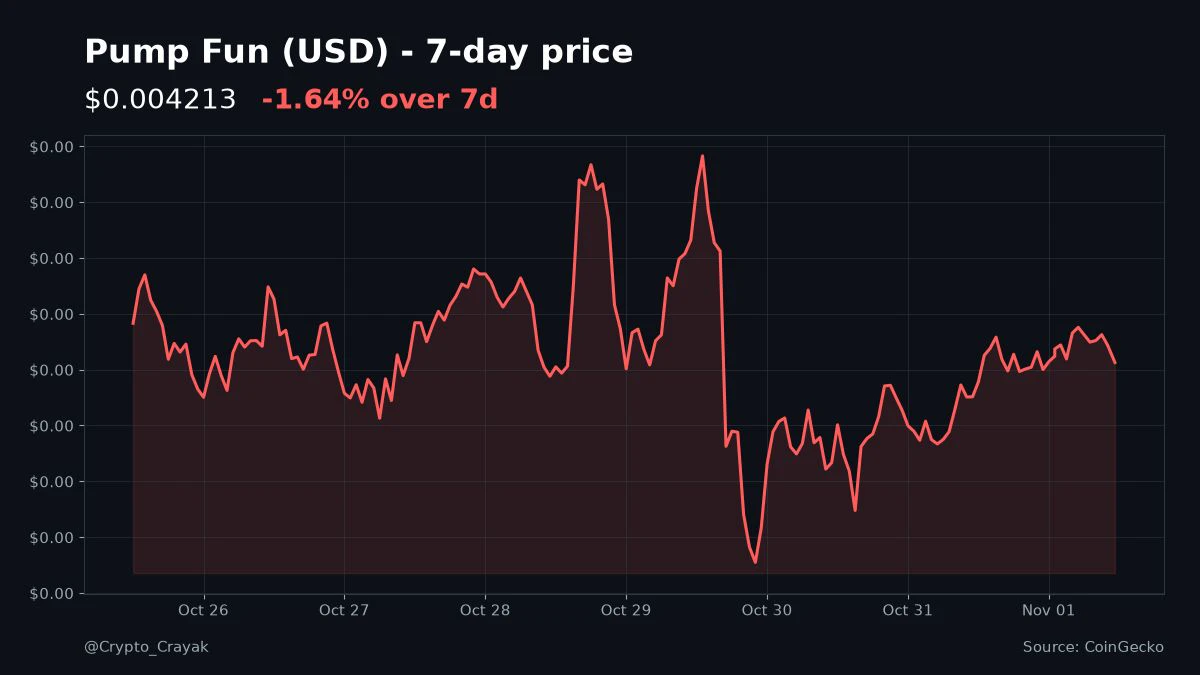
A whole week of swings on $PUMP and it's basically right back where it started, down less than 2%.
All that chop to go nowhere. Honestly that's the most crypto thing ever.
Do you sit through weeks like this or trade the range? @Pumpfun
post-image
PUMP-1.06%
🔥 IF YOU COULD CHOOSE ONLY ONE CRYPTO STRATEGY FOR THE NEXT 5 YEARS, WHAT WOULD IT BE?
Crypto offers multiple ways to participate in the market, but choosing the right strategy can make a huge difference.
Some investors prefer holding Bitcoin through market cycles. Others search for promising altcoins, while active traders focus on short-term opportunities.
There is no universal strategy that works for everyone. Your goals, knowledge, patience, and risk tolerance matter.
📊 THREE STRATEGIES. ONE CHOICE.
🟠 BTC HODL — Focus on long-term Bitcoin exposure.
🔵 ALTCOIN INVESTING — Research project
post-image
BTC-0.65%
GT-2.24%
  • 2
#ShareWeekly A Faster Network, but a Difficult Week for SOL: What the Chart Revealed
⚡ The Week Solana Became Faster, While Its Token Moved Lower
Solana delivered an important technological milestone, but SOL holders experienced a very different story in the market.
My weekly review shows a clear contrast: the network is progressing toward faster settlement and stronger infrastructure, while the token is still struggling to recover its short-term momentum.
At my current reference price of $95.48, SOL is trading approximately 5.42% below its October 26 closing price of $100.95. This week was a
post-image
SOL-0.77%
Load More

Join 40 M users in our growing community

⚡️ Join 40 M users in the crypto craze discussion

💬 Engage with your favorite top creators

👍 See what interests you

Trending Topics

BTC大跌

493.18k Views39.88k Discussing

$BTC briefly fell below $77,000 and remains under pressure around the $77K zone, with its 24-hour decline still above 4%. With risk appetite weakening and Fed uncertainty rising, where is the next key support after losing $80K?

IntelBeatsEarningsButStockPlunges

45.5k Views1.07k Discussing

StrategySTRCNears100ParValue

53.78k Views4.22k Discussing

View More