
Square
Following
Hot
News
Profile
Share your thoughts
placeholder
Article
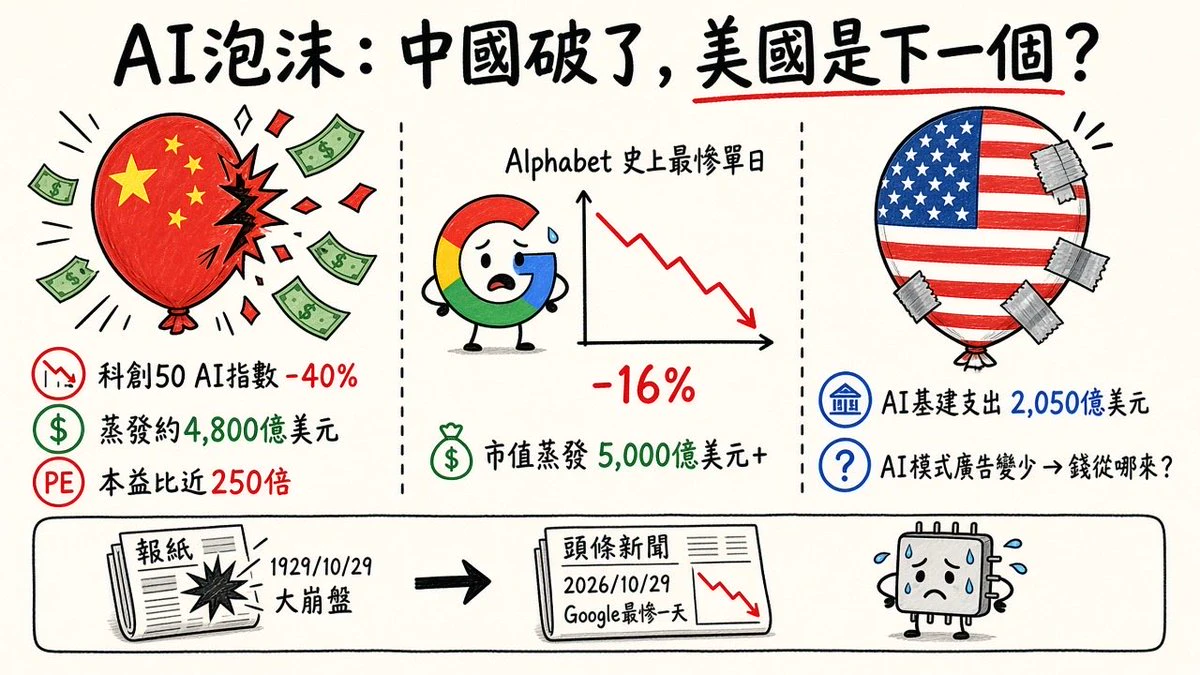
🎈💥 China's AI bubble burst? Will the U.S. be next?
🇨🇳 The STAR 50 AI Index has fallen about 40% in less than 4 months, wiping out about $480 billion. At its peak, its P/E ratio was nearly 250x 😱
🇺🇸 Alphabet (Google's parent company) just had the worst day in its history, falling as much as 16% intraday and wiping out more than $500 billion in market value 📉
Why?💸
① AI infrastructure spending this year could reach as high as $205 billion
② Ads in AI mode are fewer than in traditional search, so where will the money come from?🤔
③ Anthropic and OpenAI are preparing for IPOs and will nee
post-image
GOOGL-1.32%
$BIO $BIO Long ‼️♥️🤝Entry 0.0236-0.0238 Take-profit 1 0.0240 l Take-profit 2 0.0250 Stop-loss 0.0228
post-image
BIO-1.61%
Trenches
ZIG
Z
bade
b
ZIG
0x8c...1145
Market Cap
$.
Change
.
24h Vol
$.
Holders
.
KIM
K
bade
b
KIM
8pjf...pump
Market Cap
$.
Change
.
24h Vol
$.
Holders
.
Anakin
A
bade
b
Anakin
Exxz...pump
Market Cap
$.
Change
.
24h Vol
$.
Holders
.
BTC
B
bade
b
BTC
C5xp...pump
Market Cap
$.
Change
.
24h Vol
$.
Holders
.
IDOL
I
bade
b
IDOL
0x3b...ab07
Market Cap
$.
Change
.
24h Vol
$.
Holders
.
$SOLV
UPDATE
#SOLV is moving as predicted already 30%+ gain so far. We can see 50%+ gain here ✍🏻
#SOLVUSDT #SOLVBTC #Bitcoin #NFTs
SOLV-4.59%
BTC-0.67%
[New Streamer]Intel plunged 28.58 percentage, wiping approximately $12 billion off the value US GOV.
live-cover
LIVE1,981
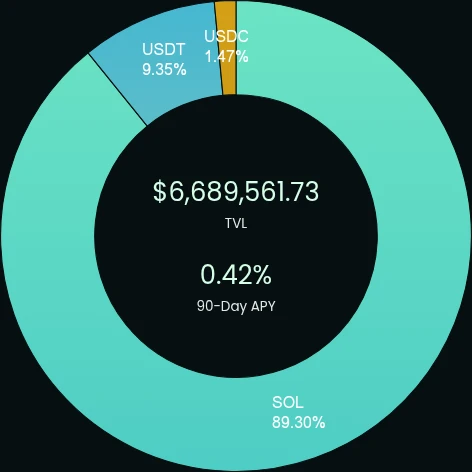
🚀 Below is our current portfolio allocation:
🔹 Total Value Locked: $6.69M
🔹 Expected APY: 0.42%
Exploring DeFi depths with precision. 🌐
#Crypto #Trading #Portfolio #DeFi
Chart below shows the allocation. 📊
Ready to start your journey?
post-image
Many such cases. Most L2s will fade into oblivion.
post-image
There are two types of people on listing day. Paper hands: Sells at $2, buys iPhone, posts on Instagram, broke in 2 months. Diamond hands: Holds, builds business, buys house in 2 years. Which story do you want to tell your kids? Honestly.
#PiNetwork
#ShareWeekly
#GateSquare
#WCTCS9
post-image
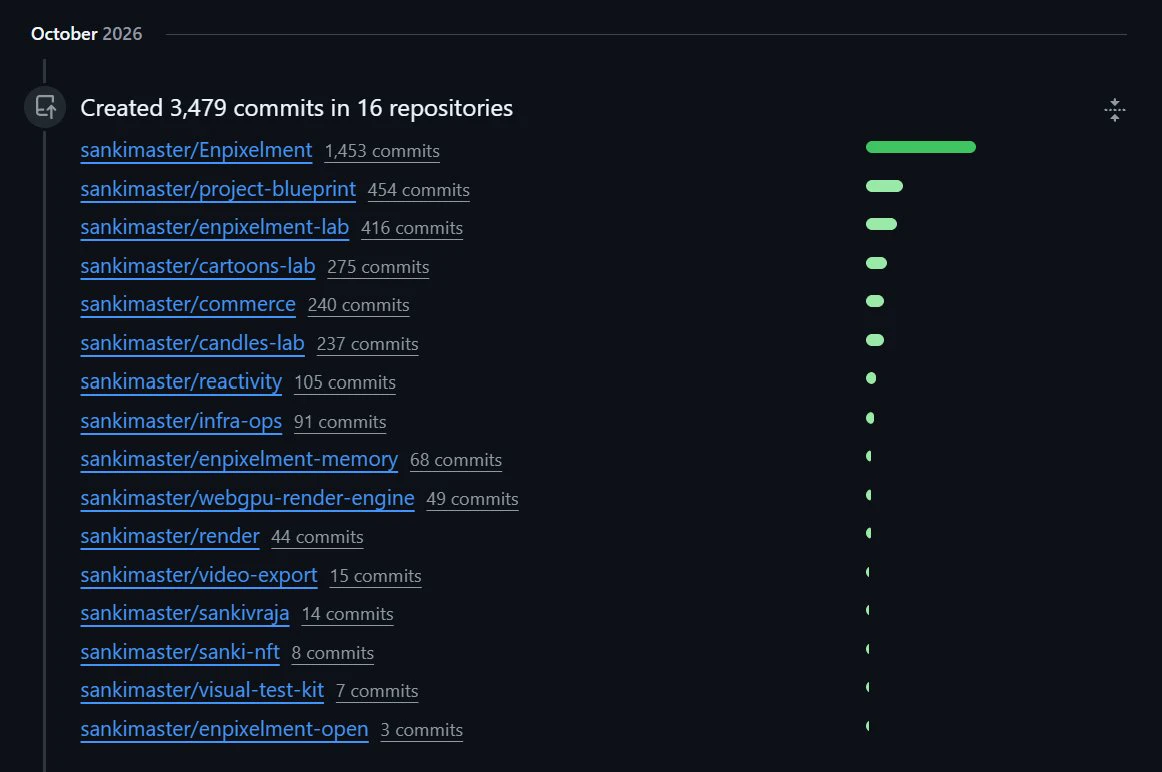
✨ I wrapped up October with 3,479 commits across 16 GitHub repositories.
#VibeCode
post-image
$NIGHT Approaching a major breakout… bulls in control $NIGHT The 4-hour chart shows strong bullish momentum, steadily climbing from the $0.0360 support zone. Buyers have regained control and are now testing the key $0.0430 breakout zone. A confirmed break above this level could trigger a fresh rally. Entry: $0.0423–$0.0429 First target: $0.0438 Second target: $0.0448 Third target: $0.0460 Stop-loss: $0.0415 Buy and trade $NIGHT
post-image
NIGHT-3.10%
XAUUSD Trading Outlook for Next Week$XAUUSD
On the weekly chart, the previous low at 3943 has been decisively broken by a candle body. One more weekly candle is needed for confirmation, but price has also reached the weekly EMA100 confirmation zone of 3880-3898. For now, there is resistance above and support below, with 3880-3943 potentially acting as a consolidation range. Note that next week’s open could see a further downward wick followed by a quick recovery, returning to test resistance around 3943. On the daily chart, 3943 has likewise been broken by a candle body, and one more daily ca
XAUUSD-3.63%
#美国中期选举 #BTC大跌 #作手分析
Midterm election curse? BTC hit a low after all three elections, while U.S. stocks followed a different pattern!
Trading focus: $BTC $ETH $SOL
Just two days remain until the U.S. midterm elections on November 3, 2026.
Looking back at the past three U.S. midterm elections, BTC showed a phenomenon worth examining: prices did not stabilize immediately after the elections, but continued to fall before forming interim lows.
Interestingly, U.S. stocks followed a different historical pattern.
Is this an election curse, or the result of BTC’s own cycle coinciding with macro even
BTC-0.67%
ETH-1.26%
SOL-0.77%
BCH+1.05%
It's okay, there's someone downstairs now. If that doesn't work, I'll have him send you a message in a dream.
post-image
GM
It’s a great day to lock in
post-image
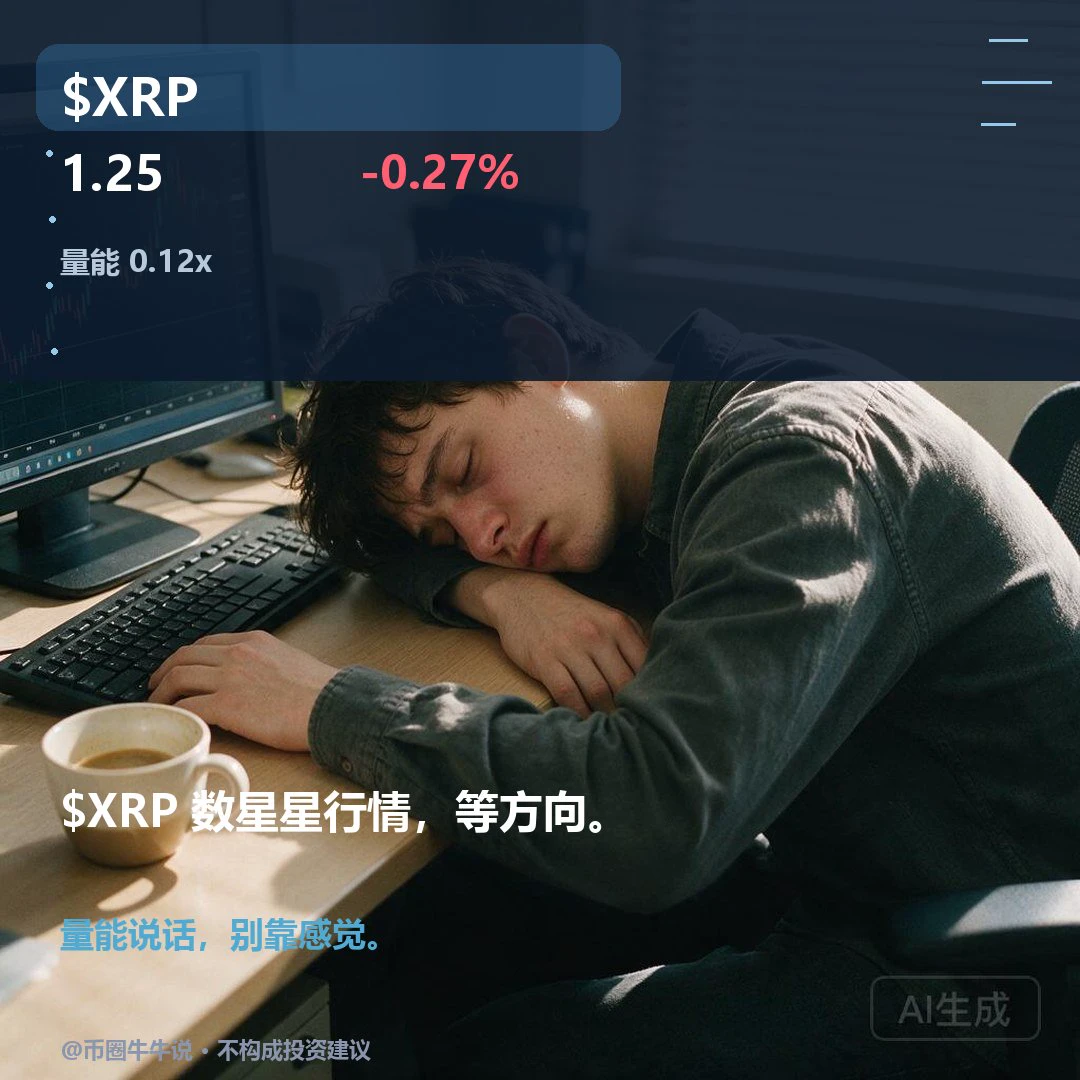
$XRP is currently at 1.2507, down 0.27% over 24 hours. Weakness on both the 1-hour (RSI 54) and 4-hour (RSI 54.4) charts points to further downside. If it holds above the 1.26 resistance level, a rebound may be worth watching for; if it breaks below the 1.246 support level, further downside is possible. Volume is insufficient. Going forward, watch whether it can hold above 1.26 and whether it can reclaim 1.246 if that support fails. Markets are volatile; for observation only.
post-image
XRP-1.15%
#PEARL is rising notably more than BTC today, but without confirmation from a fresh public catalyst: the price is holding around $1.53, while trading volume remains moderate relative to its market cap.
The main takeaway: the move so far looks more like localized demand and a rotation into PEARL than a reaction to confirmed news; the sustainability of the gains will depend on whether volume starts expanding alongside the price.
Deep Dive
1. PEARL is outperforming the market
Pearl (PEARL) is trading around $1.53, up 1.4% over the past hour and 5.17% over 24 hours. Over the same period, Bitcoin r
PEARL-2.04%
BTC-0.67%
  • 1
With the same 1000U, some people are rushing into $XPL now, while others are stubbornly waiting for a rebound—the outcomes couldn’t be more different.
I’m going head-to-head with analysts on Gate Square. Let the data speak. $XPL is currently at 0.0731, down 9.59% in 24 hours, after plunging from 0.0862 to 0.0690, with a trading volume of 148.1M. Bulls versus bears—let’s break it down point by point.
1. Price structure: bears are in control. The current price is just above the 24-hour low of 0.0690, while 0.0862 was where today’s sell-off began. The rebound has no volume behind it, suggesting r
XPL-0.60%
  • 7
  • 1
$LYN $LYN Damn, guys, we're almost back to breakeven. Come on, you shady market makers, give it a push—let's hit #1 on the gainers list
post-image
LYN-0.44%
Long $DOGE $DOGE: 4-hour support is at 0.0757. Buyers need to hold this level. This is my key level. If it holds, price could rise to 0.0760–0.0764. A break below 0.0752 invalidates this view. - BTC’s short-term trend is bullish, providing a tailwind for this long position. - The 1-hour RSI is 50, indicating neutral momentum with no overextension. - The stop-loss distance is 0.63%, and TP3 is 1.0%, giving a risk-reward ratio of about 1.6R if the trade plays out. 🟢 Long entry: 0.07563–0.07571 Take profit: 0.07596 / 0.07615 / 0.07643 Stop loss: 0.07519 Not investment advice. Trade at your own ri
post-image
DOGE-0.22%
GOLD OPENING TONIGHT
live-cover
LIVE977
Load More

Join 40 M users in our growing community

⚡️ Join 40 M users in the crypto craze discussion

💬 Engage with your favorite top creators

👍 See what interests you

Trending Topics

BTC大跌

493.18k Views39.88k Discussing

$BTC briefly fell below $77,000 and remains under pressure around the $77K zone, with its 24-hour decline still above 4%. With risk appetite weakening and Fed uncertainty rising, where is the next key support after losing $80K?

IntelBeatsEarningsButStockPlunges

45.5k Views1.07k Discussing

StrategySTRCNears100ParValue

53.78k Views4.22k Discussing

View More