Square
Following
Hot
News
Profile
Share your thoughts
placeholder
Article
Total crypto market cap exceeds $2.60 trillion, with Bitcoin dominance at 59.9
live-cover
LIVE978
#IntelBeatsEarningsButStockPlungesIntel's latest financial results have attracted significant attention in the technology and financial markets. The company managed to beat analysts' earnings expectations, but surprisingly, its stock price dropped sharply.
This situation highlights an important fact about the stock market: strong financial results do not always lead to higher share prices.
### Why Did Intel's Stock Fall?
There are several possible reasons behind the decline:
1\. High Investor Expectations
Investors may have expected even stronger results. Although Intel performed better than a
post-image
NVDA-4.16%
INTC-28.49%
  • 1
Trenches
Q
Q
bade
b
Q
0xc0...0589
Market Cap
$.
Change
.
24h Vol
$.
Holders
.
IDOL
I
bade
b
IDOL
0x3b...ab07
Market Cap
$.
Change
.
24h Vol
$.
Holders
.
DESSA
D
bade
b
DESSA
npz2...pump
Market Cap
$.
Change
.
24h Vol
$.
Holders
.
ZIG
Z
bade
b
ZIG
0x8c...1145
Market Cap
$.
Change
.
24h Vol
$.
Holders
.
GTA6
G
bade
b
GTA6
4kjr...zDnz
Market Cap
$.
Change
.
24h Vol
$.
Holders
.
Gold has pulled back more than 30% from its high and is now sitting right on weekly support. I’ve been watching the market for two days, and I feel like the people having the hardest time aren’t the ones losing money, but the ones who keep getting stopped out only to see the market turn around right afterward. A friend of mine who trades short-term is a perfect example: last week, he placed a stop loss less than 1% above support. In his words, there was still a “safety buffer” between his stop and support. But one long lower wick took him out, and the price bounced back half an hour later. Thr
post-image
PAXG+0.37%
XAU+0.38%
  • 10
  • 1
$Q Down 26% in a day, from 0.0500 straight to 0.0262—this isn't a pullback; it's a waterfall. Now at 0.0330, price keeps grinding along the lower edge of the 0.0262–0.0330 range, while trading volume of 170 million shows panic selling is still underway. Technically, the daily chart has fallen below all short-term moving averages, the MACD bearish crossover is widening downward, and the RSI has just turned up from oversold territory but lacks volume confirmation—a typical continuation pattern in a downtrend. Don't rush to buy the dip in this kind of whipsaw market. Wait for a second test of 0.0
  • 9
$UAI Up 16.48% in 24 hours, currently at 0.3131, after reaching a high of 0.3234—this isn’t a move retail traders can drive. With 15M in trading volume alongside this gain, it’s clear funds are scrambling to accumulate. But note the 24-hour low of 0.2664 and an intraday range exceeding 21%: buyers who chased the rally have already been shaken out once.
Don’t chase the current price. Wait for a pullback into the 0.295–0.30 range and buy in batches. Set a stop-loss below 0.266 (a break below today’s low would mean a false breakout). Take profit on half the position near the previous high of 0.32
UAI-7.58%
  • 5
  • 2
Everyone, yesterday was Day 5 of our trading challenge, and I shared two trades in the Chatroom. I also posted about them at the time. Here are the results… Day 5 trade details: We opened two long trades: $PARTI $PARTI & $SLP , one of which, PARTI, we closed at breakeven (entry price) because volatility was too high and the risk was too great, while the other hit all its targets. A previous trade is still ongoing (the Day 3 $AGT short trade), and it has already reached TP1. Tomorrow, I’ll share the overall results for the challenge’s first week. Everyone, take the weekend off—you’ve missed a l
post-image
PARTI-1.06%
SLP+0.55%
AGT-26.77%
  • 1
Booooom 💰👇$ESPORTS The target has been reached. Keep your eyes on it and secure your profits. Congratulations 🎉🤑💰, it reached 0.009200
post-image
ESPORTS-5.30%
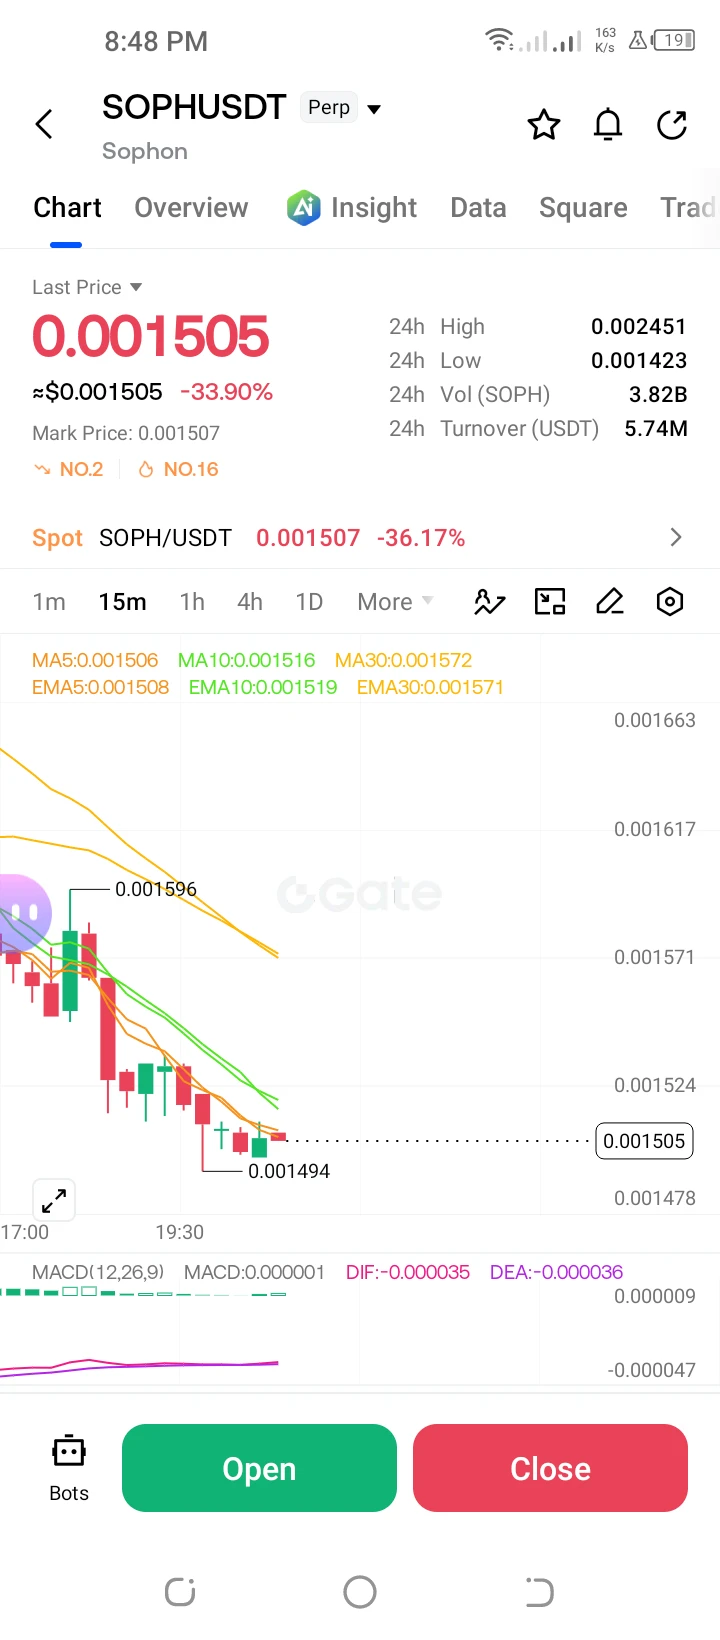
**$SOPH /USDT Perp – "Capitulation Drop – Short"**
Trading Plan Short $SOPH
Entry: 0.001550
SL: 0.001571
TP1: 0.001423
TP2: 0.001400
SOPH is down -33.90% after a sharp rejection from the 0.002451 high. MACD is deeply negative; targeting the 0.001423 low.
post-image
SOPH-4.34%
Nothing’s new over-ear headphones are now on sale for 2,999 yuan, featuring three drivers per earcup (40/13/3.2 mm), 10-mic ANC, an xMEMS tweeter, Hi-Res gold certification, and tuning developed in collaboration with a London recording studio.
Putting the studio collaboration and triple-driver setup in the specs makes them sound like professional monitor headphones. But what really determines the experience is fit and how they perform in different noise-canceling scenarios. No matter how complete the specs are, you have to wear them to know.
$BTC
post-image
BTC-0.67%
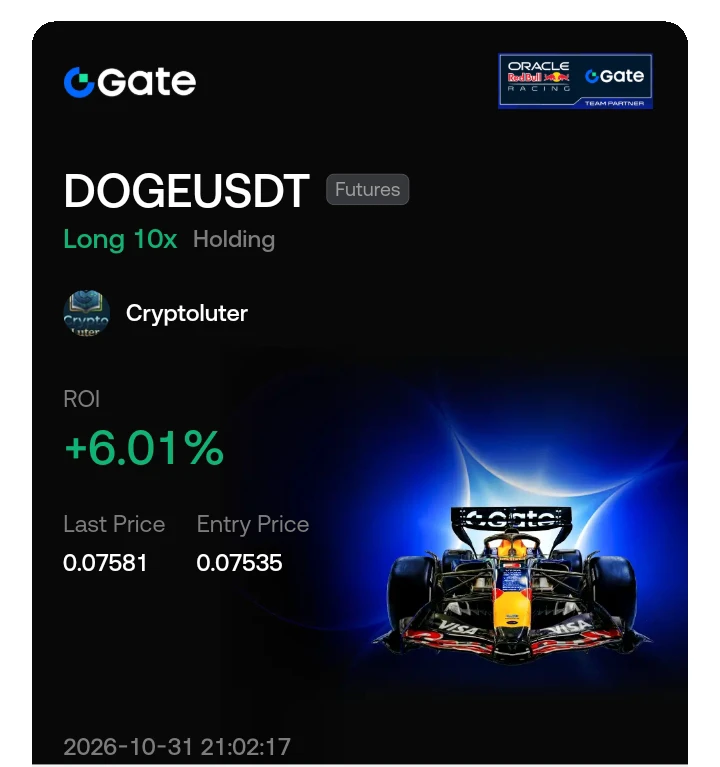
$DOGE (Dogecoin) – Active Long Position, Holding with Tight Risk Management
I'm currently holding an active 10x Long position on DOGE, entered at $0.07535**, with the current price at **$0.07581 and a solid unrealized ROI of +6.01%.
Looking at the 15-minute chart, the market context is strongly supporting this position. The price has established a clear short-term uptrend, printing higher highs and higher lows. Crucially, the price is holding comfortably above the tightly clustered moving averages (MA5, MA10, MA30, EMA5, EMA10, EMA30 are all bunched between $0.07521 and $0.07543). The MACD is
post-image
DOGE-0.18%
Happy Halloween 🧛🏻‍♀️🩸🖤
post-image
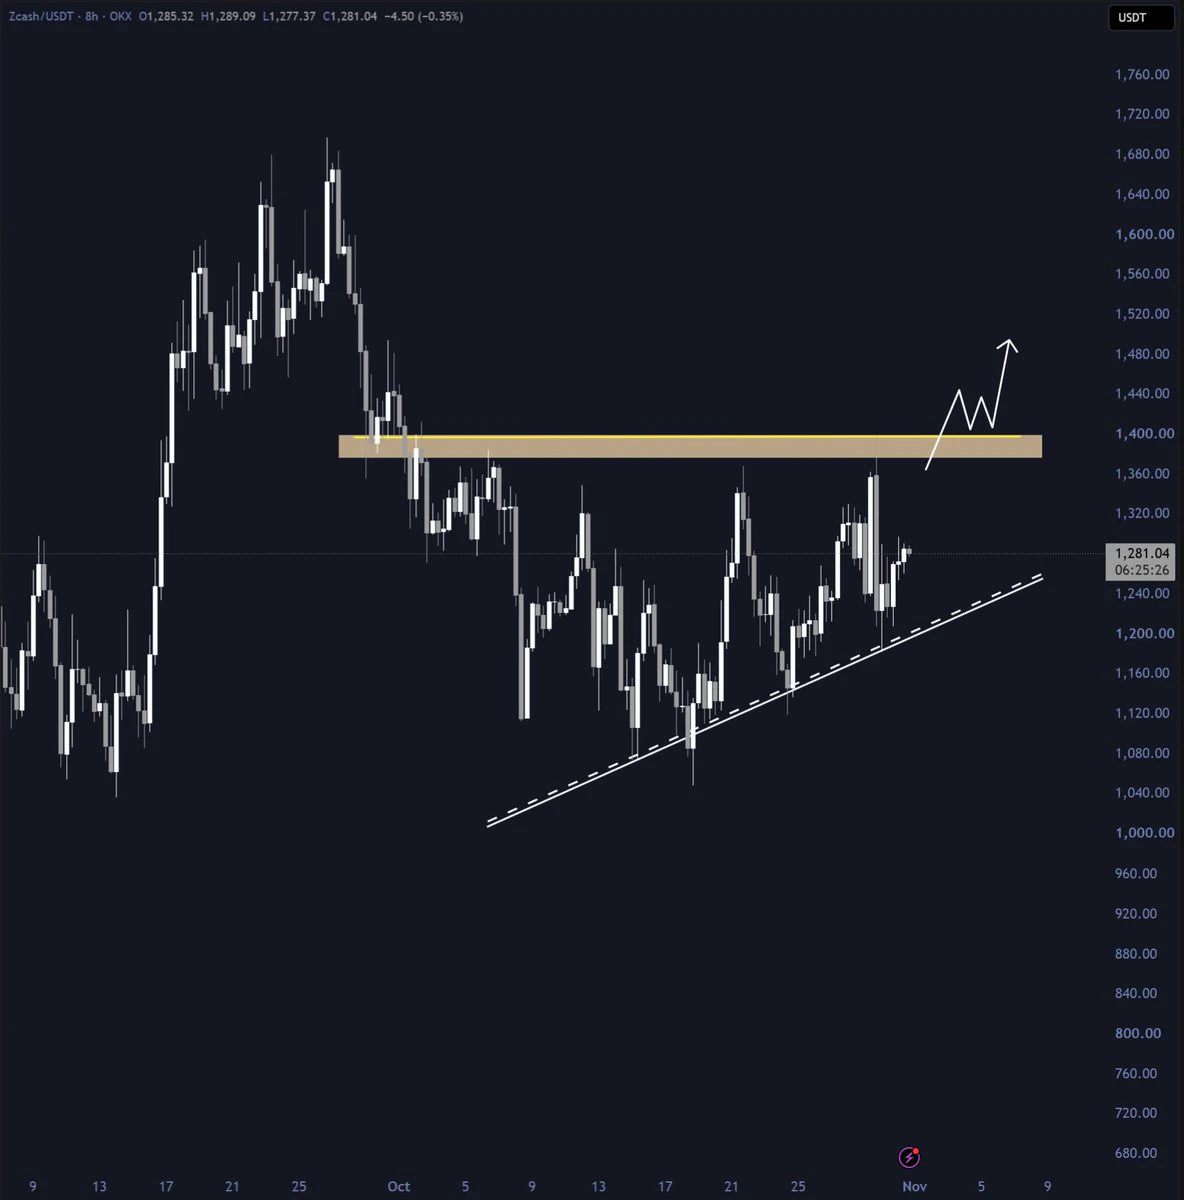
Once $ZEC breaks above $1,350 it'll pump to $2K very quickly🚀
post-image
ZEC+1.16%
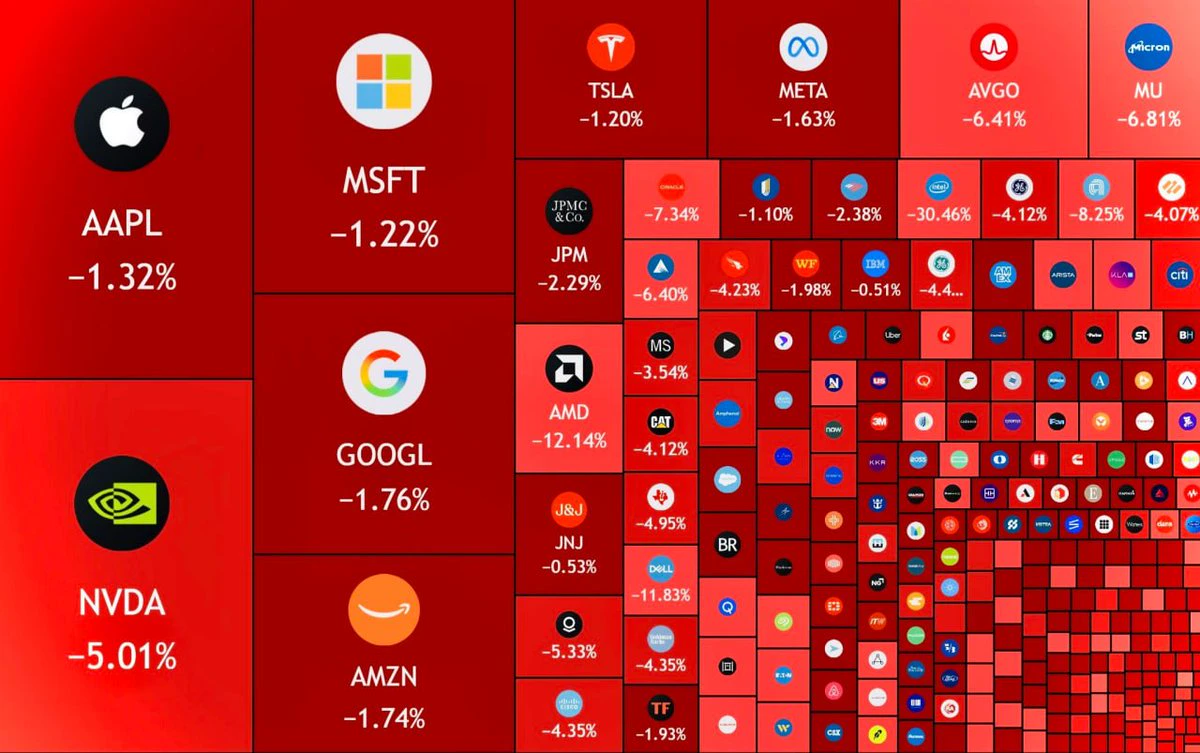
🚨 JUST IN: 🇺🇸 $1.8 TRILLION wiped out from US stocks in Friday's sell-off.
Here's how the major indexes closed:
1. Nasdaq: -3.4%
2. S&P 500: -2.1%
3. Dow Jones: -1.1%
What a brutal finish to October
post-image
Draft Ethereum proposal aims to let wallets permanently disable EIP-7702 delegation
live-cover
LIVE843
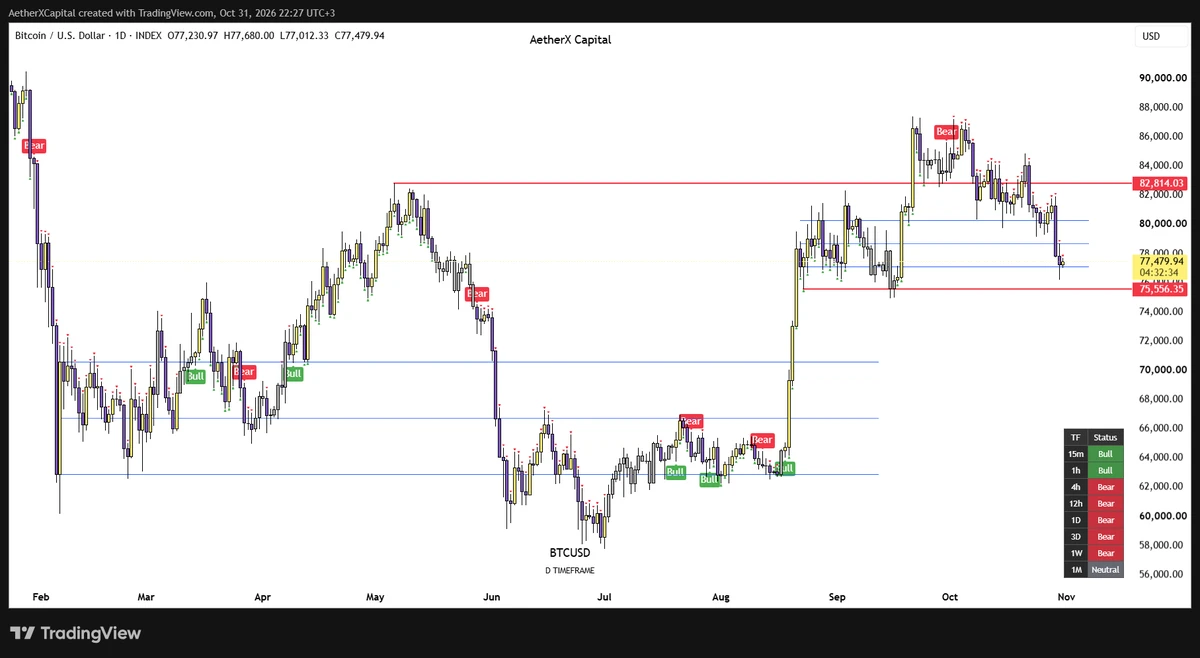
Although Bitcoin has shown relative strength following the drop, the OBV Trend has confirmed a bearish signal on the 3D chart, while on the 1W chart, it is still awaiting confirmation.
If the higher timeframes remain bearish, lower prices can be expected.
Caution is advised ⚠️
$BTC 1D
post-image
BTC-0.67%
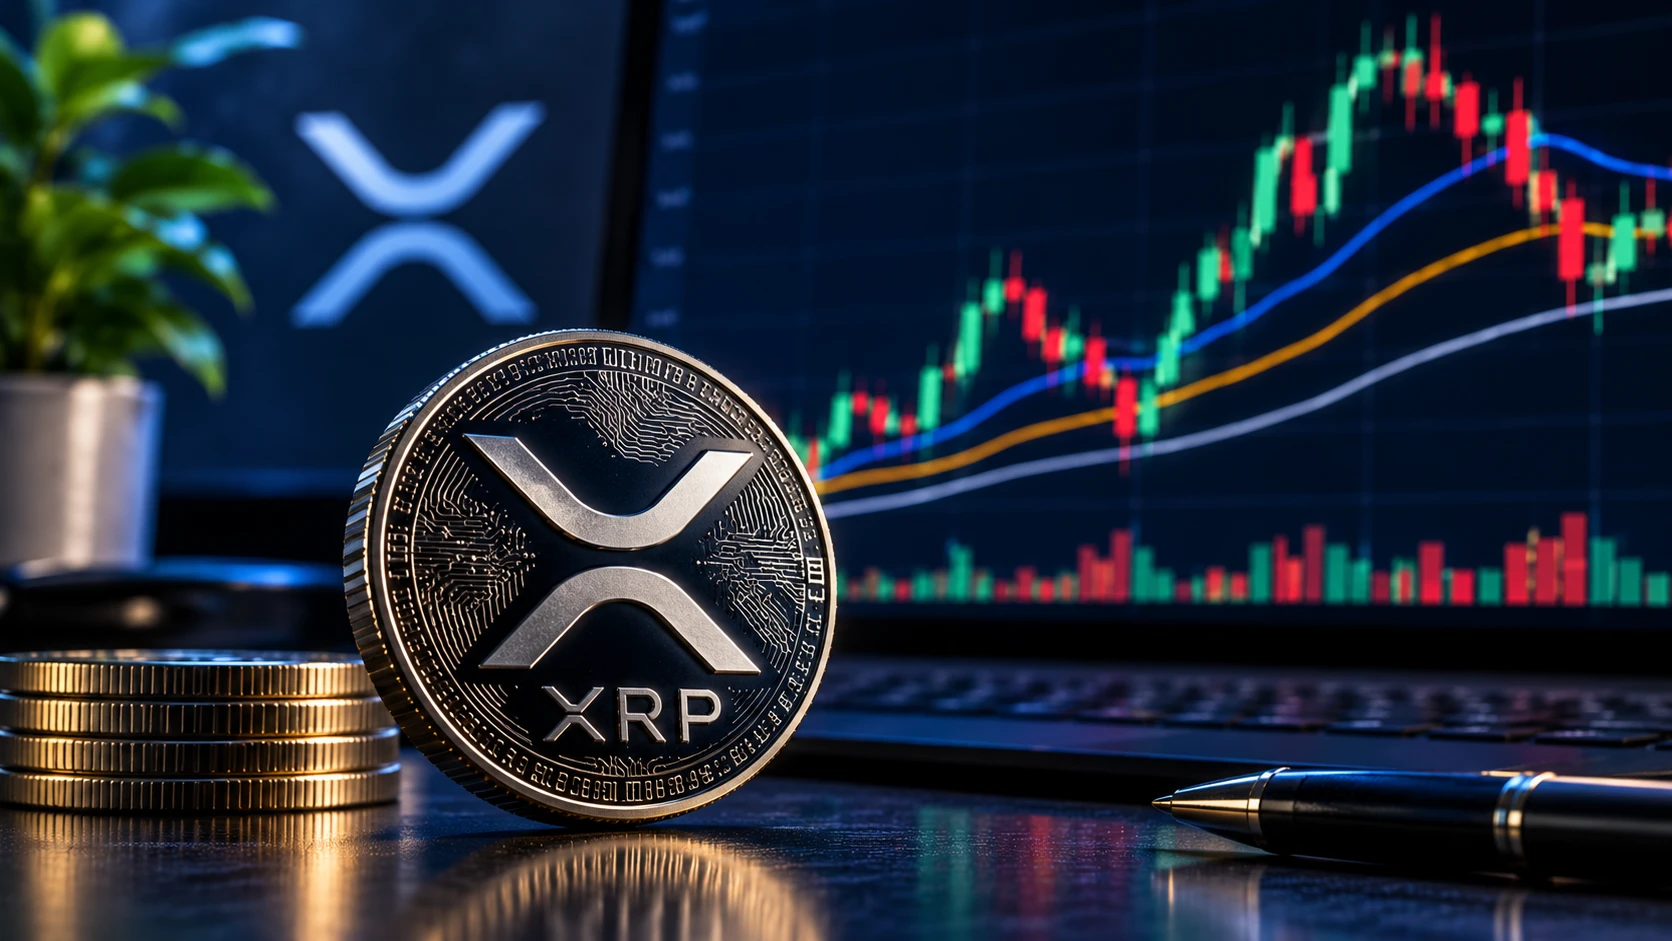
📊 $XRP A Bullish Fractal Worth Watching
XRP’s 21, 50 & 100 monthly EMAs resemble structures seen in previous cycles—but history doesn’t guarantee a repeat.
🔑 $3.67 is the key level. A confirmed breakout could put $5.25, $6.33 and $8.28 in focus. The $13.69 projection remains highly speculative.
The real signal isn’t the target price—it’s whether XRP can confirm the breakout. Until then, caution matters.
Will $XRP repeat its historical pattern, or will resistance prevail?
#XRP #CryptoAnalysis #Altcoins
post-image
XRP-1.15%
🔥 $MAGMA Recovery or Real Trend Reversal?
MAGMA is rebounding after a sharp sell-off, but one strong move doesn't confirm a trend change.
📊 Key levels to watch:
- $0.44: Resistance. A breakout backed by sustained volume could open a path toward $0.55.
- $0.31: Support. Losing this level could weaken the recovery.
The real signal is whether buyers can sustain momentum near resistance—not just trigger another short-lived rally.
Will $MAGMA continue its recovery, or will sellers take control again?
#MAGMA #DeFi #CryptoAnalysis
post-image
MAGMA-0.57%
$RSR $ RSR, a speculative coin, always hits all its targets and then drops; it plunged hard after reaching only around 1720—look at that
post-image
RSR-1.93%
Load More

Join 40 M users in our growing community

⚡️ Join 40 M users in the crypto craze discussion

💬 Engage with your favorite top creators

👍 See what interests you

Trending Topics

BTC大跌

341.65k Views39.67k Discussing

$BTC briefly fell below $77,000 and remains under pressure around the $77K zone, with its 24-hour decline still above 4%. With risk appetite weakening and Fed uncertainty rising, where is the next key support after losing $80K?

IntelBeatsEarningsButStockPlunges

27.39k Views899 Discussing

StrategySTRCNears100ParValue

32.77k Views4.11k Discussing

View More