Square
Following
Hot
News
Profile
Share your thoughts
placeholder
Article
BTC breaks above 77,000 USDT, with its 24-hour loss narrowing to 2.67
live-cover
LIVE2,717
Never mind.
You guys probably think it’s no fun anyway.
post-image
Trenches
IDOL
I
bade
b
IDOL
0x3b...ab07
Market Cap
$.
Change
.
24h Vol
$.
Holders
.
Q
Q
bade
b
Q
0xc0...0589
Market Cap
$.
Change
.
24h Vol
$.
Holders
.
ZIG
Z
bade
b
ZIG
0x8c...1145
Market Cap
$.
Change
.
24h Vol
$.
Holders
.
SAFU
S
bade
b
SAFU
0x7c...7777
Market Cap
$.
Change
.
24h Vol
$.
Holders
.
STONK
S
bade
b
STONK
6GmA...UNgx
Market Cap
$.
Change
.
24h Vol
$.
Holders
.
Long $LSK orders awaiting a rally have just confirmed a strong bullish BOS and are currently pulling back and accumulating above EMA20. Prioritize longs in the support zone; price is expected to continue advancing toward the previous high. Entry 1: 0.2250 – 0.2280 Entry 2: 0.2160 – 0.2180 Entry 3: 0.2050 – 0.2080 Take Profit 1: 0.2490 Take Profit 2: 0.2700 Take Profit 3: 0.2910 Stop Loss: 0.1950
post-image
LSK-5.32%
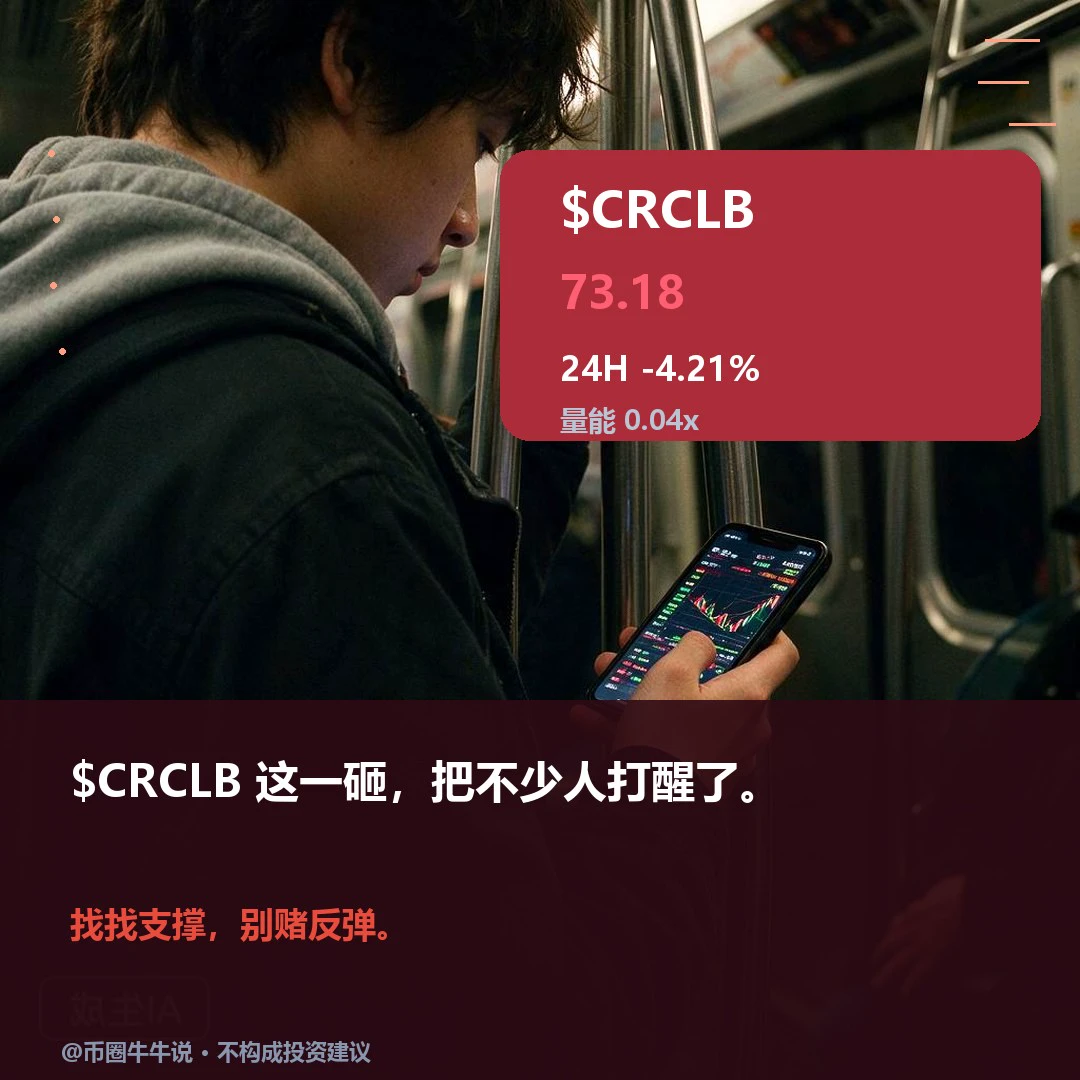
Weak. $CRCLB is currently at 73.18, down more than four percentage points on the day, but its four-hour RSI has entered oversold territory. Can this divergence between the decline and the oversold signal be taken as evidence of a bottom?
A sharp drop only shows that selling pressure has occurred; it does not automatically mean the price is cheap. The one-hour trend remains weak, with the price still hugging below the short-term moving average. Trading volume is less than one-fifth of normal, indicating very low market participation. This oversold reading looks more like a natural slide with no
post-image
Putting “tariff revenue” and “18 trillion” together in this trade war sounds absurd. Tariff revenue is money actually collected by the government, according to its fiscal accounting: it involves specific tariff lines, tax collection, and funds deposited into the treasury. The 18 trillion figure, by contrast, is officially described as “announced investments”—not money actually received. These are two completely different things.
Announced investments are more like framework agreements, letters of intent, or long-term capital expenditure plans. They may be spread over many years and subject to
post-image
  • 6
  • 2
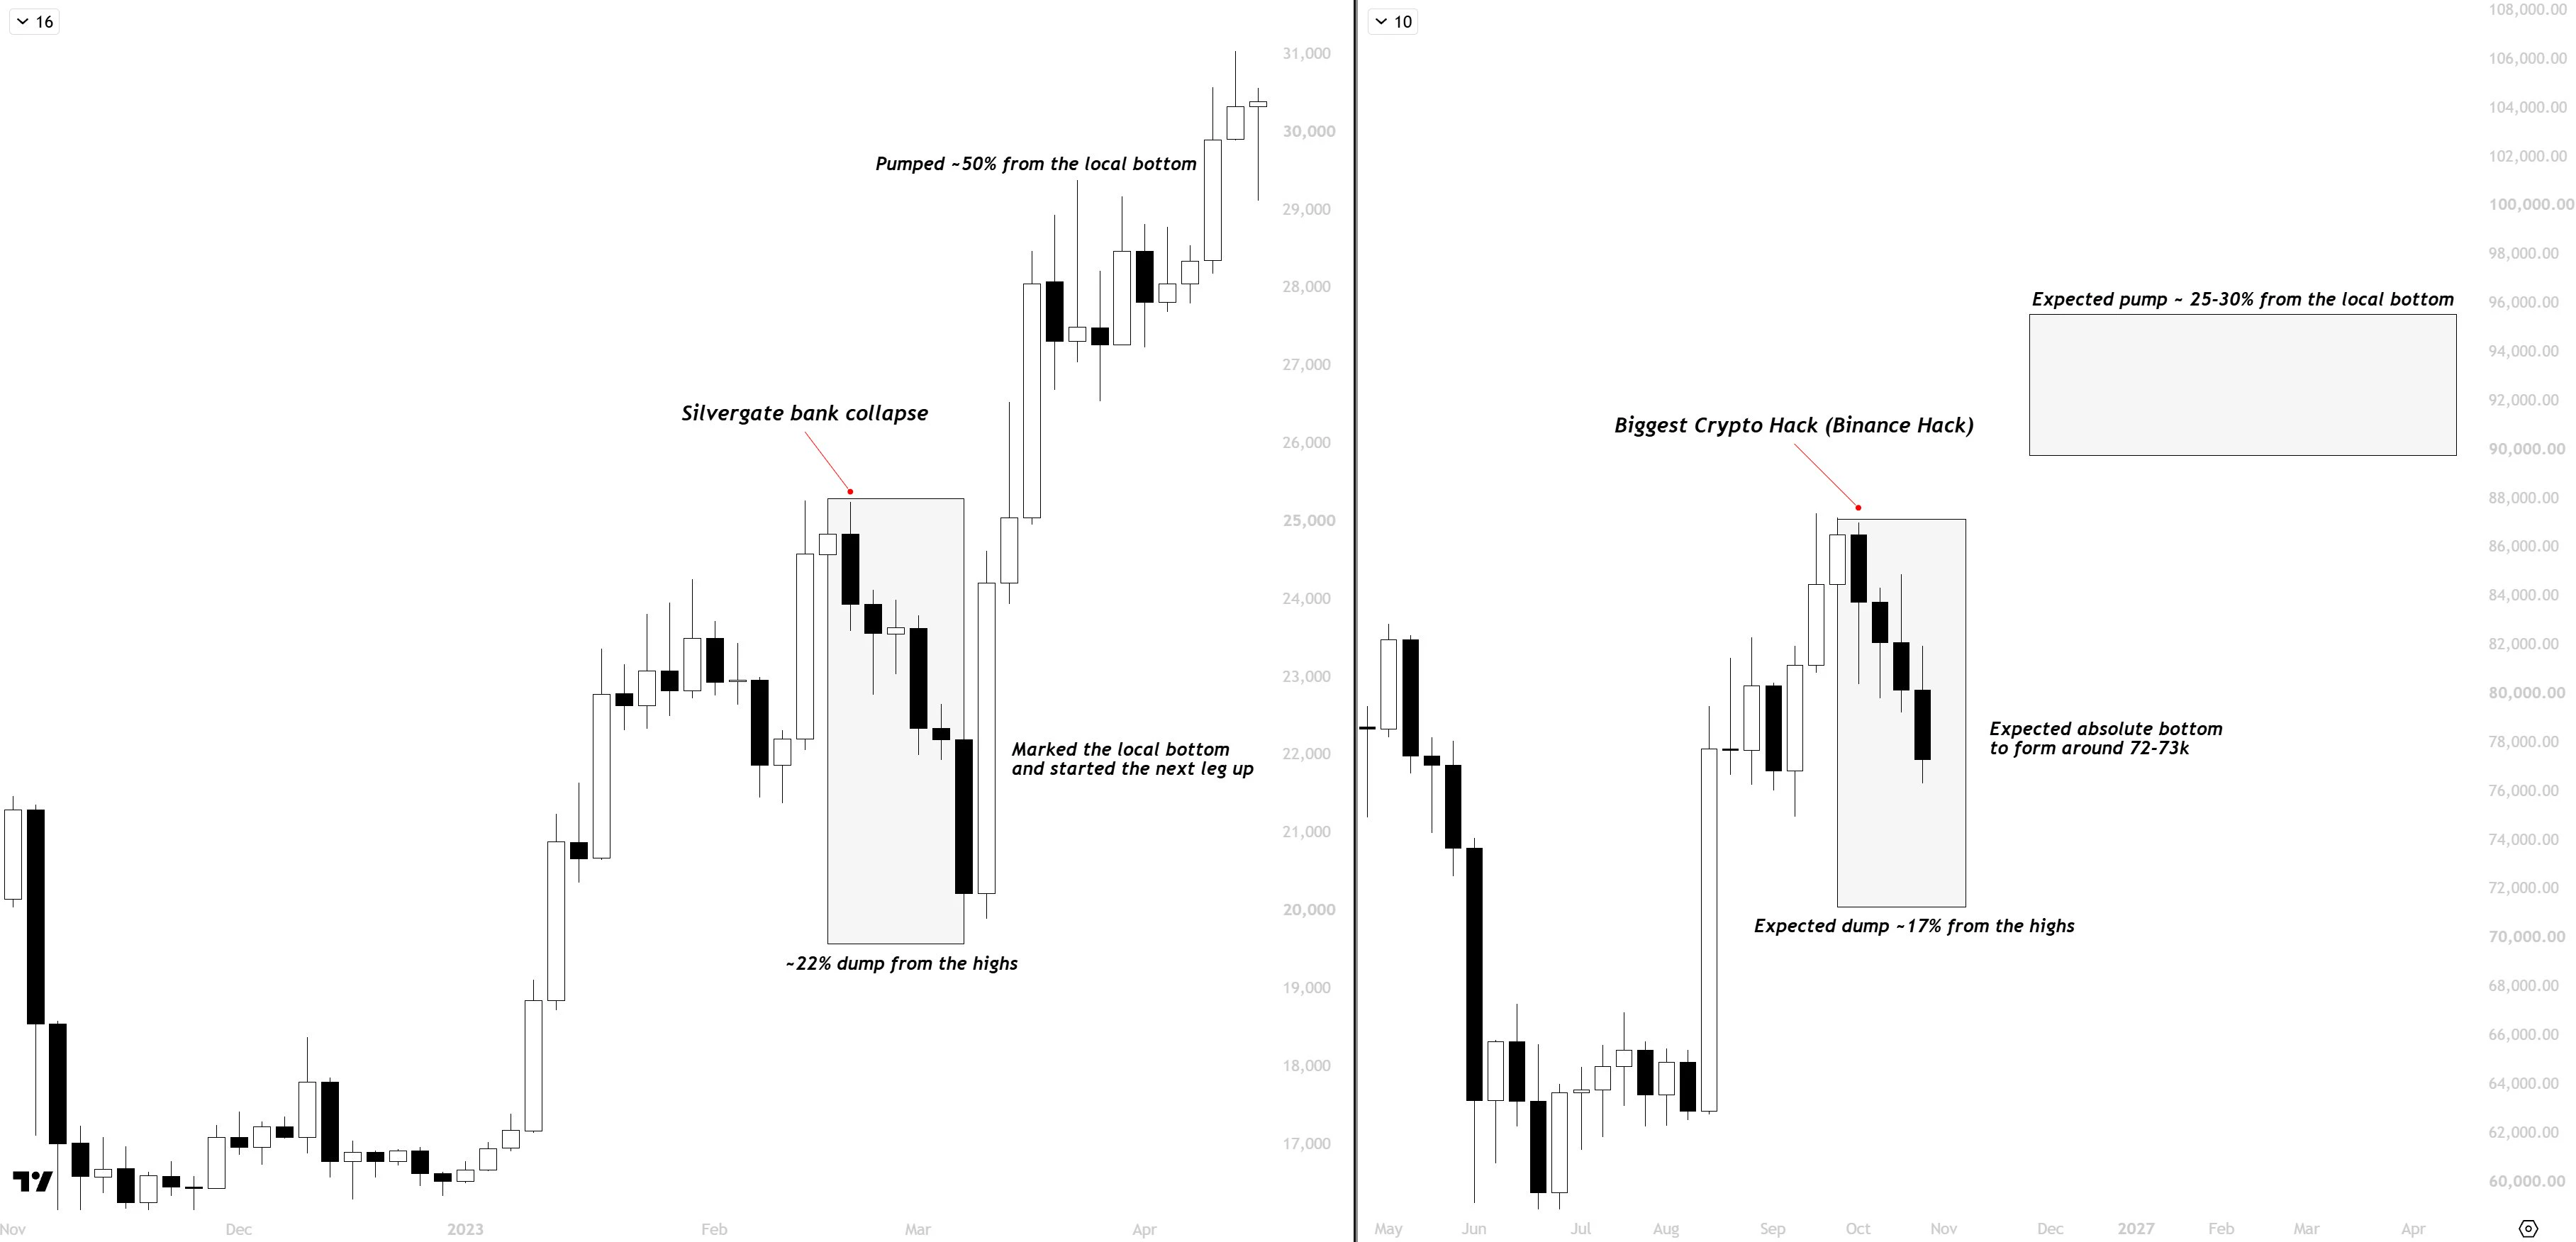
$BTC Last cycle we had a similar bearish catalyst that marked the local bottom,
Price dumped -22% from the highs in 2023 and this time I am expecting it to be around 16-17% dump from the highs.
The intriguing part is that after flushing the overleveraged positions,
Price pumped ~50% from the absolute bottom and the projected pump this time is around 25-30%.
It's nothing new, we get these catalysts play out from time to time, but the market does what it wants to.
Overall, it's just a matter of time before we mark the bottom and absolutely rip towards the upside.
post-image
BTC-0.65%
  • 3
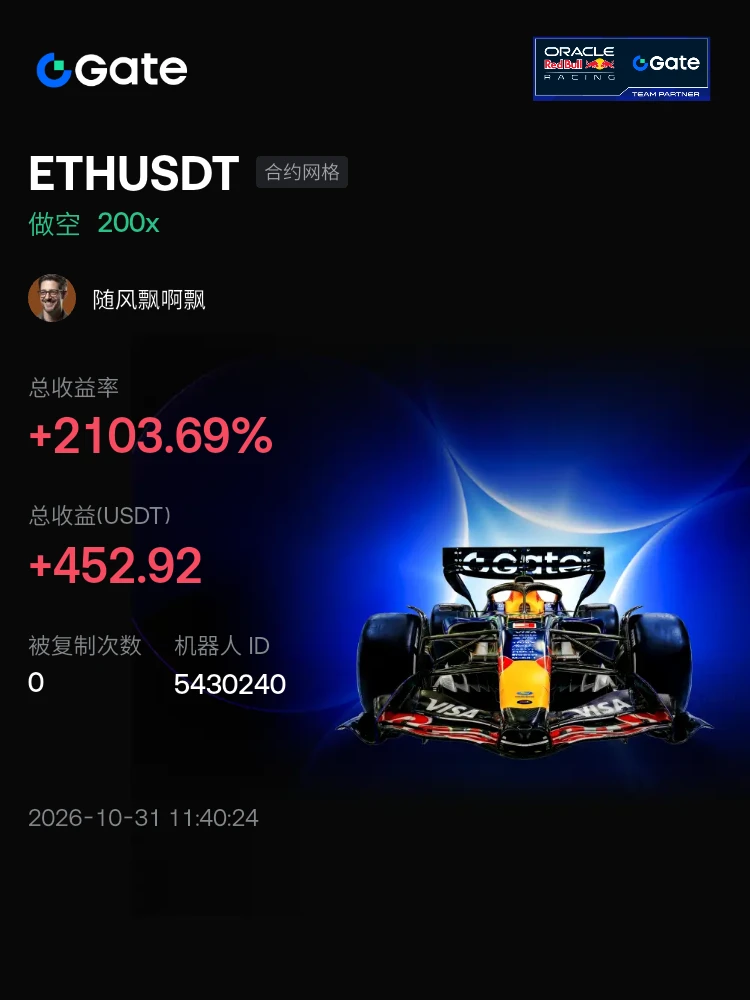
#交易机器人 I'm using the ETHUSDT contract grid bot on Gate—join me in copy trading
post-image
Sometimes what I'm talking about isn't just trading, but personal asset allocation.
I believe that over the long term, the purchasing power of the yuan and the US dollar will decline, and holding BTC or core US stock assets for the long term is the best choice.
Trading is purely about going long or short. Don't keep conflating the two.
Taking US stocks as an example, I took a 20% loss on RKLB and cut my position, so I've stopped buying individual US stocks to try to beat the index. Buying the index is the biggest alpha, unless an opportunity like Nvidia in 2023 or memory stocks in 2025 comes a
post-image
NVDA-4.16%
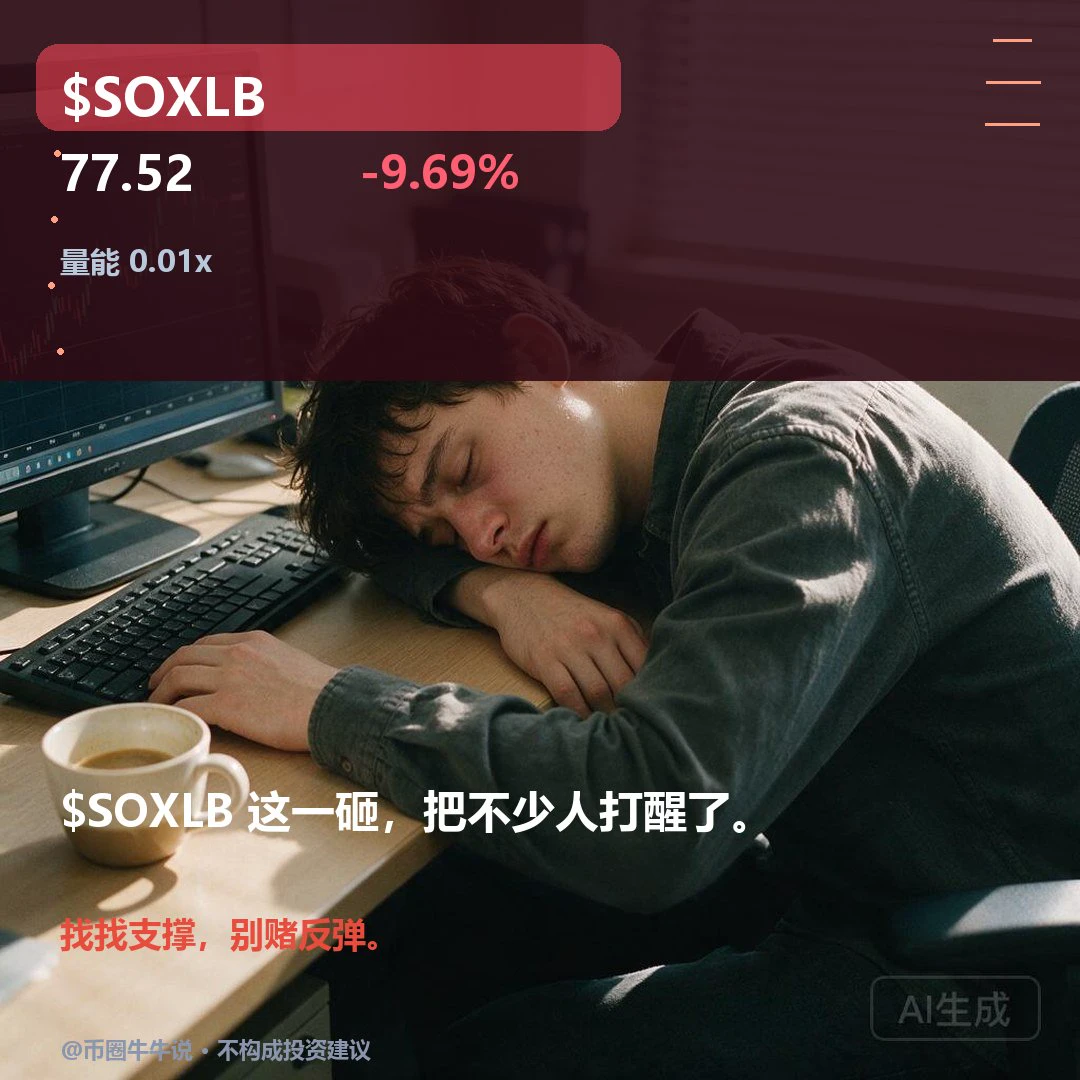
$SOXLB Currently trading at 77.52, down 9.69% over 24H. The 1H trend is weak (RSI 41.58), with price testing support at 70.37; the 4H chart is severely oversold (RSI 20.69). A sustained move above resistance at 88.06 could signal a bullish outlook, while a break below 70.37 could indicate further weakness. Watch for an increase in trading volume; otherwise, the rebound’s sustainability is questionable. The market is highly volatile; for observation only.
post-image
Good morning, recap
Continuing to hold my OP long position; added 1,000 in margin yesterday
Targeting around 0.5; OP's price action today is still pretty good, with a strong rebound #OP
Stay the course
OP-1.31%
#FedKeepsRatesSteady #ShareWeekly
The AI Investment Race: Why Microsoft, Amazon and Alphabet Are Facing Three Different Market Expectations
The artificial intelligence revolution is creating enormous opportunities for the technology industry, but recent quarterly earnings have highlighted an important reality: not every company benefiting from AI growth will receive the same reward from investors.
In my opinion, the next phase of the AI competition will not be decided simply by which company invests the most or reports the fastest revenue growth. The real winners will be businesses capable of
MSFT-1.60%
AMZN-1.55%
GOOGL-1.32%
  • 1
A brief analysis of BTC’s short-term trend through Dow Theory, Chan Theory, Elliott Wave Theory, volume-price relationships, order flow, and price action
Epic fear capitulation: On October 30, trading volume hit an enormous 72.3 billion (the highest in six weeks), accompanied by -2.221 billion Delta (the most extreme selloff day in data history). The price plunged from 78,614 to 76,149, setting a new low for this correction. Early on October 31, it stabilized slightly at 77,236 (a 1,087-point rebound), but volume was only 2.3 billion. Whether 76,149 is the ultimate panic bottom or merely a pau
BTC-0.67%
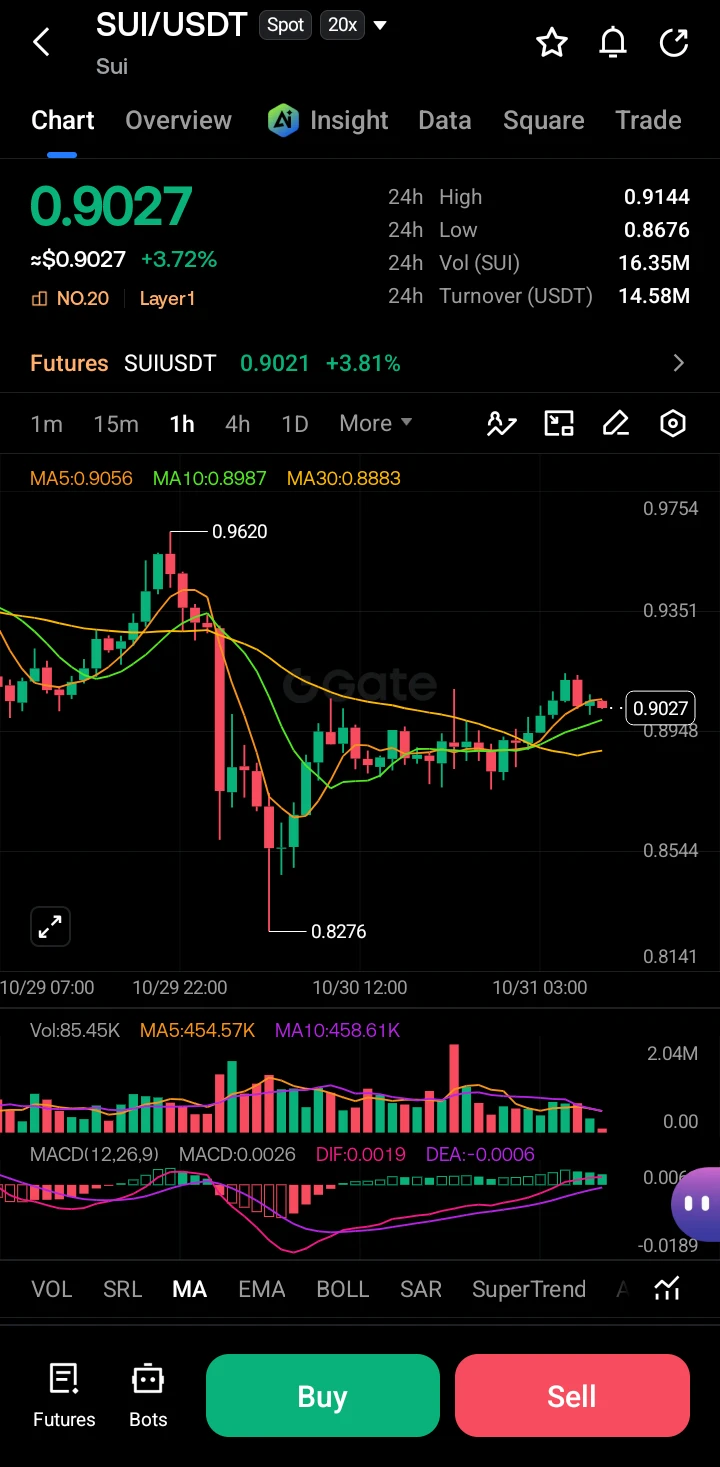
SUI/USDT Market Update (1H Chart).
$SUI ‌
Current Market Situation.
SUI is trading at 0.9027 (+3.72%), recovering after a sharp sell-off. Price has bounced from the 0.8276 low and is now consolidating near the short-term moving averages with mild bullish momentum.
Key Levels
Resistance: 0.9144 (24h high) → 0.9350 → 0.9620
Support: 0.8948 → 0.8880 (MA30) → 0.8676 → 0.8276
Kline Deep Analysis
After the strong drop from 0.9620, price formed a clear lower low at 0.8276, then printed a series of higher lows. Current candles are holding above MA5 (0.9056) and MA10 (0.8987), with MA30 (0.8883) actin
post-image
SUI-1.05%
  • 5
🔥 $TRX $TRX BIG LONG OPPORTUNITY : TRX is showing signs of a potential bullish recovery after experiencing a sharp sell-off from the 0.36000 resistance area. The price is currently trading around 0.32639, with buyers attempting to defend the 0.32000 support zone. A short-term rebound could develop if buying pressure continues to strengthen. 🚀Trading Ideas Long $TRXEntry: 0.32500 – 0.32900TP1: 0.34000SL: 0.31712TP2: 0.35000TP3: 0.36000Trade $TRX here: 👇
post-image
TRX+0.42%
$MAGMA
Bulls are back! The strong rebound may have only just begun! Entry range: $0.3600–$0.3750 Take-profit target 1: $0.4000 Take-profit target 2: $0.4500 Take-profit target 3: $0.5000 Stop-loss: $0.2739$MAGMA After a strong rebound from the $0.2500 support area, buyers pushed the price back up to around $0.3800. The chart shows that, as momentum strengthens, the market may be poised for a bullish reversal.
post-image
MAGMA-0.57%
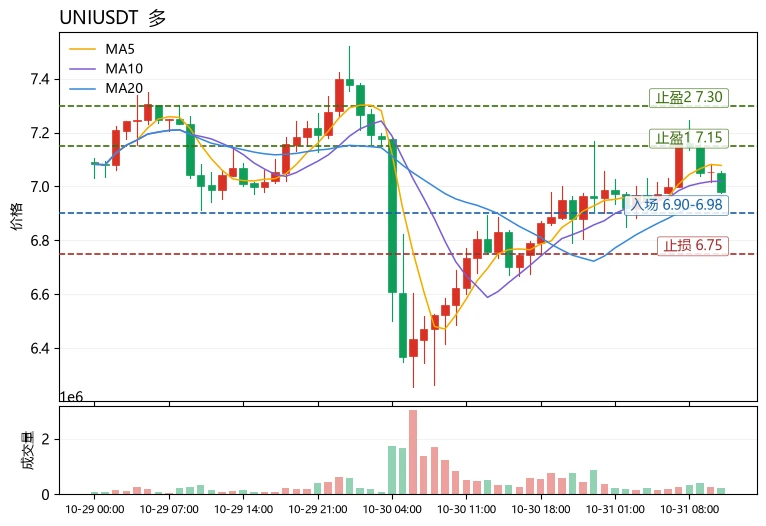
$UNI Current price 6.981, 24h +3.71%, trading volume 66.9M USDT; MA5=7.078 has moved above MA20=6.9594, the MACD histogram at +0.01206 remains bullish, RSI at 51.3 is in neutral-to-strong territory, price is trading within the Bollinger Bands [6.76328, 7.15552], the funding rate of -0.0048% indicates shorts are paying a slight cost, and the Fear & Greed Index at 30 remains in fear territory. The data suggests that the trend structure is beginning to turn bullish, but has not yet entered an acceleration phase.
Here, let's use $UNI to explain a reusable chart-reading method—using moving averag
post-image
UNI+3.05%
TRX+0.42%
AVAX/USDT Short Analysis (1H Chart)
$AVAX ‌
Current Market Situation.
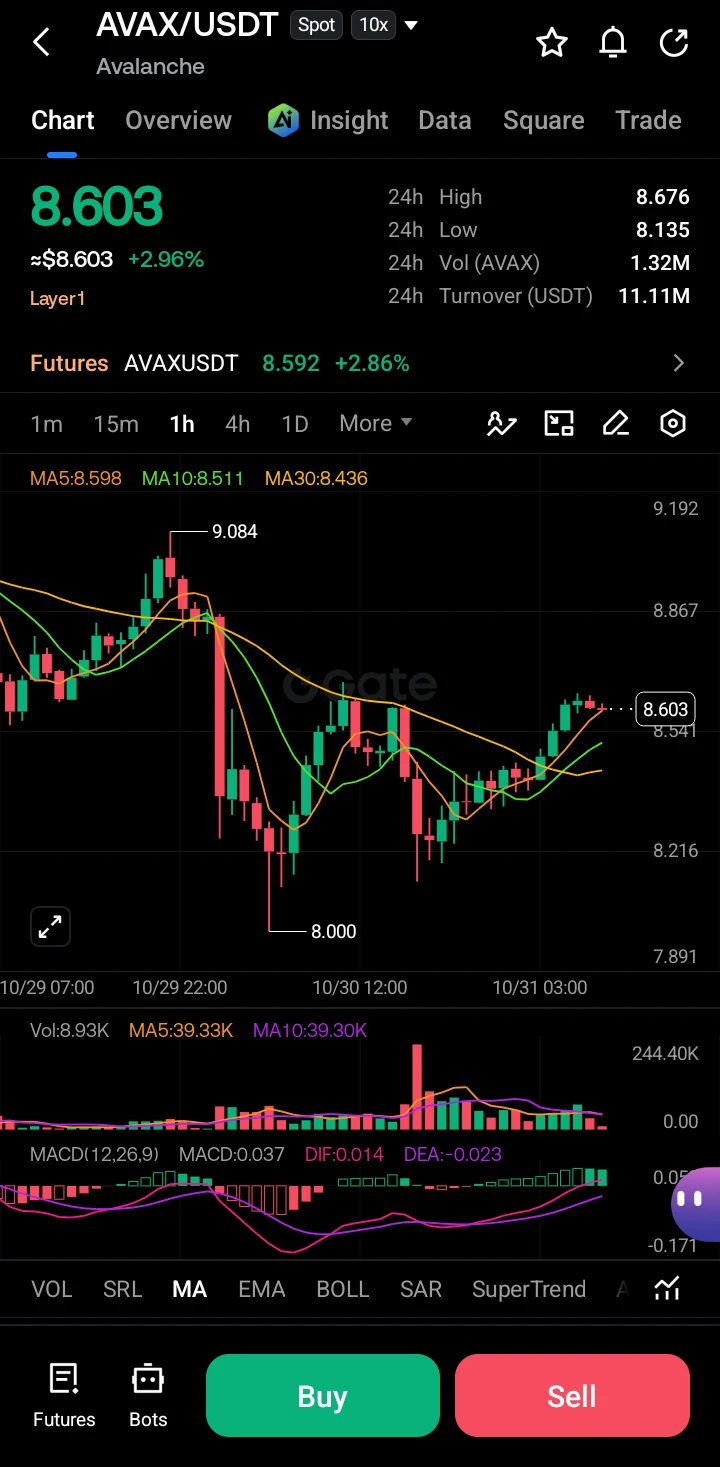
AVAX is trading at 8.603 (+2.96%), recovering after a sharp dump from 9.08 to the 8.00 low. Price is holding above the short-term MAs (MA5 8.598, MA10 8.511, MA30 8.436) with improving MACD momentum. 24h range sits between 8.135–8.676 on moderate volume.
Key Levels.
Resistance: 8.67–8.70 (24h high) → 8.85–9.00
Support: 8.40–8.45 (MA30 zone) → 8.13–8.20 → 8.00 (major low)
Kline Deep Analysis
Strong rejection at 9.08 followed by aggressive selling into 8.00 formed a clear capitulation low. Subsequent candles show higher lows
post-image
AVAX-0.10%
  • 12
  • 1
Recently, I’ve formed the view that silver is highly likely to break below $45 per ounce over the next three months. If it does fall below $40, I plan to enter, build a position, and sell after a short-term rebound. $XAG
Risk warning: The above is solely my personal opinion and does not constitute investment advice. Markets involve risk; enter with caution.
post-image
XAG+0.47%
Load More

Join 40 M users in our growing community

⚡️ Join 40 M users in the crypto craze discussion

💬 Engage with your favorite top creators

👍 See what interests you

Trending Topics

BTC大跌

226.87k Views39.54k Discussing

$BTC briefly fell below $77,000 and remains under pressure around the $77K zone, with its 24-hour decline still above 4%. With risk appetite weakening and Fed uncertainty rising, where is the next key support after losing $80K?

IntelBeatsEarningsButStockPlunges

16.37k Views783 Discussing

StrategySTRCNears100ParValue

20.37k Views4.05k Discussing

View More